Clinical Trial
. 2018 Nov 1;124(21):4248-4259.
doi: 10.1002/cncr.31736. Epub 2018 Oct 25.

Changes in body mass index, height, and weight in children during and after therapy for acute lymphoblastic leukemia

Affiliations
Clinical Trial

Changes in body mass index, height, and weight in children during and after therapy for acute lymphoblastic leukemia

Emily K Browne et al. Cancer. .

Abstract

Background: Children with acute lymphoblastic leukemia (ALL) have an increased risk of obesity and short stature. To the authors' knowledge, data regarding patients treated on contemporary protocols without cranial irradiation are limited.

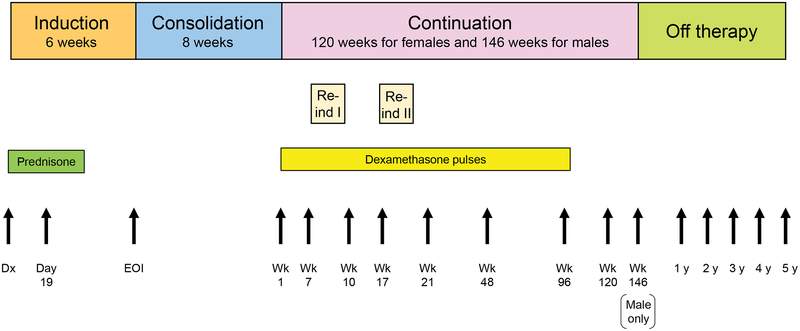
Methods: Changes in z scores for body mass index (BMI), height, and weight from the time of diagnosis to 5 years off therapy were evaluated using multivariable analysis in 372 children with ALL who were aged 2 to 18 years at the time of diagnosis and were enrolled on the St. Jude Children's Research Hospital Total XV protocol from 2000 through 2007.

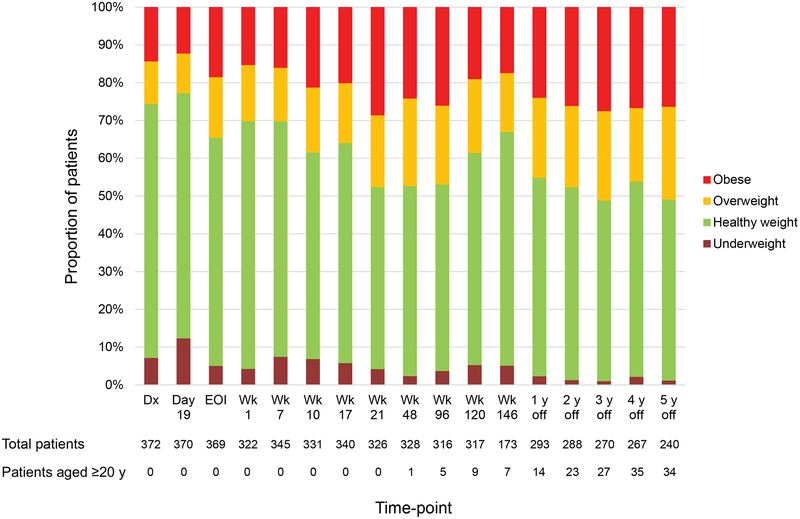
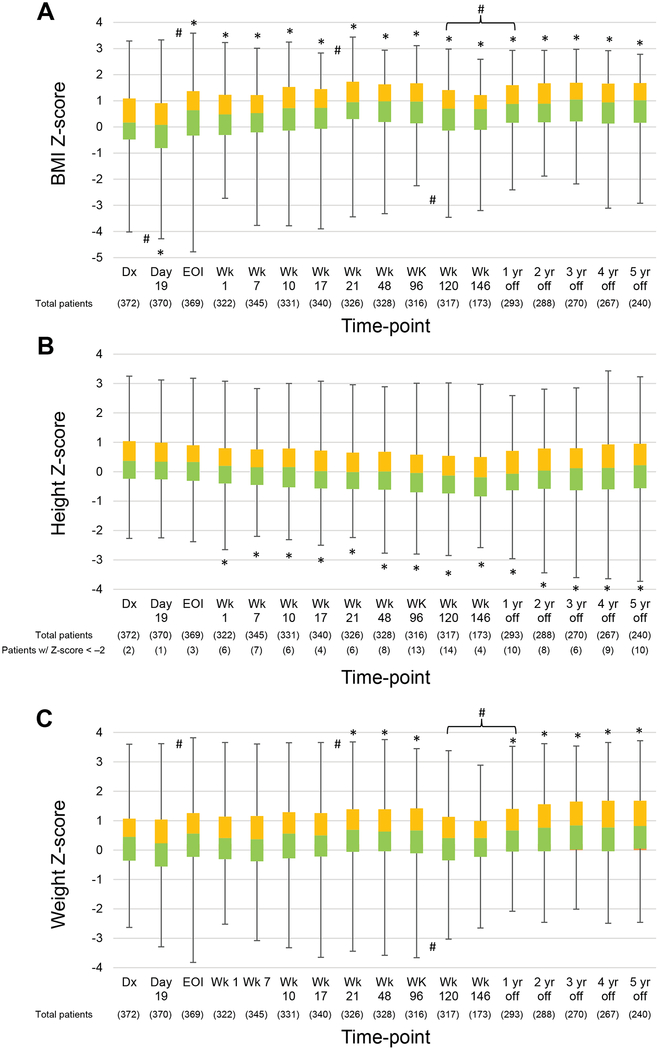
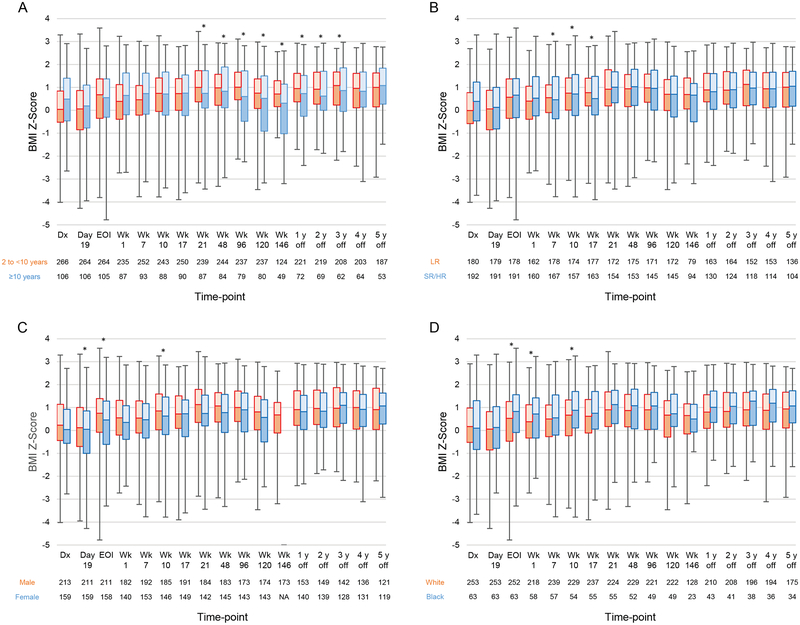
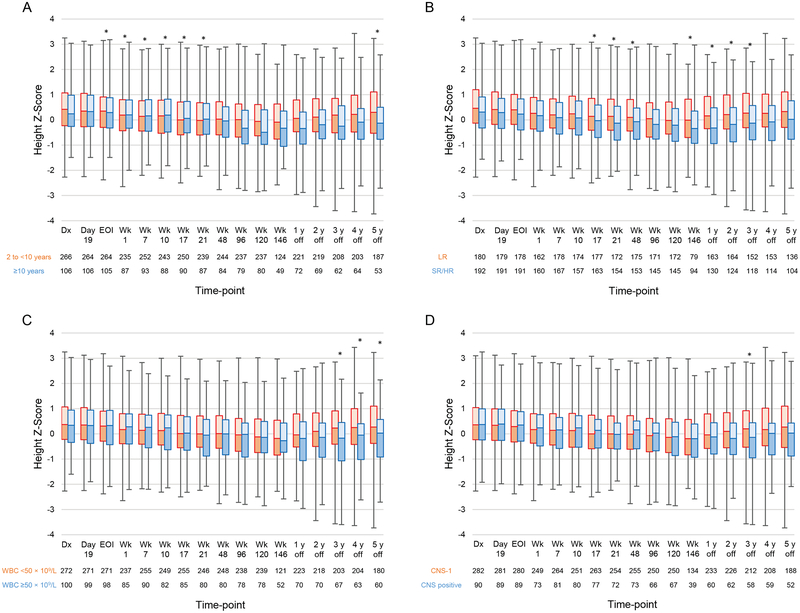
Results: The percentage of overweight/obese patients increased from 25.5% at the time of diagnosis to approximately 50% during the off-therapy period. Median BMI z scores increased significantly during glucocorticoid therapy (induction: ∆0.56; 95% confidence interval [95% CI], 0.29-0.64 [P<.001]; and reinduction II: ∆0.22; 95% CI, 0.13-0.49 [P=.001]) and during the first year after therapy (∆0.18; 95% CI, 0.08-0.46 [P=.006]). Among patients who were of healthy weight/underweight at the time of diagnosis, those aged 2 to <10 years at diagnosis had a significantly higher risk of becoming overweight/obese during or after therapy compared with those aged ≥10 years (P=.001). Height z scores declined during treatment and improved after therapy. Being aged 2 to <10 years at the time of diagnosis, being of low-risk status, having a white blood cell count < 50×109 /L at the time of diagnosis, and having negative central nervous system disease were associated with significantly better improvements in z scores for height during the off-therapy period compared with being aged ≥10 years, being of standard-risk/high-risk status, having a white blood cell count ≥ 50×109 /L, and having positive central nervous system disease, respectively.

Conclusions: The results of the current study demonstrate that obesity is prevalent, and height growth, especially in patients with identified risk factors, appears compromised. Multidisciplinary intervention should begin during induction therapy and continue during the off-therapy period.

Keywords: acute lymphoblastic leukemia (ALL); body mass index (BMI); children; height; weight..


Conflict of interest statement

Conflict of interest disclosures:

The authors have no potential conflicts of interest, including specific financial interests, relationships, or affiliations relevant to the subject of this manuscript.

Figures

Figure 1.
Figure 1.
Treatment schema of the Total XV protocol and time-points for height and weight measurements. Abbreviations: Re-ind, reinduction therapy; Dx, diagnosis; EOI, end of induction; Wk, week.
Figure 2.
Figure 2.
Longitudinal changes in the percentage of patients in each body mass index category. Abbreviations: Dx, diagnosis; EOI, end of induction; Wk, week.
Figure 3.
Figure 3.
Longitudinal changes in the median body mass index (BMI) (A), height (B), and weight (C) Z-scores of patients during therapy and in the off-therapy period. Boxes show scores from the first quartile to the third quartile. The border between the 2 boxes shows the median Z-score. Error bars show minimum and maximum values. Significant differences from baseline values and intervals with significant changes in Z-scores are indicated by the symbols * and #, respectively. As only males received week 146 therapy, interval changes between week 120 and 1 year off therapy are evaluated. Symbols above the line represent increases in Z-scores; those below the line show decreases between 2 time-points. Abbreviations: BMI, body mass index; Dx, diagnosis; EOI, end of induction; Wk, week.
Figure 4.
Figure 4.
Longitudinal changes in the median body mass index (BMI) Z-scores according to (A) age (2 to <10 years vs. ≥10 years); (B) treatment risk (low risk [LR] vs. standard/high risk [SR/HR]); (C) sex (male vs. female); and (D) race (white vs. black). Boxes show scores from the first quartile to the third quartile. The border between the 2 boxes shows the median Z-score. Error bars show minimum and maximum values. Time-points with significant differences between the 2 groups in the mixed model are indicated by asterisks. Abbreviations: BMI, body mass index; Dx, diagnosis; EOI, end of induction; Wk, week.
Figure 5.
Figure 5.
Longitudinal changes in the median height Z-scores according to (A) age (2 to <10 years vs. ≥10 years); (B) treatment risk (low risk [LR] vs. standard/high risk [SR/HR]; (C) white blood cell count (WBC) at diagnosis (<50×109/L vs. ≥50×109/L); and (D) central nervous system (CNS) disease status at diagnosis (CNS-1 vs. CNS positive). Boxes show scores from the first quartile to the third quartile. The border between the 2 boxes shows the median Z-score. Error bars show minimum and maximum values. Time-points at which there were significant differences between the 2 groups in the mixed model are indicated by asterisks. Abbreviations: Dx, diagnosis; EOI, end of induction; Wk, week.

References

    1. Inaba H, Greaves M, Mullighan CG. Acute lymphoblastic leukaemia. Lancet. 2013;381:1943–1955. - PMC - PubMed
    1. Ogden CL, Carroll MD, Lawman HG, et al. Trends in obesity prevalence among children and adolescents in the United States, 1988‒1994 through 2013‒2014. JAMA. 2016;315:2292–2299. - PMC - PubMed
    1. Diller L, Chow EJ, Gurney JG, et al. Chronic disease in the Childhood Cancer Survivor Study cohort: a review of published findings. J Clin Oncol. 2009;27:2339–2355. - PMC - PubMed
    1. Zhang FF, Kelly MJ, Saltzman E, Must A, Roberts SB, Parsons SK. Obesity in pediatric ALL survivors: a meta-analysis. Pediatrics. 2014;133:e704–e715. - PMC - PubMed
    1. Zhang FF, Liu S, Chung M, Kelly MJ. Growth patterns during and after treatment in patients with pediatric ALL: a meta-analysis. Pediatr Blood Cancer. 2015;62:1452–1460. - PMC - PubMed

Publication types

MeSH terms