. 2018 Oct 26;123(10):1127-1142.
doi: 10.1161/CIRCRESAHA.118.312804.

Transcriptome Analysis Reveals Nonfoamy Rather Than Foamy Plaque Macrophages Are Proinflammatory in Atherosclerotic Murine Models

Affiliations

Transcriptome Analysis Reveals Nonfoamy Rather Than Foamy Plaque Macrophages Are Proinflammatory in Atherosclerotic Murine Models

Kyeongdae Kim et al. Circ Res. .

Abstract

Rationale: Monocyte infiltration into the subintimal space and its intracellular lipid accumulation are the most prominent features of atherosclerosis. To understand the pathophysiology of atherosclerotic disease, we need to understand the characteristics of lipid-laden foamy macrophages in the subintimal space during atherosclerosis.

Objective: We sought to examine the transcriptomic profiles of foamy and nonfoamy macrophages isolated from atherosclerotic intima.

Methods and results: Single-cell RNA sequencing analysis of CD45+ leukocytes from murine atherosclerotic aorta revealed that there are macrophage subpopulations with distinct differentially expressed genes involved in various functional pathways. To specifically characterize the intimal foamy macrophages of plaque, we developed a lipid staining-based flow cytometric method for analyzing the lipid-laden foam cells of atherosclerotic aortas. We used the fluorescent lipid probe BODIPY493/503 and assessed side-scattered light as an indication of cellular granularity. BODIPYhiSSChi foamy macrophages were found residing in intima and expressing CD11c. Foamy macrophage accumulation determined by flow cytometry was positively correlated with the severity of atherosclerosis. Bulk RNA sequencing analysis showed that compared with nonfoamy macrophages, foamy macrophages expressed few inflammatory genes but many lipid-processing genes. Intimal nonfoamy macrophages formed the major population expressing IL (interleukin)-1β and many other inflammatory transcripts in atherosclerotic aorta.

Conclusions: RNA sequencing analysis of intimal macrophages from atherosclerotic aorta revealed that lipid-loaded plaque macrophages are not likely the plaque macrophages that drive lesional inflammation.

Keywords: RNA-seq; atherosclerosis; flow cytometry; foam cells; macrophages; mice.


Conflict of interest statement

DISCLOSURES

The authors declare no competing financial interests

Figures
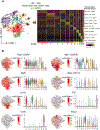
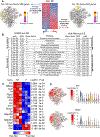
Figure 1.
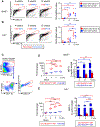
Figure 1.. Single-cell (sc) RNA-seq reveals MØ subpopulations in murine atherosclerotic aorta.
(A) Left, scRNA-seq of CD45+ cells isolated from pooled whole aortas of Ldlr−/− mice (n = 6) fed a WD for 12 weeks. Dimensionality reduction and identification of clusters of transcriptionally similar cells were performed in an unsupervised manner using Seurat package. Right, heatmap showing the top 30 differentially expressed genes for each leukocyte cluster. Normalized gene expression is shown. (B) Expression of principal hematopoietic markers in the 11 identified cell clusters shown as a t-SNE plot with colors corresponding to expression levels or shown as a distribution of gene expression levels in clusters.
Figure 2.
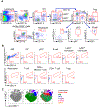
Figure 2.. BODIPY493/503-based lipid staining and flow cytometry define lipid-laden cells from atherosclerotic aortas.
(A) Lipid staining of atherosclerotic lesions. The lesions were first stained with BODIPY493/503 (green) and imaged, then subsequently stained with oil red O and imaged (red). (B) Gating strategy of lipid probe-based flow cytometry for detecting aortic foam cells. (C) Live/dead staining using Zombie Aqua showed that most autofluorescent cells were dead. (D) Cells with high granularity (SSChi) were strongly stained with BODIPY493/503. Aortic cells from B6, normal diet (ND)-fed Ldlr−/−, Western diet (WD)-fed Ldlr−/−, and ApoE−/− mice were analyzed. This result is representative of at least three independent experiments. (E) Aortic SSChiBODIPYhi cells were found in atherosclerotic intimal tissue but not in adventitia or normal aorta. The separation of adventitia from aorta was performed by partial enzyme digestion. SSChiBODIPYhi foam cells were counted by flow cytometry (n = 9 per group).
Figure 3.
Figure 3.. The frequency of SSChiBODIPYhi cells is positively correlated with severity of atherosclerosis.
(A, B) Comparison of atherosclerosis assessment by en face oil red O staining and lipid probe-assisted flow cytometry in ApoE−/− (n = 6) and Ldlr−/− (n = 7) mice. Left, increase in SSChiBODIPYhi foam cells (red, percentage of foam cells; blue, number of foam cells) during a WD for 4, 8 or 12 weeks. Right, similarity between atherosclerosis assessment by flow cytometry and en face oil red O staining. The size of the oil red O stained area (red) and number of foam cells (blue) were normalized to between 0 and 1. *P < 0.01 and **P < 0.001. (C) Gating strategy to identify foamy MØs from whole atherosclerotic aorta. (D, E) Comparison of abundance changes in aortic foamy MØs and total aortic MØs in ApoE−/- (n = 6) and Ldlr−/- (n = 7) mice. Left (dot graph), fold changes compared with cells at the 0-time point (t0 = 0 weeks; base = 1). The number of foamy MØs (red) dramatically increased during WD. Right (bar graph), percentages of foamy (red) and non-foamy (blue) MØs in total aortic singlets at each time point (4, 8, and 12 weeks). *P < 0.05, **P < 0.01 and *** P < 0.001.
Figure 4.
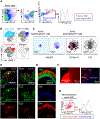
Figure 4.. CD45+SSChiBODIPYhi leukocytes originate from MØs.
(A) Gating strategy to identify immune cell populations, including MØs, DCs, monocytes, T cells, Tregs, B cells, and neutrophils from whole atherosclerotic aorta. (B) Representative plots of SSC and BODIPY levels from aortic immune cells in atherosclerosis. (C) t-SNE analysis of FACS data. The colored clusters correspond to each leukocyte population. CD45+SSChiBODIPYhi foam cells (red) mostly overlapped with the MØ population. The results are representative of at least three independent experiments.
Figure 5.
Figure 5.. SSChiBODIPYhiCD11c+ MØs contain cytosolic lipid droplets and reside in the atherosclerotic intima.
(A) Flow cytometric detection of foamy MØs from Ldlr −/− mice fed a WD for 12 weeks. Foamy MØ (red box) CD11c levels were higher than in non-foamy MØs (blue box). These plots represent of data from six atherosclerotic aortas. (B) t-SNE analysis of FACS data. The majority of foamy MØs (red) overlapped with CD11c+ MØs (blue). These figures are representative of three experiments. (C) Morphology of aortic SSChiBODIPYhi and SSCloBODIPYlo MØs. SSChiBODIPYhi and SSCloBODIPYlo cells were sorted from atherosclerotic aortas (n = 3), stained with Hema 3 (left) or oil red O (middle), and analyzed by optical or transmission electron microscopy. (D) Immunofluorescence staining of CD11c and MOMA-2. Lesional CD11c+ and MOMA-2+ cells (red) were co-stained with BODIPY493/503 (green). (E) Immunofluorescence staining of CD11c (red) and CD206 (blue) in an atherosclerotic aortic arch. CD11c (red) staining was mostly detected in the aortic lesion and some adventitial areas. The green signal is autofluorescence. (F) Whole-mount immunostaining of CD11c in intimal lesions. (G) Comparison of CD206 and CD11c expression in adventitial MØ (blue) and intimal foamy MØs (red).
Figure 6.
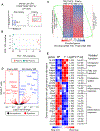
Figure 6.. Transcriptome profiling reveals distinct gene expression between intimal foamy and non-foamy MØs in atherosclerosis.
(A) FACS sorting of live (PI-) SSCloBODIPYlo and SSChiBODIPYhi MØs from the aortic tissues without adventitia of ApoE −/− mice (n = 6) with fed a WD for 28 weeks. (B) Principal component analysis (PCA) of variances in the bulk RNA-seq dataset of intima foamy and non-foamy MØs. PCA plot was generated using the 500 most variable genes. (C) Differential expression between foamy and non-foamy MØs represented as a heatmap (genes are sorted by t-statistic). GSEA plots for two representative KEGG pathways (cytokine-cytokine receptor interaction for non-foamy MØs and lysosome for foamy MØs) are shown next to the heatmap. (D) Volcano plot of genes enriched in each cell group. Genes with adjusted P values < 0.05 (red) are arranged by their P values and fold changes (log2) (E) Heatmap of representative genes involved in foam cell formation during atherosclerosis, as assessed by a comparison between intimal non-foamy and foamy MØs. Genes were enriched in each non-foamy (NF) or foamy (F) MØ groups with an adjusted P value < 0.05. The fold change of each gene (log2FC) and adjusted P value (P adj) were shown with the heatmap.
Figure 7.
Figure 7.. Intimal non-foamy MØs, rather than foamy MØs, are pro-inflammatory.
(A) Top 100 (left) and bottom 100 (right) genes sorted by t-statistic from bulk RNA-seq were used to identify clusters corresponding to foamy and non-foamy MØs in the scRNA-seq dataset. Averaged normalized expression of these gene is shown as a tSNE plot with colors corresponding to averaged normalized expression. (B) Enriched KEGG pathways comparing cluster 1 with cluster 4 in the scRNA-seq dataset (left) or comparing foamy MØs with non-foamy MØs (right). All pathways listed are statistically significant in both comparisons (adjusted P value < 0.01). (C, D) Analysis of IL-1β signaling pathway genes in bulk RNA-seq (C, heatmap) and scRNA-seq (D, plots). The genes were enriched in each NF or F MØ groups (adjusted P value < 0.05) or each cluster (adjusted P value < 0.01; logFC > 0).
Figure 8.
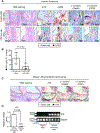
Figure 8.. IL-1β mRNA expression in human and mouse atheroma.
(A) Localization of IL-1β mRNA in human atheroma (n = 4). CD68 (DAB staining) and H&E staining was performed to identify foamy MØ-rich and fibrous cap regions with MØs. In situ hybridization for DapB and human PPIB were performed as negative and positive controls, respectively. Stars indicate foam cells and arrow heads mark IL1β-stained cells. (B) The percentage of IL-1β mRNA-positive cells in CD68-positive areas of fibrous cap or foam cell rich areas (five different areas, 8.4×104 μm2 each) in human atheroma (n=4). (C) IL-1β mRNA expression in mouse atheroma. The stars indicate foam cells and the arrowhead indicates Il1b-stained cells. These figures are representative of three experiments. (D) Single-cell qPCR analysis of IL-1β mRNA expression in foamy or intimal non-foamy MØs sorted from mouse atherosclerotic aorta. Left, mRNA expression was normalized to Gapdh mRNA levels (cells from 4 mice; N.D, not detected). Right, gel analysis of qPCR end products; Il1b and Gapdh.

Comment in

References

    1. Hansson GK, Hermansson A. The immune system in atherosclerosis. Nat Immunol. 2011;12:204–212 - PubMed
    1. Hansson GK, Libby P. The immune response in atherosclerosis: A double-edged sword. Nat Rev Immunol. 2006;6:508–519 - PubMed
    1. Weber C, Noels H. Atherosclerosis: Current pathogenesis and therapeutic options. Nat Med. 2011;17:1410–1422 - PubMed
    1. Suzuki H, Kurihara Y, Takeya M, Kamada N, Kataoka M, Jishage K, Ueda O, Sakaguchi H, Higashi T, Suzuki T, Takashima Y, Kawabe Y, Cynshi O, Wada Y, Honda M, Kurihara H, Aburatani H, Doi T, Matsumoto A, Azuma S, Noda T, Toyoda Y, Itakura H, Yazaki Y, Kodama T, et al. A role for macrophage scavenger receptors in atherosclerosis and susceptibility to infection. Nature. 1997;386:292–296 - PubMed
    1. Feig JE, Pineda-Torra I, Sanson M, Bradley MN, Vengrenyuk Y, Bogunovic D, Gautier EL, Rubinstein D, Hong C, Liu J, Wu C, van Rooijen N, Bhardwaj N, Garabedian M, Tontonoz P, Fisher EA. Lxr promotes the maximal egress of monocyte-derived cells from mouse aortic plaques during atherosclerosis regression. The Journal of clinical investigation. 2010;120:4415–4424 - PMC - PubMed

Publication types