. 2018 Oct 25;19(1):172.
doi: 10.1186/s13059-018-1536-8.

Clust: automatic extraction of optimal co-expressed gene clusters from gene expression data

Affiliations

Clust: automatic extraction of optimal co-expressed gene clusters from gene expression data

Basel Abu-Jamous et al. Genome Biol. .

Abstract

Identifying co-expressed gene clusters can provide evidence for genetic or physical interactions. Thus, co-expression clustering is a routine step in large-scale analyses of gene expression data. We show that commonly used clustering methods produce results that substantially disagree and that do not match the biological expectations of co-expressed gene clusters. We present clust, a method that solves these problems by extracting clusters matching the biological expectations of co-expressed genes and outperforms widely used methods. Additionally, clust can simultaneously cluster multiple datasets, enabling users to leverage the large quantity of public expression data for novel comparative analysis. Clust is available at https://github.com/BaselAbujamous/clust .

Keywords: Click; Clust; Clustering; Cross-clustering; Gene expression data; Hierarchical clustering; K-means; Markov clustering; Self-organizing maps; WGCNA.


Conflict of interest statement

Ethics approval and consent to participate

Not applicable.

Consent for publication

Not applicable.

Competing interests

The authors declare that they have no competing interests.

Publisher’s Note

Springer Nature remains neutral with regard to jurisdictional claims in published maps and institutional affiliations.

Figures

Fig. 1
Fig. 1
Expectations and outcomes for application of data-partitioning methods to co-expression clustering. a, b Simulated gene expression data for 500 genes with increasing noise (D1–D4) (Additional file 1: Table S1). a All genes. b Profiles of the genes in each of the three simulated clusters as well as the extra unclustered genes at each one of the four levels of dispersion. The horizontal axis of each plot represents the six different time-points, while the vertical axis represents gene expression values. c The results of applying a partitioning method (k-means in this case) to the same simulated datasets. d Heat-maps that show the percentage of genes in a cluster that also fit well within each one of the other clusters
Fig. 2
Fig. 2
Pipeline of the steps of the clust method. The clust pipeline is composed of four major steps: (1) data pre-processing of the one or more input raw datasets, (2) production of a pool of seed clusters, (3) cluster evaluation and the selection of a subset of elite seed clusters, and (4) the optimization and completion of the elite seed clusters to produce final clusters
Fig. 3
Fig. 3
Evaluation of the performance of clustering methods. a Similarity of clustering results generated by each pair of methods measured by the Adjusted Rand Index (ARI); 1.0 means exactly similar and 0.0 means completely dissimilar. bd Evaluation of clustering performance over all 100 datasets. b The percentage of input genes that were included in clusters; c the average dispersion of clusters measured by weighted-averaging of individual cluster MSE values; d percentage of the overlap amongst clusters, as measured by the JI index. e Evaluation of clustering performance over all 100 datasets as measured by average rank across 7 cluster validation indices that clust does not directly optimize; the indices are Davies–Bouldin (DB) index, Bayesian information criterion (BIC), Silhouette, Calinski-Harabasz (CH) index, Ball and Hall (BH) index, Xu index, and within-between (WB) index (Additional file 2: Figures S4 to S11, Additional files 5, 6, and 9: Tables S3, S4 and S7)
Fig. 4
Fig. 4
Profiles of the genes in the clusters generated by methods when applied to dataset D83. This figure visually shows a sample of the results of each one of the methods when applied over the same dataset, which is the dataset D83 (Additional files 4 and 6: Tables S2 and S4). This dataset is the time-series dataset of which the numbers of clusters generated by the eight methods are more similar to each other than any other time-series dataset (measured by the least squares metric). D83 is a budding yeast dataset with the accession GSE72423 and was generated using the Affymetrix Yeast Genome 2.0 microarray. Cells were grown in selective media supplemented with dextrose as a pre-culture and then shifted to media containing ethanol as the sole carbon source. Samples were taken at 0, 0.5, 1, 4, and 12 h after medium transfer. The numbers of clusters generated for this dataset by clust, CC, k-means, SOMs, HC, MCL, Click, and WGCNA were 15, 2, 2, 2, 2, 6, 7, and 11, respectively. This figure shows all 15 clusters generated by clust in the first row. Then, the most similar clusters generated by the other methods to each one of the 15 clust’s clusters are aligned below them. The title of each sub-plot shows the name of the cluster and the number of genes in that cluster between parentheses. The horizontal axis of each sub-plot represents the five time-points in the dataset D83 while the vertical axis represents the normalized gene expression value. The profiles of all individual genes in a cluster are drawn as lines on top of each other in its corresponding sub-plot
Fig. 5
Fig. 5
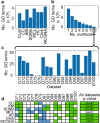
Evaluation of GO term enrichment in the results of the clustering methods. a The total numbers (sum) of GO terms detected as significantly enriched in the results of each of the eight methods across the 20 selected datasets. b Numbers of terms detected as significantly enriched in the same dataset by x or more methods; over the 20 datasets, 7404 terms were detected by at least one method, 2873 (39%) of which are exclusive to a single method, and only 503 (7%) terms were unanimously agreed by all eight methods. c The distribution of the 503 unanimously agreed GO terms over the 20 datasets. d Pairwise comparisons of the p values of the unanimously agreed GO terms in the clusters returned by clust with each of the other clustering methods. Green squares indicate that the p values for the GO terms returned by clust were better than those of the comparative method (Wilcoxon test p value ≤ 0.01), blue squares indicate the opposite result (Wilcoxon p value ≥ 0.99), and white squares indicate that there was no significant difference (0.01 < p < 0.99). The values to the right side of this matrix are the resultant p values when the Wilcoxon test is applied to the full dataset of all 503 unanimously agreed GO terms

References

    1. Brivanlou AH, Darnell JE., Jr Signal transduction and the control of gene expression. Science. 2002;295(5556):813–818. doi: 10.1126/science.1066355. - DOI - PubMed
    1. Nilsson R, Schultz IJ, Pierce EL, Soltis KA, Naranuntarat A, Ward DM, et al. Discovery of genes essential for heme biosynthesis through large-scale gene expression analysis. Cell Metab. 2009;10(2):119–130. doi: 10.1016/j.cmet.2009.06.012. - DOI - PMC - PubMed
    1. Pierson E, the GTEx Consortium. Koller D, Battle A, Mostafavi S. Sharing and specificity of co-expression networks across 35 human tissues. PLoS Comput Biol. 2015;11(5):e1004220. doi: 10.1371/journal.pcbi.1004220. - DOI - PMC - PubMed
    1. Pirim H, Ekşioğlu B, Perkins AD, Yüceer Ç. Clustering of high throughput gene expression data. Comput Oper Res. 2012;39(12):3046–3061. doi: 10.1016/j.cor.2012.03.008. - DOI - PMC - PubMed
    1. Kerr G, Ruskin HJ, Crane M, Doolan P. Techniques for clustering gene expression data, Computers in Biology and Medicine. Comput Biol Med. 2008;38(3):283–293. doi: 10.1016/j.compbiomed.2007.11.001. - DOI - PubMed

Publication types

LinkOut - more resources