. 2018 Oct;24(10):1453-1469.
doi: 10.1002/lt.25291.

Development of Clinical Criteria for Functional Assessment to Predict Primary Nonfunction of High-Risk Livers Using Normothermic Machine Perfusion

Affiliations

Development of Clinical Criteria for Functional Assessment to Predict Primary Nonfunction of High-Risk Livers Using Normothermic Machine Perfusion

Hynek Mergental et al. Liver Transpl. 2018 Oct.

Abstract

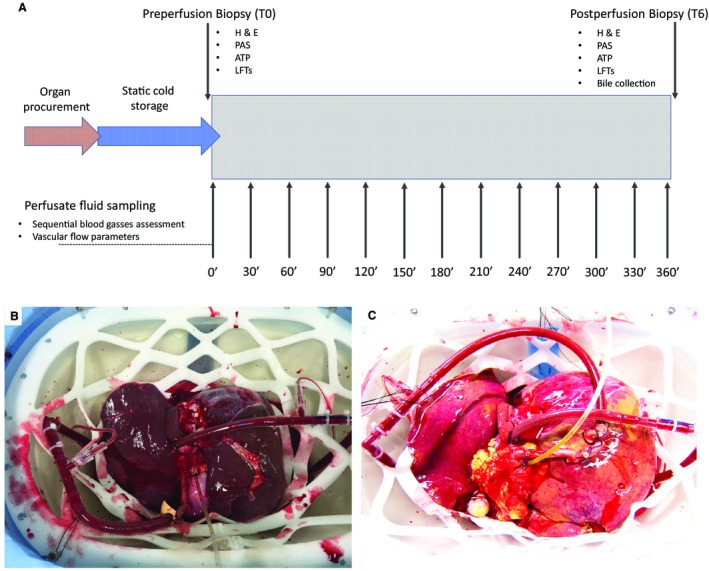
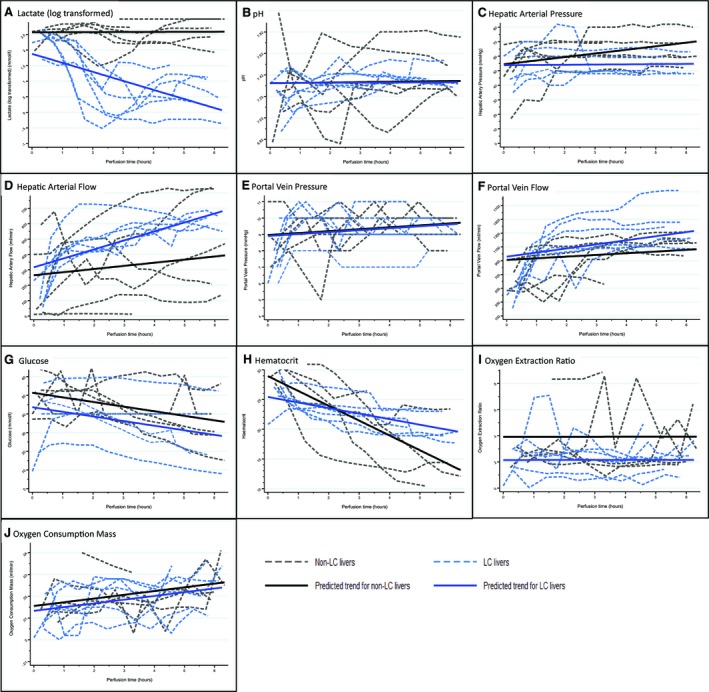
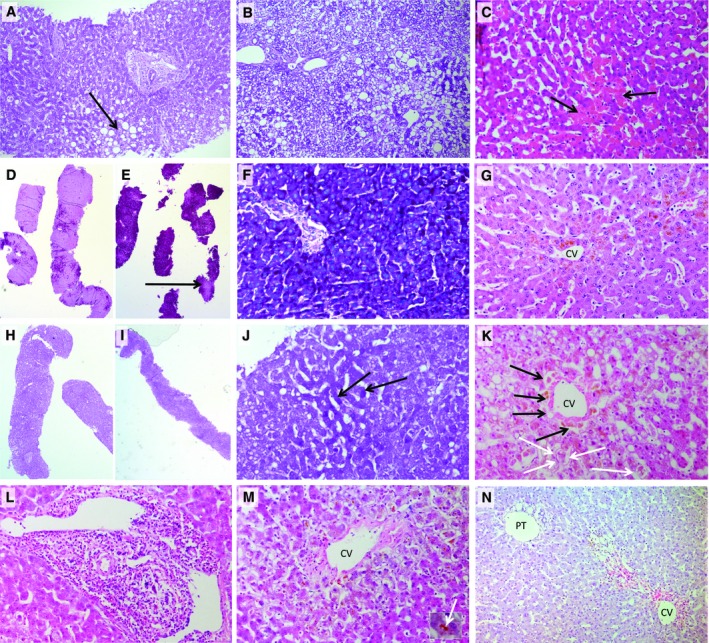
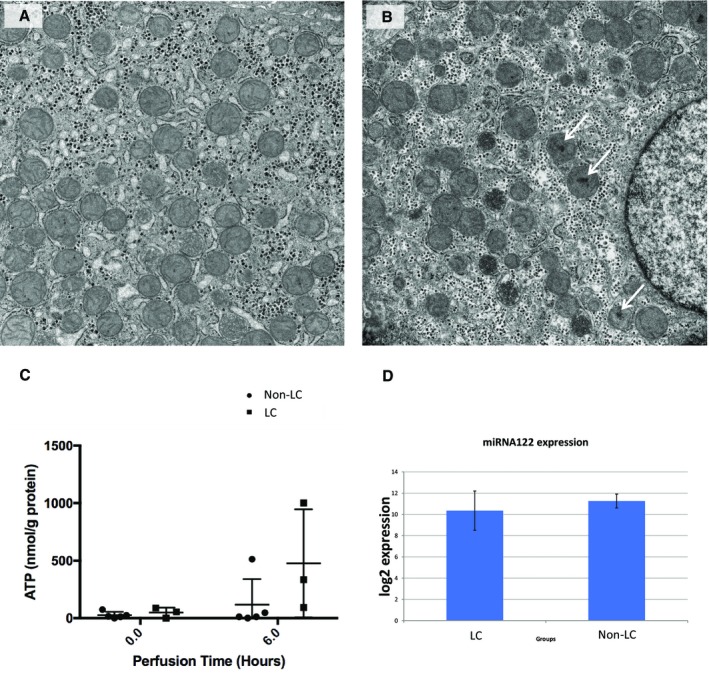
Increased use of high-risk allografts is critical to meet the demand for liver transplantation. We aimed to identify criteria predicting viability of organs, currently declined for clinical transplantation, using functional assessment during normothermic machine perfusion (NMP). Twelve discarded human livers were subjected to NMP following static cold storage. Livers were perfused with a packed red cell-based fluid at 37°C for 6 hours. Multilevel statistical models for repeated measures were employed to investigate the trend of perfusate blood gas profiles and vascular flow characteristics over time and the effect of lactate-clearing (LC) and non-lactate-clearing (non-LC) ability of the livers. The relationship of lactate clearance capability with bile production and histological and molecular findings were also examined. After 2 hours of perfusion, median lactate concentrations were 3.0 and 14.6 mmol/L in the LC and non-LC groups, respectively. LC livers produced more bile and maintained a stable perfusate pH and vascular flow >150 and 500 mL/minute through the hepatic artery and portal vein, respectively. Histology revealed discrepancies between subjectively discarded livers compared with objective findings. There were minimal morphological changes in the LC group, whereas non-LC livers often showed hepatocellular injury and reduced glycogen deposition. Adenosine triphosphate levels in the LC group increased compared with the non-LC livers. We propose composite viability criteria consisting of lactate clearance, pH maintenance, bile production, vascular flow patterns, and liver macroscopic appearance. These have been tested successfully in clinical transplantation. In conclusion, NMP allows an objective assessment of liver function that may reduce the risk and permit use of currently unused high-risk livers.


Figures

Figure 1
Figure 1
Study design and macroscopic appearance of a viable and nonviable liver. (A) The details of the study design and the perfusate fluid and biopsy sampling protocol. (B) A well‐perfused liver with optimal macroscopic appearance. The organ was rejected for transplantation due to the incidental discovery of a malignant melanoma. The liver began to function shortly after commencing the perfusion, and the vascular flows and blood gas profile patterns were used to help define criteria for liver graft viability (perfusion number 8). (C) A steatotic liver with suboptimal macroscopic appearance; this organ did not meet the viability criteria (perfusion number 2).
Figure 2
Figure 2
Multilevel random intercept and slope model findings. (A‐H) Graphs illustating each liver response trajectory over time (dashed lines) with corresponding average trajectory predicted from the multilevel model (solid lines) for LC and non‐LC livers. (A) Log‐transformed lactate levels (mmol/L): a significant difference in trend over time (P < 0.001) was observed, with LC livers being lower in comparison to non‐LC livers. (B) The pH: on average, LC livers appear to have a gentler increasing trend compared with non‐LC livers (P = 0.10), after adjustment for bicarbonate, carbon dioxide, and excess base. (C) Hepatic arterial pressure (mm Hg): the trends were different with a much steeper increasing trend in the non‐LC livers (P = 0.08), after adjusting for pressure and resistance. (D) Hepatic artery flow (mL/minute): there appears to be a difference in trends between LC and non‐LC groups (P = 0.13) after adjusting for hepatic arterial pressure, hepatic arterial resistance, and their interactions. (E) Portal vein pressure: an increasing trend over time (P = 0.07) was observed, but there was no difference between LC and non‐LC livers. (F) Portal vein flow (mL/minute): portal flow increased over time (P = 0.13), with LC livers having a slightly higher increment in flow (P = 0.12), after adjusting for pressure and resistance. (G) Glucose levels (mmol/L): glucose levels decreased significantly over time (P = 0.006) and LC livers appear to have lower levels compared with non‐LC livers. (H) Hematocrit: hematocrit demonstrated a significant reduction over time (P < 0.001) with LC livers showing a gentler decreasing trend (P = 0.01). (I) Oxygen extraction ratio: the levels were found not to change significantly over time, but on average, LC livers were 0.2 units lower than non‐LC livers (P = 0.07). (J) Oxygen consumption (mL/minute/g): a significant increase in oxygen consumption mass over time was observed (P < 0.001); however, there appears to be no difference between LC and non‐LC livers.
Figure 3
Figure 3
Histological findings. (A) A PAS‐stained section of a non‐LC liver, 4 of which had the most severe large‐droplet macrovesicular steatosis (arrow), the type of fat considered in evaluating suitability for transplantation. This was mild involving up to 15% of hepatocytes. The liver was turned down on macroscopic assessment of steatosis (original objective ×10). (B) A PAS‐stained section of liver 1 before NMP with extensive small‐droplet microvesicular steatosis, where hepatocyte cytoplasm contains often numerous small droplets of fat that do not displace the hepatocyte nuclei. Several large fat droplets are also present. This liver was turned down due to the macroscopic appearance of steatosis; large‐droplet steatosis was mild involving only 5% of hepatocytes in the whole biopsy. It is likely that the small‐droplet steatosis was also seen macroscopically. This is not traditionally considered in assessing a liver for transplantation and indicates the requirement of a liver biopsy to accurately assess the type and amount of both types of fat droplets (original objective ×10). (C) A H & E–stained section of LC liver 1 at 6 hours after NMP, showing a small area of coagulative necrosis where the cells become hypereosinophilic (arrows). This was seen to an equal extent in both viable and nonviable livers before and after NMP and was very mild in this series of livers. (D‐F) PAS stain from LC liver 1. (H‐J) Non‐LC liver 4. (D and H) Both livers demonstrated marked glycogen depletion pre‐NMP; although after NMP (E and F), the viable liver has restored its glycogen stores. (I and J) The nonviable liver remains significantly glycogen depleted. Bright magenta staining of the cytoplasm indicates glycogen, and pale pink staining indicates no glycogen (arrow; E). (J) The few darker staining hepatocytes containing some glycogen are indicated (D, E, H, I, original objective ×2; F, J, original objective ×20). (G) A LC liver 3 after 6 hours of NMP, revealing normal hepatocyte plate morphology and attachment of hepatocyte plates to the CV. (K) Non‐LC liver number 3 showing loss of cohesion of hepatocytes from each other and from the sinusoidal lining (arrows) and the CV 6 hours after NMP. (L and M) H & E–stained sections of non‐LC liver 5, which was turned down for transplantation based on its macroscopic appearance. This liver had (L) portal hepatitis and (M) severe zone 3 cholestasis (inset—high power of bile plug, arrow; original objective ×20 for both). (N) H & E–stained section of LC liver 2 discarded because macroscopically thought to have fibrosis. There is no fibrosis present. There is a normal portal triad (PT) showing no fibrous expansion. The abnormality present is centered around the CV consisting of confluent areas of hepatocyte loss in which there is variable hemorrhage/congestion (red color of red blood cells seen) and pigment laden macrophages (original objective ×10).
Figure 4
Figure 4
Transmission electron micrographs and ATP and miRNA analyses. (A) shows a LC, viable liver number 4, and (B) a non‐LC liver number 6. Both microphotographs were taken from postperfusion (T6) biopsy samples. In the nonviable liver, flocculent densities can be seen within several of the mitochondria (white arrows), which indicate irreversible cell injury. Christae are still apparent within other mitochondria and within the viable liver (A) in which no flocculent densities were observed. The mitochondria of both livers are not swollen (original magnification ×13,000). (C) Preperfusion and postperfusion ATP levels, showing increase in the LC livers contrasting with minimal change observed in non‐LC livers. (D) MiRNA assays to assess the extent of cellular damage. This analysis did not reveal any difference between LC and non‐LC groups.

Comment in

References

    1. Williams R, Ashton K, Aspinall R, Bellis MA, Bosanquet J, Cramp ME, et al. Implementation of the Lancet Standing Commission on Liver Disease in the UK. Lancet 2015;386:2098‐2111. - PubMed
    1. National Health Service Blood and Transplant . Organ Donation and Transplantation: Activity Report 2016/17. www.odt.nhs.uk. Accessed October 13, 2017.
    1. Walker KG, Eastmond CJ, Best PV, Matthews K. Eosinophilia‐myalgia syndrome associated with prescribed L‐tryptophan. Lancet 1990;336:695‐696. - PubMed
    1. Ploeg RJ, D'Alessandro AM, Knechtle SJ, Stegall MD, Pirsch JD, Hoffmann RM, et al. Risk factors for primary dysfunction after liver transplantation–a multivariate analysis. Transplantation 1993;55:807‐813. - PubMed
    1. Leithead JA, Tariciotti L, Gunson B, Holt A, Isaac J, Mirza DF, et al. Donation after cardiac death liver transplant recipients have an increased frequency of acute kidney injury. Am J Transplant 2012;12:965‐975. - PubMed

Publication types

MeSH terms