Review
. 2018 Oct 25;22(1):263.
doi: 10.1186/s13054-018-2195-6.

Electrical impedance tomography in acute respiratory distress syndrome

Affiliations
Review

Electrical impedance tomography in acute respiratory distress syndrome

M Consuelo Bachmann et al. Crit Care. .

Abstract

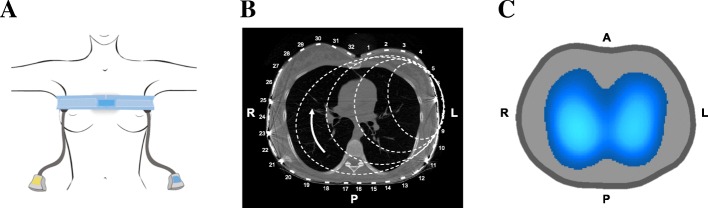
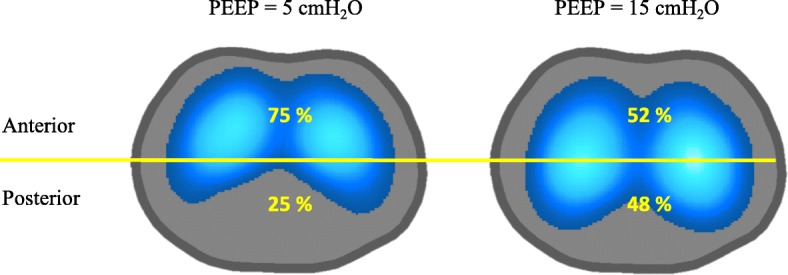
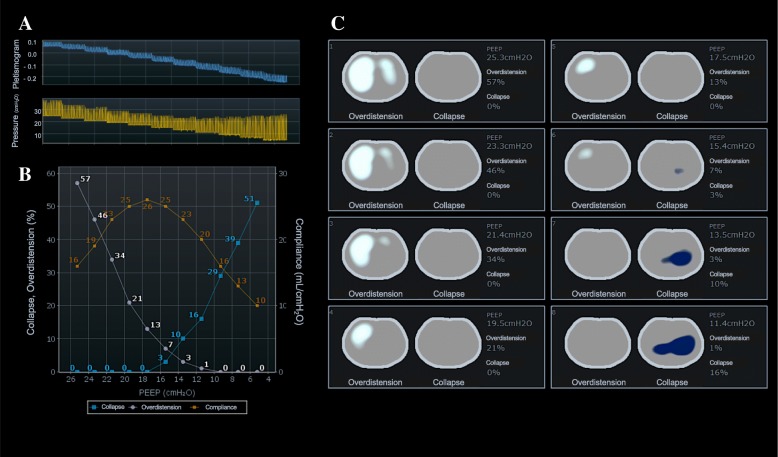
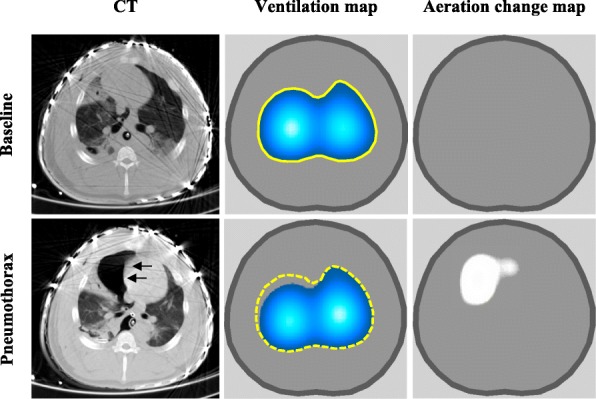
Acute respiratory distress syndrome (ARDS) is a clinical entity that acutely affects the lung parenchyma, and is characterized by diffuse alveolar damage and increased pulmonary vascular permeability. Currently, computed tomography (CT) is commonly used for classifying and prognosticating ARDS. However, performing this examination in critically ill patients is complex, due to the need to transfer these patients to the CT room. Fortunately, new technologies have been developed that allow the monitoring of patients at the bedside. Electrical impedance tomography (EIT) is a monitoring tool that allows one to evaluate at the bedside the distribution of pulmonary ventilation continuously, in real time, and which has proven to be useful in optimizing mechanical ventilation parameters in critically ill patients. Several clinical applications of EIT have been developed during the last years and the technique has been generating increasing interest among researchers. However, among clinicians, there is still a lack of knowledge regarding the technical principles of EIT and potential applications in ARDS patients. The aim of this review is to present the characteristics, technical concepts, and clinical applications of EIT, which may allow better monitoring of lung function during ARDS.

Keywords: Acute respiratory distress syndrome; Electrical impedance tomography; Lung imaging; Mechanical ventilation; Ventilation distribution.


Conflict of interest statement

Ethics approval and consent to participate

Not applicable.

Consent for publication

Informed consent was obtained from the patient.

Competing interests

EC, CM, and JBB report personal fees from Timpel S.A. during the conduct of the study. The remaining authors declare that they have no competing interests.

Publisher’s Note

Springer Nature remains neutral with regard to jurisdictional claims in published maps and institutional affiliations.

Figures

Fig. 1
Fig. 1
a Placement of electrode belt on chest. It is recommended to apply electrode belt between fifth and sixth intercostal space. b Computed tomographic axial slice of thorax with 32-electrode belt, and schematic representation of electrical current pathways through thorax. One pair of electrodes injects electrical current while remaining electrodes read voltages produced as a result of the distribution of current density inside thorax. Injection pair is alternated sequentially, and after a full cycle one image will be generated. c Functional image reconstructed by electrical impedance tomography (EIT) using a color scale: the lighter the blue, the greater the regional ventilation. Of note, this color scale is not universal. Image generated by EIT Enlight (TIMPEL SA, São Paulo). A anterior, L left, P posterior, R right
Fig. 2
Fig. 2
a Heterogeneous inflation. Ventral regions inflate first and dorsal regions start inflating halfway to end of inspiration. b Homogeneous inflation. Both ventral and dorsal regions start inflating simultaneously. AU arbitrary units
Fig. 3
Fig. 3
Global (whole image) plethysmogram and airway pressure (PAW) waveforms. (I) Increment in positive end-expiratory pressure (PEEP) increased end-expiratory lung volume (ΔEELZ). (II) Ventilatory cyclical variation (ΔZ) tracks changes in tidal volume (VT). AU arbitrary units
Fig. 4
Fig. 4
Computed tomography (CT) of a patient with pneumonia and corresponding functional image obtained from electrical impedance tomography (EIT). Note absence of ventilation on lower right lung in EIT image and corresponding massive consolidation on right lung assessed by CT
Fig. 5
Fig. 5
Ventilation map divided into two regions of interest in a model of acute respiratory distress syndrome, ventilated with positive end-expiratory pressure (PEEP) of 5 cmH2O (left) and 15 cmH2O (right)
Fig. 6
Fig. 6
Estimation of recruitable lung collapse and overdistension during decremental positive end-expiratory pressure (PEEP) maneuver. a Reduction of end-expiratory lung impedance (blue waves) in each PEEP step (yellow waves). b Respiratory system compliance, collapse, and overdistension at each stage of decremental PEEP maneuver. Note that PEEP of better global compliance (17 cmH2O) does not coincide with PEEP that minimizes collapse and overdistension estimated according to electrical impedance tomography (15 cmH2O). c Maps of overdistension and collapse in each PEEP step. Observe progressive increase of lung collapse with reduction of PEEP, predominantly in dependent region. Images generated by Enlight (Timpel SA, São Paulo, Brazil)
Fig. 7
Fig. 7
Computed tomography (CT), ventilation map, and aeration change map obtained at baseline and after induction of pneumothorax in a pig. Arrows point to accumulation of air in pleural space
Fig. 8
Fig. 8
Global electrical impedance tomography (EIT) plethysmogram and ventilation map during open suction (OS) in model of severe ARDS. Solid and dotted horizontal lines represent end-expiratory lung impedance (EELZ) at baseline and post OS, respectively. Note that EELZ does not return to baseline values (arrows indicating distance between solid and dotted lines), describing reduction of aerated lung. Also note reduction of pulmonary ventilation after OS (ΔZ I – ΔZ II). Ventilation maps I and II (left and right images at top) show decrease of ventilation on posterior region after OS. A anterior (ventral), AU arbitrary units, P posterior (dorsal). Courtesy of Nadja Carvalho
Fig. 9
Fig. 9
Airway pressure (PAW), flow, tidal volume (VT), and EIT waveforms during synchronous cycle (A) and during breath stacking dyssynchrony (B). During breath stacking, plethysmogram shows inspired volume near twice that of a regular cycle. This excessive deformation of lung not detected by currently available waveforms on mechanical ventilators. AU arbitrary units, ∆Z variation of impedance
Fig. 10
Fig. 10
Pendelluft phenomenon. Variation of impedance (∆Z) and airway pressure in assisted and controlled mechanical ventilation (PAW). Blue line: posterior region of lung. Red line: Anterior region of lung. In assisted mechanical ventilation, anterior region of lung decreases its impedance variation (loses air) and at the same time posterior region increases (being aerated). AU arbitrary units, EIT electrical impedance tomography
Fig. 11
Fig. 11
Electrical impedance tomography (EIT) ventilation and perfusion images of patient with community-acquired pneumonia affecting left lower lobe. Color scale adjusted by linear normalization. a Ventilation reduction at lower left quadrant in comparison with lower right quadrant, without changes in perfusion distribution at the lower quadrants. b Ventilation and perfusion decoupling in left lower quadrant represented by low distribution ratio. LL lower left, LR lower right, UL upper left, UR upper right, ZV ventilation estimated by EIT, ZQ perfusion estimated by EIT. Image provided by Fernando Suarez-Sipmann. Red arrow indicates ventilation/perfusion ratio in the LL quadrant
Fig. 12
Fig. 12
Regional ventilation delay (RVD). Ventral region. Patient in mechanical ventilation. Slice 1, ventral region; Slice 2, central ventral; Slice 3, central dorsal; Slice 4, dorsal region. A anterior, AU arbitrary units, C central, P posterior, ROI region of interest, ∆Z variation of impedance. Courtesy of Wildberg Alencar

References

    1. Sweeney Rob Mac, McAuley Daniel F. Acute respiratory distress syndrome. The Lancet. 2016;388(10058):2416–2430. doi: 10.1016/S0140-6736(16)00578-X. - DOI - PMC - PubMed
    1. Bellani G, Laffey JG, Pham T, Fan E, Brochard L, Esteban A, et al. Epidemiology, patterns of care, and mortality for patients with acute respiratory distress syndrome in intensive care units in 50 countries. JAMA. 2016;315:788. doi: 10.1001/jama.2016.0291. - DOI - PubMed
    1. Herridge Margaret S., Cheung Angela M., Tansey Catherine M., Matte-Martyn Andrea, Diaz-Granados Natalia, Al-Saidi Fatma, Cooper Andrew B., Guest Cameron B., Mazer C. David, Mehta Sangeeta, Stewart Thomas E., Barr Aiala, Cook Deborah, Slutsky Arthur S. One-Year Outcomes in Survivors of the Acute Respiratory Distress Syndrome. New England Journal of Medicine. 2003;348(8):683–693. doi: 10.1056/NEJMoa022450. - DOI - PubMed
    1. Ware Lorraine B., Matthay Michael A. The Acute Respiratory Distress Syndrome. New England Journal of Medicine. 2000;342(18):1334–1349. doi: 10.1056/NEJM200005043421806. - DOI - PubMed
    1. Pelosi P, Dandrea L, Vitale G, Pesenti a, Gattinoni L. Vertical gradient of regional lung inflation in adult respiratory distress syndrome. Am J Respir Crit Care Med. 1994;149:8–13. doi: 10.1164/ajrccm.149.1.8111603. - DOI - PubMed

Publication types

MeSH terms