. 2018 Nov;30(11):2813-2837.
doi: 10.1105/tpc.18.00441. Epub 2018 Oct 25.

The Receptor-like Pseudokinase GHR1 Is Required for Stomatal Closure

Affiliations

The Receptor-like Pseudokinase GHR1 Is Required for Stomatal Closure

Maija Sierla et al. Plant Cell. 2018 Nov.

Abstract

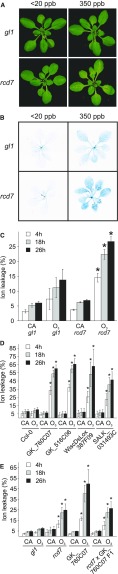
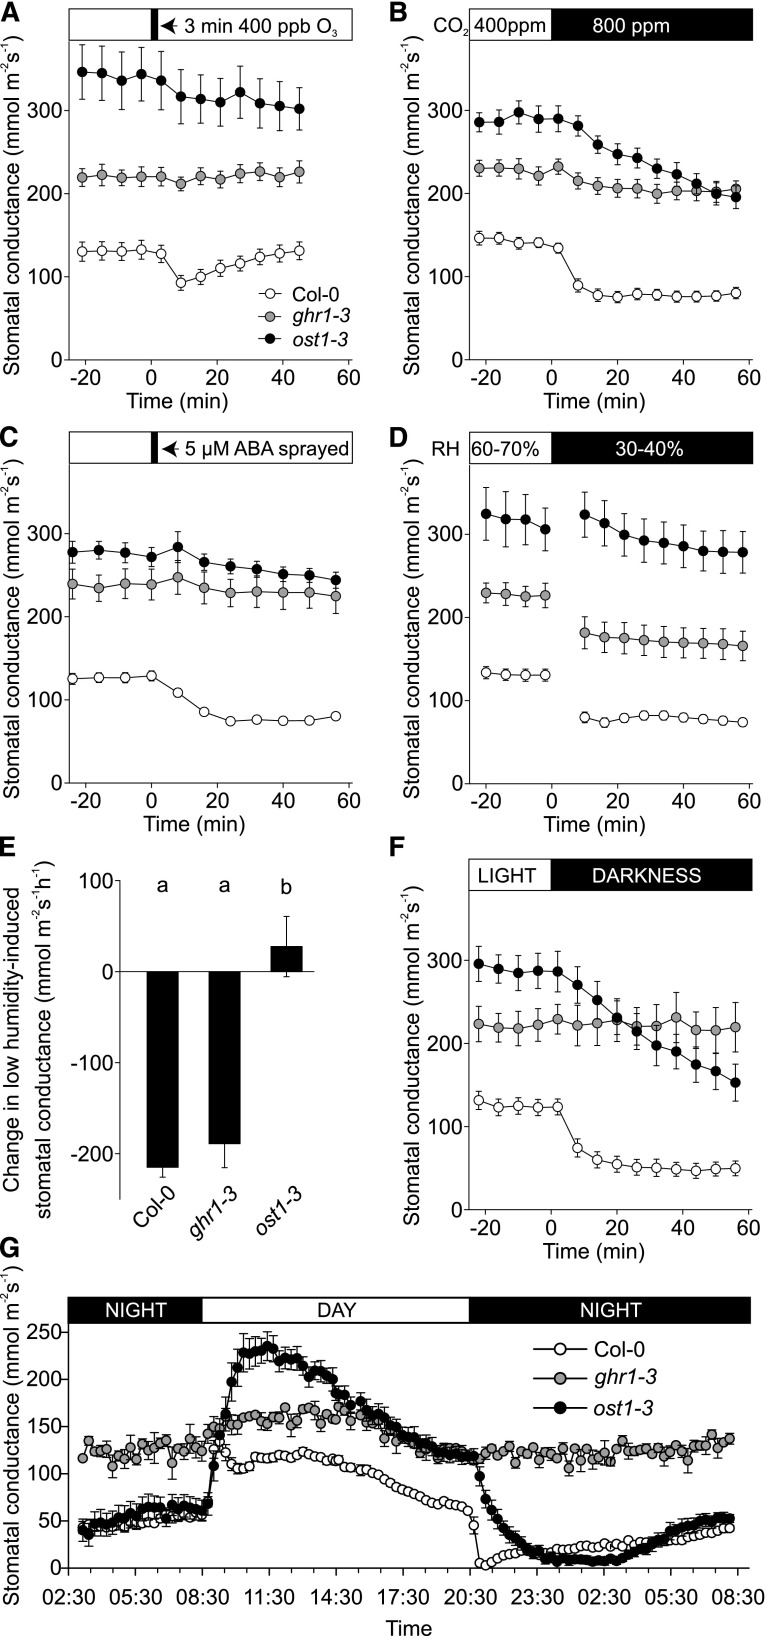
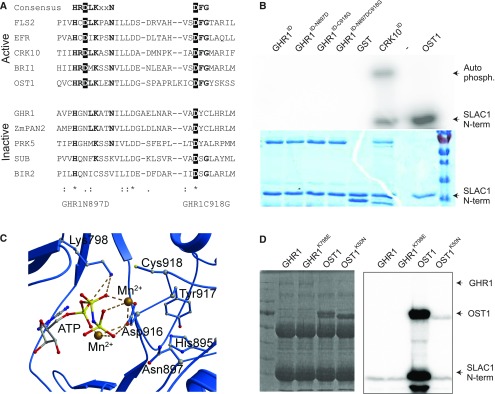
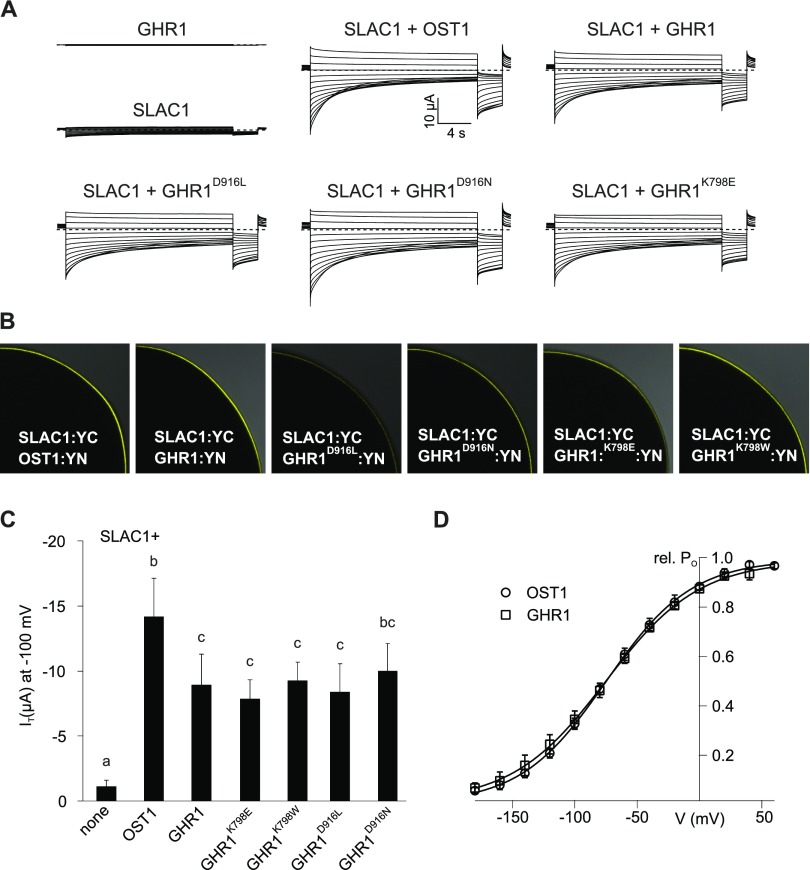
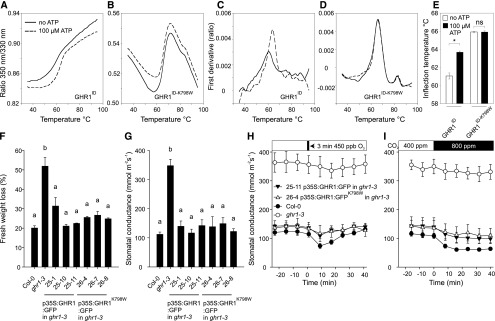
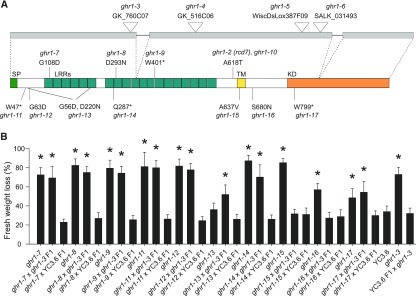
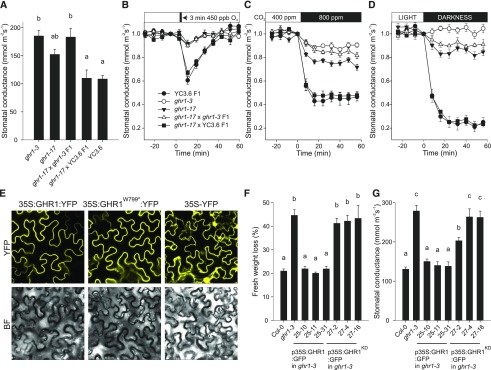
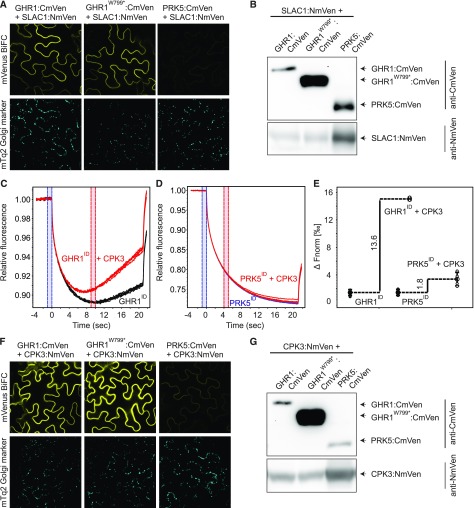
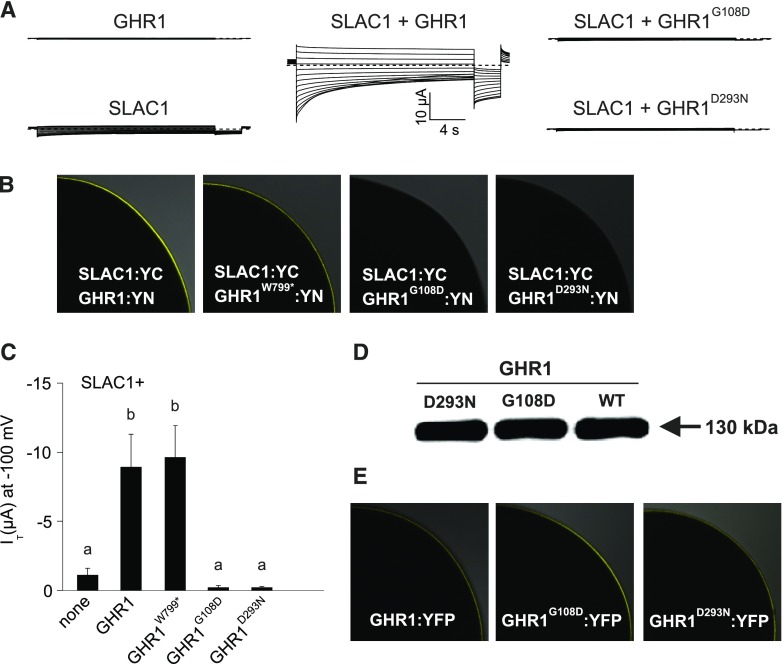
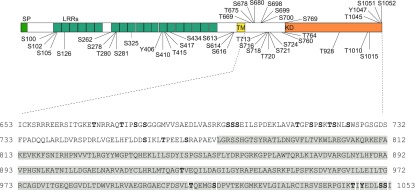
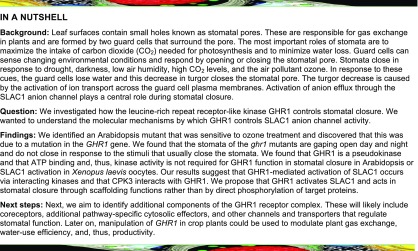
Guard cells control the aperture of stomatal pores to balance photosynthetic carbon dioxide uptake with evaporative water loss. Stomatal closure is triggered by several stimuli that initiate complex signaling networks to govern the activity of ion channels. Activation of SLOW ANION CHANNEL1 (SLAC1) is central to the process of stomatal closure and requires the leucine-rich repeat receptor-like kinase (LRR-RLK) GUARD CELL HYDROGEN PEROXIDE-RESISTANT1 (GHR1), among other signaling components. Here, based on functional analysis of nine Arabidopsis thaliana ghr1 mutant alleles identified in two independent forward-genetic ozone-sensitivity screens, we found that GHR1 is required for stomatal responses to apoplastic reactive oxygen species, abscisic acid, high CO2 concentrations, and diurnal light/dark transitions. Furthermore, we show that the amino acid residues of GHR1 involved in ATP binding are not required for stomatal closure in Arabidopsis or the activation of SLAC1 anion currents in Xenopus laevis oocytes and present supporting in silico and in vitro evidence suggesting that GHR1 is an inactive pseudokinase. Biochemical analyses suggested that GHR1-mediated activation of SLAC1 occurs via interacting proteins and that CALCIUM-DEPENDENT PROTEIN KINASE3 interacts with GHR1. We propose that GHR1 acts in stomatal closure as a scaffolding component.


Figures

Figure 1.
Figure 1.
Phenotypes of the rcd7 Mutant and Candidate Insertion Mutants and Allelism Tests. (A) Representative photographs of 3-week-old O3-treated (350 ppb) and clean air (CA) control (<20 ppb) Col-0 gl1 and rcd7 plants taken 18 h after the end of a 6 h exposure to O3. (B) Trypan blue staining for dead and dying cells performed 18 h after the end of O3 exposure. (C) to (E) Electrolyte leakage measured 4, 18, and 26 h after the end of O3 exposure. Values are plotted as % of total ion content. At least three independent experiments consisting of four plants per line for each treatment were performed with similar results. Data from a representative experiment is shown. Data are presented as mean ± sd (n = 4 plants). Asterisks indicate statistically significant differences to O3-treated Col-0 gl1 (C and E) or Col-0 (D) (ANOVA with Tukey’s honestly significant difference [HSD] test, P < 0.05).
Figure 2.
Figure 2.
Characterization of ghr1 Stomatal Phenotypes. Time course of stomatal conductance of Col-0, ghr1-3, and ost1-3 plants in response to (A) O3 pulse, (B) elevated CO2, (C) ABA spray, (D) reduced air humidity, and (F) darkness. Stomatal conductance of 3- to 4-week-old plants was recorded; the indicated treatments were applied at time point zero. Data points represent means ± sem of at least three experiments (n = 8-21 plants). (E) Change in stomatal conductance 16 min after decrease in relative air humidity, calculated based on the data presented in (D). Significant differences (ANOVA with unequal N HSD as post hoc, P < 0.01) between groups are denoted with different letters. (G) Diurnal cycle in stomatal conductance of Col-0, ghr1-3 and ost1-3 plants. Stomatal conductance was recorded for two consecutive days, and diurnal stomatal conductance patterns for the second day are shown. Data points represent mean ± sem (n = 3–8 plants).
Figure 3.
Figure 3.
GHR1 Kinase Domain and Activity. (A) Alignment of subdomains VIb and VII of the catalytic core of the kinase domains of active and inactive RLKs and OST1. Residues highlighted in black are considered indispensable for kinase activity. Bold residues are highly conserved in active kinases. (B) Phosphorylation activity assays of GHR1 intracellular domain (GHR1ID) and the indicated mutant proteins in in vitro kinase assays using γ32P-ATP and SLAC1 N-terminal (N-term) fragment (residues 1–186) as a substrate. GST-CRK10ID and 6xHIS-OST1 were used as positive controls. Protein amount used for the assay was 2 µg apart from 6xHis-OST1, for which 0.04 µg was used. Autoradiograph and Coomassie Brilliant Blue G 250 staining are shown. (C) Structural prediction of the catalytic core of the intracellular kinase domain of GHR1. Predicted interactions of Lys798 and Asp916 of GHR1 with ATP and Mn2+ ions are shown. (D) Phosphorylation activity assays of full-length GHR1-TAP, OST1-TAP and ATP binding site mutants GHR1K798E-TAP and OST1K50N-TAP immunoprecipitated from yeast cell extract toward SLAC1 N-terminal fragment. Coomassie Brilliant Blue G 250 staining and autoradiograph are shown.
Figure 4.
Figure 4.
Activation of SLAC1 Anion Currents by GHR1 Variants That Contain Mutations in Residues Essential for ATP Binding in Xenopus laevis Oocytes. (A) Representative whole oocyte current traces from cells expressing GHR1 or SLAC1 alone or SLAC1 together with OST1, wild-type GHR1 or GHR1D916L, GHR1D916N and GHR1K798E. (B) BiFC analysis following co-expression of SLAC1:YC with OST1:YN, GHR1:YN or GHR1D916L:YN, GHR1D916N:YN, GHR1K798E:YN and GHR1K798W:YN in oocytes. One-quarter of a representative oocyte is shown. (C) Instantaneous currents (IT) recorded at -100 mV in standard buffer of oocytes expressing SLAC1 or GHR1 WT alone or co-expressing SLAC1 with OST1, GHR1 WT or one of the GHR1 mutants GHR1D916L, GHR1D916N, GHR1K798E, or GHR1K798W:YN. Four biological repeats, each performed with oocytes from different batches, were performed. Data of a representative experiment are shown. All data points are mean ± sd (n ≥ 4 oocytes). Significant differences (ANOVA with Tukey’s HSD test, P < 0.05) between groups are denoted with different letters. (D) Relative voltage-dependent open probability (rel. PO) of oocytes co-expressing SLAC1 with either OST1 or GHR1. Oocytes were perfused with buffers containing 30 mM nitrate. Data points were fitted with a Boltzmann equation (continuous line). All data points are mean ± sd (n = 4 oocytes). Data presented in Figure 4 and Figure 9 derive from the same series of experiments. The control data presented for GHR1:YN and SLAC1:YC (expressed alone or co-expressed) are the same between the figures.
Figure 5.
Figure 5.
Analysis of ATP Binding of GHR1ID and GHR1ID-K798W and Characterization of Stomatal Phenotypes in Independent Transgenic Lines Expressing 35S:GHR1:GFP or 35S:GHR1K798W:GFP in ghr1-3. (A) and (B) Ratio of 350 nm/330 nm, which represents an unfolding transition of the proteins due to thermal treatment in the absence (solid lines) or presence (dashed lines) of ATP. (C) and (D) The first derivative of the data presented in (A) and (B) showing a shift in inflection temperature upon ATP binding in the case of GHR1 intracellular domain (GHR1ID) (C), whereas in the case of GHR1ID-K798W, inflection temperatures are the same (D). All experiments were repeated 6 times; representative curves are shown. (E) Inflection temperatures for GHR1ID and GHR1ID-K798W in the absence or presence of ATP. The bars represent average value and standard deviations (n = 6). Asterisk denotes statistically significant difference between treatments (independent-samples t test, P < 0.05). (F) Leaf fresh weight loss in 2 h and (G) stomatal conductance of intact plants. Data are presented as mean ± sem (n = 3-5 plants). Significant differences (ANOVA with Tukey’s HSD test, P < 0.05) between lines are denoted with different letters. (H) and (I) Time course of stomatal conductance in response to (H) O3 pulse and (I) elevated CO2 in representative transgenic lines. Stomatal conductance of 3- to 4-week-old plants was recorded; the indicated treatments were applied at time point zero. Data points represent means ± sem (n = 3–5 plants).
Figure 6.
Figure 6.
Additional ghr1 Alleles. (A) Structure of the GHR1 protein (bottom) and its encoding gene (top). Position of T-DNA insertions, EMS point mutations, and predicted functional domains of the protein are depicted. Gray boxes, exons; SP, signal peptide; LRR, leucine-rich repeat; TM, transmembrane domain; KD, kinase domain. (B) Leaf fresh weight loss in 2 h in the indicated ghr1 mutants and the F1 progenies from their respective crosses to ghr1-3 (GK_760C07) and Col-0 with GC1:YC3.6. Four independent experiments consisting of at least ten plants for each line were performed. Data from a representative experiment is shown. All data points are mean ± sd (n = 11–16 plants). Significant differences (ANOVA with Tukey’s HSD test, P < 0.01) from YC3.6 are denoted with asterisks.
Figure 7.
Figure 7.
Functional Domains of GHR1. (A) to (D) Characterization of stomatal phenotypes of ghr1-17 and the F1 progeny from its cross to ghr1-3 (GK_760C07) and Col-0 with GC1:YC3.6. (A) Stomatal conductance of intact plants. Data are presented as mean ± sem (n = 5–7 plants) and derive from two independent batches of plants. Significant differences (ANOVA with Tukey’s HSD test, P < 0.05) between lines are denoted with different letters. (B) to (D) Stomatal response of intact plants to (B) O3 pulse, (C) elevated CO2, (D) darkness. Stomatal conductance (expressed in relative units) of 3- to 4-week-old plants was recorded; at time point zero, the indicated treatments were applied. Data points represent means ± sem (n = 5–7 plants). (E) Subcellular localization of 35S:GHR1:YFP, 35S:GHR1W799*:YFP and 35S:YFP fusion proteins in Nicotiana benthamiana epidermal cells. Representative images for each construct taken with identical confocal microscopy acquisition settings are shown. (F) Leaf fresh weight loss in 2 h and (G) stomatal conductance of intact plants in independent transgenic lines expressing 35S:GHR1:GFP or 35S:GHR1KD:GFP in ghr1-3. Data are pooled from two independent experiments and are presented as mean ± sem (n = 6–10 plants in [F], n = 6-8 plants in [G]). Significant differences (ANOVA with Tukey’s HSD test, P < 0.05) between lines are denoted with different letters.
Figure 8.
Figure 8.
Interaction of GHR1 with SLAC1 and CPK3. (A) and (F) Bimolecular fluorescence complementation assays were performed with N. benthamiana leaves infiltrated with 35S:GHR1:CmVen, 35S:GHR1W799*:CmVen or 35S:PRK5:CmVen with 35S:SLAC1:NmVen or 35S:CPK3:NmVen. mVenus (top row) and mTq2 (bottom row) signals are shown. Expression of the mTq2 Golgi marker (bottom row) confirms that transformation of all constructs was successful. N. benthamiana leaf tissue was imaged 48 h after transformation. Identical settings were used for all constructs allowing direct comparison. All experiments were repeated at least three times, and representative BiFC images are shown. (B) and (G) Immunoblots showing expression of split-YFP fusion proteins in BiFC samples used for confocal imaging. (C), (D), and (E) Analysis of in vitro binding of GHR1ID and PRK5ID with CPK3. Interaction between intracellular domain of GHR1 (GHR1ID) and PRK5 (PRK5ID) fused to GST with CPK3 was monitored by microscale thermophoresis (MST). (C) MST traces of 66 nM fluorescently labeled GHR1ID in the absence (black) and presence (red) of 5 µM CPK3. (D) MST traces of 40 nM fluorescently labeled PRK5ID in the absence (blue) and presence (red) of 5 µM CPK3. (E) Difference in normalized fluorescence between GHR1ID or PRK5ID alone and in the presence of CPK3 as indicated. All experiments were performed four times.
Figure 9.
Figure 9.
Activation of SLAC1 Anion Currents by GHR1 Truncation and Ectodomain Mutants in Xenopus laevis Oocytes. (A) Representative whole oocyte current traces from cells expressing GHR1 or SLAC1 alone or SLAC1 together with wild-type GHR1 or GHR1G108D and GHR1D293N. (B) BiFC analysis following co-expression of SLAC1:YC with GHR1:YN or GHR1W799*:YN, GHR1G108D:YN and GHR1D293N:YN in oocytes. One-quarter of a representative oocyte is shown. (C) Instantaneous currents (IT) recorded at −100 mV in standard buffer of oocytes expressing SLAC1 alone or co-expressing SLAC1 with GHR1 WT or GHR1W799*:YN, GHR1G108D:YN and GHR1D293N:YN. Four biological repeats, each performed with oocytes from different batches, were performed. Data of a representative experiment is shown. All data points are mean ± sd (n ≥ 6 oocytes). Significant differences (ANOVA with Tukey’s HSD test, P < 0.05) between groups are denoted with different letters. (D) Immunoblot analysis of GHR1 WT:YN, GHR1G108D:YN and GHR1D293N:YN protein levels in oocytes. (E) Subcellular localization of GHR1 WT:YFP, GHR1G108D:YFP and GHR1D293N:YFP fusion proteins in oocytes. One-quarter of a representative oocyte is shown. Data presented in Figure 4 and Figure 9 derive from the same series of experiments. The control data presented for GHR1:YN and SLAC1:YC (expressed alone or co-expressed) are the same between the figures.
Figure 10.
Figure 10.
In Vitro Phosphorylation Sites of GST-GHR1 by 6xHis-HT1 Identified by Mass Spectrometry Purified recombinant GST-GHR1 was phosphorylated by 6xHis-HT1 in vitro and the phosphorylation sites were subsequently identified by mass spectrometry. The positions of all identified phosphorylation sites are depicted on the GHR1 protein structure (upper panel). Phosphorylation sites located on the intracellular juxtamembrane domain and pseudokinase domain (gray highlighting) are additionally marked (bold letters) on the GHR1 protein sequence (lower panel). SP, signal peptide; LRR, leucine-rich repeat; TM, transmembrane domain; KD, kinase domain. See Supplemental Data Set 2 for MaxQuant Phospho(STY)Sites table.
None

Comment in

References

    1. Bauer H., Ache P., Lautner S., Fromm J., Hartung W., Al-Rasheid K.A., Sonnewald S., Sonnewald U., Kneitz S., Lachmann N., Mendel R.R., Bittner F., et al. (2013). The stomatal response to reduced relative humidity requires guard cell-autonomous ABA synthesis. Curr. Biol. 23: 53–57. - PubMed
    1. Becker D., Dreyer I., Hoth S., Reid J.D., Busch H., Lehnen M., Palme K., Hedrich R. (1996). Changes in voltage activation, Cs+ sensitivity, and ion permeability in H5 mutants of the plant K+ channel KAT1. Proc. Natl. Acad. Sci. USA 93: 8123–8128. - PMC - PubMed
    1. Bent A. (2006). Arabidopsis thaliana floral dip transformation method. Methods Mol. Biol. 343: 87–103. - PubMed
    1. Blaum B.S., Mazzotta S., Nöldeke E.R., Halter T., Madlung J., Kemmerling B., Stehle T. (2014). Structure of the pseudokinase domain of BIR2, a regulator of BAK1-mediated immune signaling in Arabidopsis. J. Struct. Biol. 186: 112–121. - PubMed
    1. Bluhm W.F., Beran B., Bi C., Dimitropoulos D., Prlic A., Quinn G.B., Rose P.W., Shah C., Young J., Yukich B., Berman H.M., Bourne P.E. (2011). Quality assurance for the query and distribution systems of the RCSB Protein Data Bank. Database (Oxford) 2011: bar003. - PMC - PubMed

Publication types

MeSH terms