. 2018 Oct 26;362(6413):423-429.
doi: 10.1126/science.aat0481.

Dynamic salience processing in paraventricular thalamus gates associative learning

Affiliations

Dynamic salience processing in paraventricular thalamus gates associative learning

Yingjie Zhu et al. Science. .

Abstract

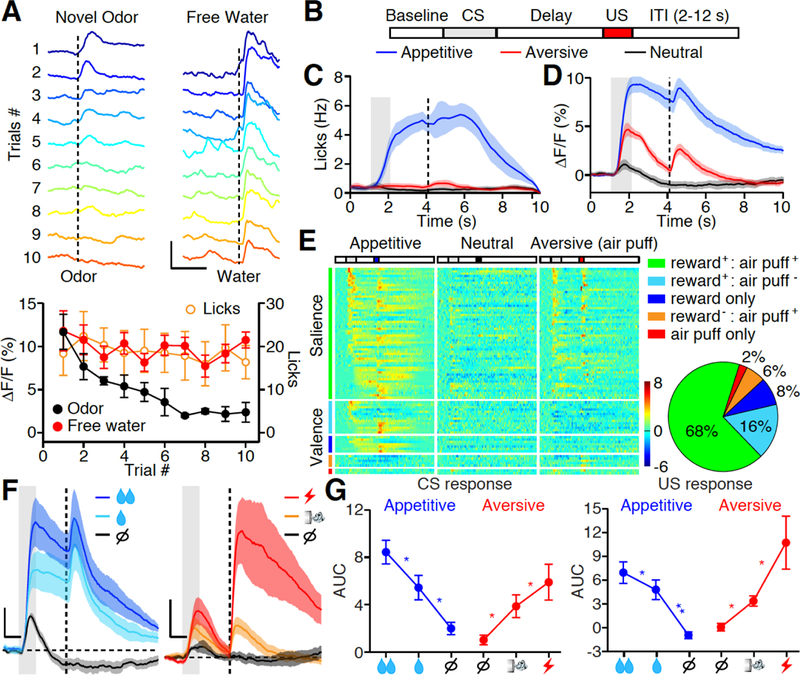
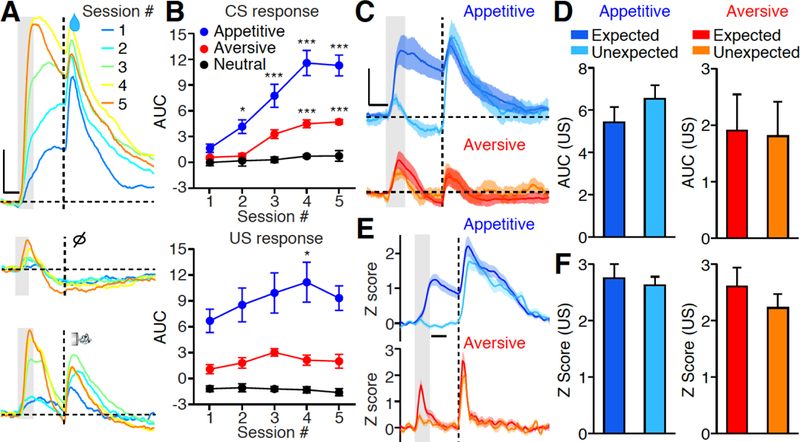
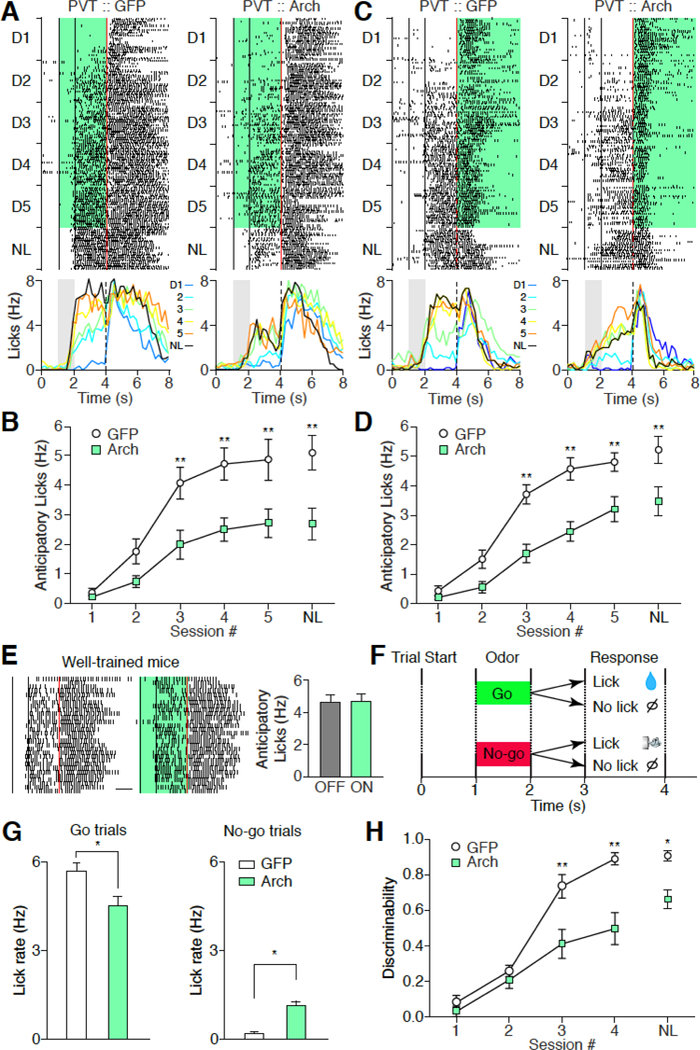
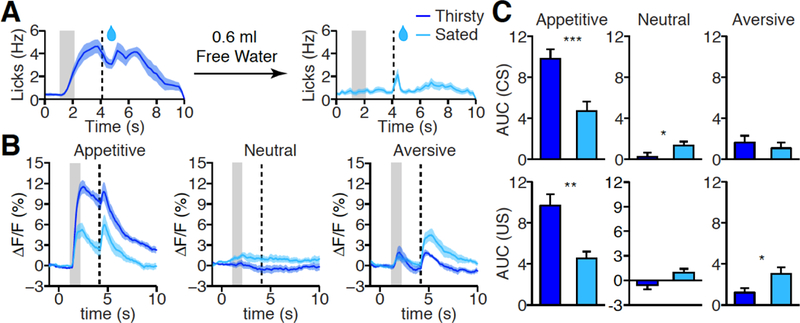
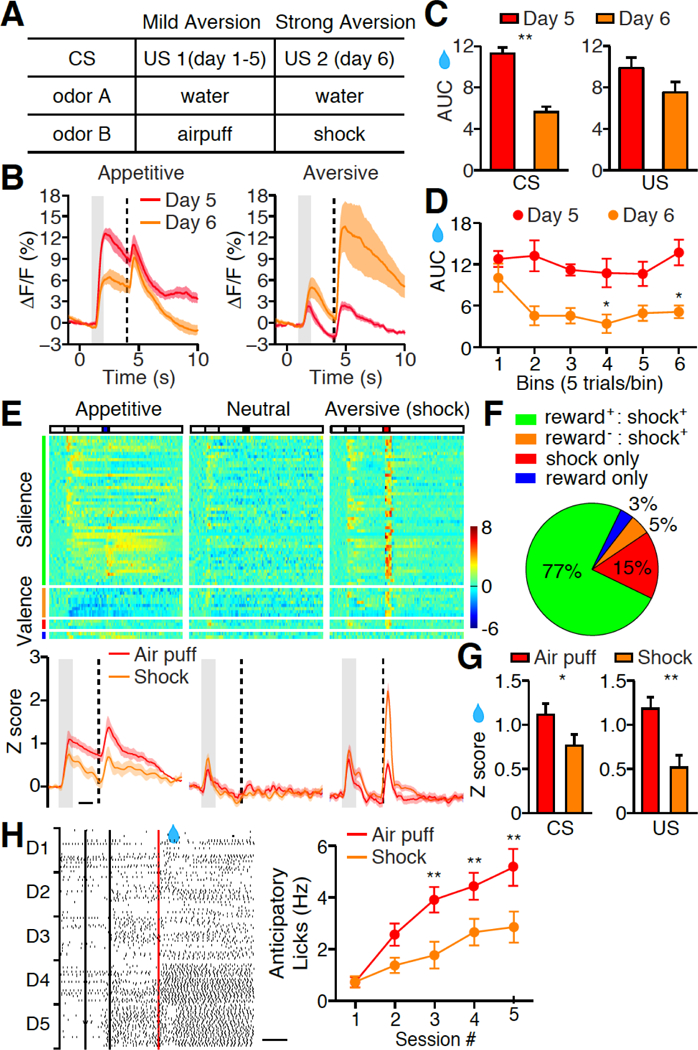
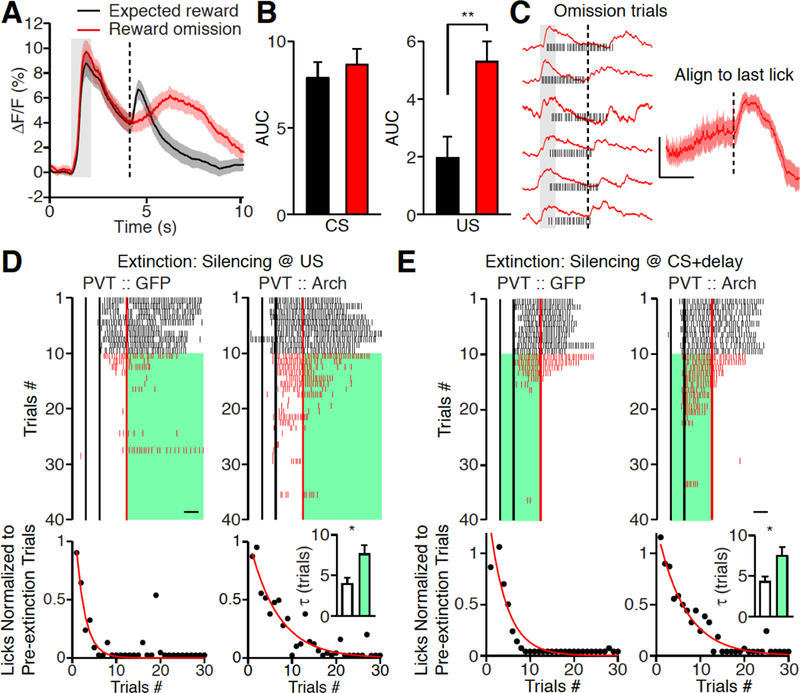
The salience of behaviorally relevant stimuli is dynamic and influenced by internal state and external environment. Monitoring such changes is critical for effective learning and flexible behavior, but the neuronal substrate for tracking the dynamics of stimulus salience is obscure. We found that neurons in the paraventricular thalamus (PVT) are robustly activated by a variety of behaviorally relevant events, including novel ("unfamiliar") stimuli, reinforcing stimuli and their predicting cues, as well as omission of the expected reward. PVT responses are scaled with stimulus intensity and modulated by changes in homeostatic state or behavioral context. Inhibition of the PVT responses suppresses appetitive or aversive associative learning and reward extinction. Our findings demonstrate that the PVT gates associative learning by providing a dynamic representation of stimulus salience.


Figures

Fig. 1.
Fig. 1.. PVT neurons encode salience irrespective of valence.
(A) Top: Photometric traces of calcium responses in the PVT to 10 repetitions of randomized odor (Left) and water (5μl, Right) stimuli. Dashed line indicates the time of stimulus delivery. Scale bar, 10% ΔF/F, 3 s. Bottom: Left Y axis, quantification of odor (black dot) and free water (red dot) evoked ΔF/F over 10 repetitions. Right Y axis, quantification of free water (orange circle) evoked licks over 10 repetitions. Novel odor: n = 6 mice; Free water n = 12 mice; Licks: n = 12 mice. (B) Trial structure of the Pavlovian conditioning paradigm. ITI, inter-trial interval. CS: conditioned stimulus; US: unconditioned stimulus. (C) Mean lick rate of well-trained animals (n = 7) shows anticipatory licking in appetitive (blue) but not neutral (black) and aversive (red) trials. Gray bar: 1s of CS delivery; Vertical dash line: US delivery. (D) Mean photometric responses of the PVT to CS and US in both appetitive (blue) and aversive (red) but not neutral (black) trials. Shade, SEM across mice, n = 7 mice. (E) Z score heat maps (left) and pie chart (right) for all task-responding neurons identified by in vivo single-unit recording during Pavlovian tasks of well-trained animals. Neurons are separated in five subgroups based on their tuning properties, and are rank-ordered by their response onset times during reward cue stimulation. Each row in the heat maps represents responses from the same neuron to different stimuli. n = 85 neurons from 12 mice. (F, G) Mean photometric responses (F, n = 7 mice) and quantification (G) showing that CS and US response in the PVT are graded to different intensity of reward (left, 5 vs 15 μl water) and punishment (right, air puff vs. tail shock). AUC, area under curve (see methods). Scale bar, 2% (F, left), 4% (F, right) ΔF/F, 1s. Big, small reward and nothing: n = 7,7,7; Big, small punishment and nothing: n = 6,6,5. *P < 0.05, **P < 0.01 (One-way ANOVA, Post-hoc Tukey’s test). Shade, SEM across mice in C, D, F. Data are means ± SEM.
Fig. 2.
Fig. 2.. Dynamics of salience response in PVT neurons during associative learning.
(A) Representative photometric responses in the PVT across multiple sessions of Pavlovian conditioning (session 1 to 5). Gray bar: 1s of CS delivery; Vertical dash line: US delivery; Horizontal dash line: baseline ΔF/F. Upper panel: appetitive; Middle panel: nothing; Lower panel: aversive. Scale bar: 5% ΔF/F. Each photometric trace is averaged from all 50 trials within single conditioning session. (B) Quantification of CS response (top) and US response (bottom) across 5 training sessions (n = 6). Note the significant increase of CS responses following training, whereas the US responses remain consistent. *P < 0.05, **P < 0.01, ***P < 0.001 (Two-way ANOVA, Post-hoc Bonferroni test). (C) Mean photometric responses of the PVT to expected and unexpected delivery of reward (top, n = 10; Dark blue: expected; Light blue: unexpected) and punishment (bottom, n = 10; Red: expected; Orange: unexpected). Scale bar: 4% ΔF/F. (D) Quantification of C. Wilcoxon signed-rank test: P = 0.32 (Reward); P = 0.49 (Punishment). (E) Mean Z score of single unit responses of the PVT neurons to expected and unexpected delivery of reward (top, n = 31 neurons) and punishment (bottom, n = 22 neurons). (F) Quantification of E. Wilcoxon signed-rank test: P = 0.28 (Reward); P = 0.11 (Punishment). Gray bar: 1s of CS delivery; Vertical dash line: US delivery, Scale bar: 1s in A, C, E. Shade, SEM across mice in C, E. Data are means ± SEM.
Fig. 3.
Fig. 3.. Photoinhibition of PVT impairs associative learning.
(A, C) Top: representative lick raster plots from PVT :: GFP (left) and PVT :: ArchT mice (right) across 5 conditioning sessions and the NL test when light stimulation was delivered during CS + delay period (A) or after US delivery (C). NL, non-laser. Back lines indicate the start and end time for odor delivery, respectively. Red line indicates water delivery. Green shade indicates laser stimulation. Bottom: representative change of lick rate across 5 conditioning sessions (D1 to D5: Blue, Light blue, Green, Yellow, and Orange) and the NL test (Black). (B, D) Quantification of anticipatory licks of A and C, respectively. B: PVT :: GFP mice, n = 7; PVT :: ArchT mice, n = 7. D: PVT :: GFP mice, n = 6; PVT :: ArchT mice, n = 8. ** P < 0.01 (Two-way ANOVA, Post hoc Bonferroni test). (E) Representative lick raster plots (left) and histograms (right) from well-trained PVT :: ArchT mice with laser off and on. Green, laser on (n = 6). Scale bar: 1s. Wilcoxon signed-rank test: P = 0.84. (F) Schematics of go/no-go task. (G) Anticipatory lick rate of go trials (left) and no-go trials (right) from PVT :: GFP (n = 9) and PVT :: ArchT (n = 9) mice on the last day of training. Mann-Whitney U-test, *P < 0.05. (H) Discriminability of go and no-go trials over training. Discriminability was calculated as (Lickgo-Lickno-go)/( Lickgo+Lickno-go). * P < 0.05, ** P < 0.01 (Two-way ANOVA, Posthoc Bonferroni test). Data are means ± SEM.
Fig. 4.
Fig. 4.. Effect of homeostatic state on PVT responses.
(A) Mean lick rate after odor cue in thirsty (left, dark blue, n = 7) and sated (right, light blue, n = 7) state. (B, C) Mean photometric traces (B) and quantification (C) of PVT responses in appetitive (left), neutral (middle), and aversive (right) test in thirsty (left, dark blue) and sated (right, light blue) state. CS (top) and US (bottom) response in C. Thirsty: n= 7; Sated: n = 7; *P < 0.05, **P < 0.01, ***P < 0.001 (Mann-Whitney U-test). Shade, SEM across mice in A, B. Gray bar: 1s of CS delivery, vertical dash line: US delivery in A, B. Data are means ± SEM.
Fig. 5.
Fig. 5.. Context-dependent modulation of salience response in the PVT.
(A) Behavioral procedure for switching from mild to strong aversive context. (B) Mean photometric responses of the PVT to appetitive and aversive test in mild (n = 6) versus strong aversive context (n = 6). (C) Quantification of CS (left) and US (right) response in B. Mann-Whitney U-test, **P < 0.01 (CS); P = 0.15 (US). (D) Rapid suppression of PVT response to water predicting cue after switching from mild to strong aversive context. Note no further reduction observed after 10 trials. (E) Top, Z score heat maps for all task-responding neurons identified by in vivo single unit recording of well-trained animals in strong aversive context. Neurons are separated in four subgroups based on their tuning properties, and are rank-ordered by their response onset times during reward cue stimulation. Each row in the heat maps represents responses from the same neuron to different stimuli. n = 62 neurons from 12 mice. Bottom, Z score quantification of PVT response during Pavlovian tasks. (F) Pie chart shows the tuning of PVT neurons in strong aversive context. (G) Z score quantification of CS (left) and US (right) response in the PVT during appetitive test in mild (n = 85 neurons) versus strong aversive context (n = 62 neurons). Mann-Whitney U-test, *P < 0.05 (CS); **P < 0.01 (US). (H) Left, raster plots illustrate licking behavior across 5 reward conditioning sessions in strong aversive context. . Right, quantification of anticipatory licks during reward conditioning in mild (red, n = 7) versus strong aversive context (orange, n = 7). **P < 0.01, (Two-way ANOVA, Post-hoc Bonferroni test). Red, mild aversive condition; Orange, strong aversive condition, in E, G, H. Shade, SEM across mice in B, E. Gray bar: 1s of CS delivery, vertical dash line: US delivery in B, E. Scale bar: 1s in E, H. Data are means ± SEM.
Fig. 6.
Fig. 6.. Reward omission response in the PVT.
(A, B) Mean photometric traces (A) and histogram (B) illustrating delayed but long lasting PVT responses to reward omission. Expected reward (black, n = 10); Reward omission (red, n = 10), Wilcoxon signed-rank test, P = 0.19 (CS); **P < 0.01 (US). (C) Left, representative traces of individual omission response (red) superimposed with lick raster plots (black). Right, mean photometric traces (n = 10) after aligning to the last lick in omission trials. Note the rapid increase of calcium signals after licking stops. Scale Bar, 2% ΔF/F, 1s. Gray bar: CS delivery, vertical dash line: US delivery in A, C. (D, E) Top, representative lick raster plots from PVT :: GFP (left) and PVT :: ArchT mice (right) with laser stimulation during reward omission period (D) or CS + delay period (E) of extinction trials. Back lines indicate the start and end time for odor delivery, respectively. Red line indicates water delivery. Scale bar: 1s. The mice received water reward in first 10 trials (black), then water delivery stopped (red) and optogenetic stimulation was on until the end of the trial (green). Bottom: quantification of anticipatory licks in 30 extinction trials. Licks (black dot) are normalized to averaged licks during the first 10 trials. Red line indicates the exponential fit of licks. D: Inset, histogram shows the mean time constants (τ) of extinction from PVT :: GFP (white, n = 6) and PVT :: ArchT (green, n = 10) mice. E: Inset, histogram shows the mean time constants (τ) of extinction from PVT :: GFP (white, n = 9) and PVT :: ArchT (green, n = 10) mice. Mann-Whitney U-test, *P < 0.05. Shade, SEM across mice in A, C. Data are means ± SEM.

References

    1. Knudsen EI, Fundamental components of attention. Annual review of neuroscience 30, 57 (2007). - PubMed
    1. Fecteau JH, Munoz DP, Salience, relevance, and firing: a priority map for target selection. Trends in cognitive sciences 10, 382 (August, 2006). - PubMed
    1. Menon V, Salience Network. Brain Mapping: An Encyclopedic Reference (Elsevier, 2015).
    1. Uddin LQ, Salience processing and insular cortical function and dysfunction. Nature reviews. Neuroscience 16, 55 (January, 2015). - PubMed
    1. Ghazizadeh A, Griggs W, Hikosaka O, Ecological Origins of Object Salience: Reward, Uncertainty, Aversiveness, and Novelty. Frontiers in neuroscience 10, 378 (2016). - PMC - PubMed

Publication types