

ADAR1-mediated RNA editing is required for thymic self-tolerance and inhibition of autoimmunity
- PMID: 30361393
- PMCID: PMC6280791
- DOI: 10.15252/embr.201846303
ADAR1-mediated RNA editing is required for thymic self-tolerance and inhibition of autoimmunity
Abstract
T cells play a crucial role in the adaptive immune system, and their maturation process is tightly regulated. Adenosine deaminase acting on RNA 1 (ADAR1) is the enzyme responsible for adenosine-to-inosine RNA editing in dsRNAs, and loss of ADAR1 activates the innate immune sensing response via melanoma differentiation-associated protein 5 (MDA5), which interprets unedited dsRNA as non-self. Although ADAR1 is highly expressed in the thymus, its role in the adaptive immune system, especially in T cells, remains elusive. Here, we demonstrate that T cell-specific deletion of Adar1 in mice causes abnormal thymic T cell maturation including impaired negative selection and autoimmunity such as spontaneous colitis. This is caused by excessive expression of interferon-stimulated genes, which reduces T cell receptor (TCR) signal transduction, due to a failure of RNA editing in ADAR1-deficient thymocytes. Intriguingly, concurrent deletion of MDA5 restores thymocyte maturation and prevents colitis. These findings suggest that prevention of MDA5 sensing of endogenous dsRNA by ADAR1-mediated RNA editing is required for preventing both innate immune responses and T cell-mediated autoimmunity.
Keywords: MDA5; RNA editing; T cell maturation; negative selection; spontaneous colitis.
© 2018 The Authors.
Figures
- A
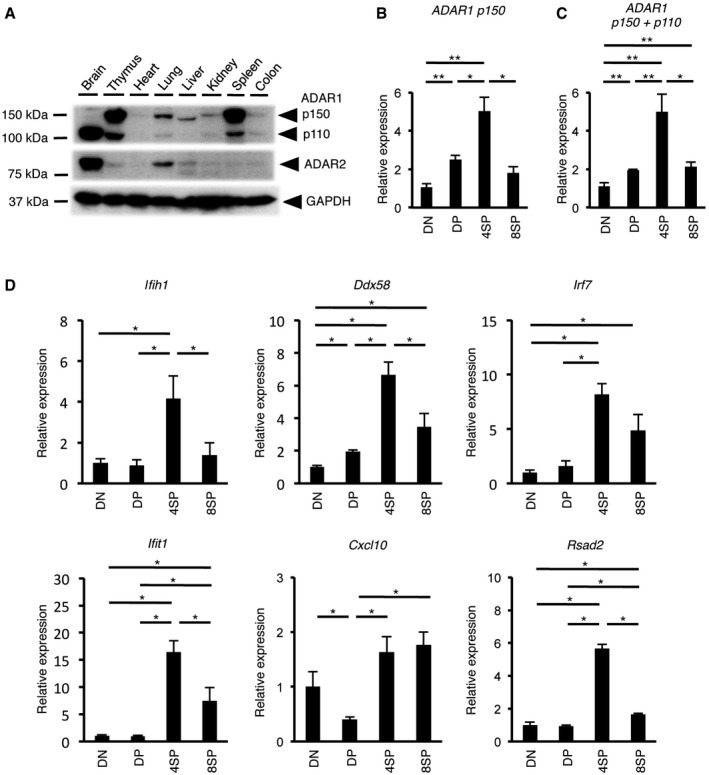
Immunoblot analysis of ADAR1 p110, ADAR1 p150, and ADAR2 expression in various organs isolated from wild‐type (WT) mice. The expression of GAPDH is shown as a reference.
- B, C
The relative expression of ADAR1 p150 mRNA (B) and total ADAR1 mRNA (C) in sorted DN, DP, 4SP, and 8SP thymocytes isolated from WT mice. The relative expression of ADAR1 p150 mRNA (B) and total ADAR1 mRNA (C) was normalized to the level of expression in DN thymocytes (DN values set to 1). Values represent the relative gene expression normalized to GAPDH mRNA and are displayed as the mean ± SEM (n = 5; Mann–Whitney U‐test, *P < 0.05, **P < 0.01).
- D
The relative expression of type I interferon‐stimulated genes (ISGs) in sorted DN, DP, 4SP, and 8SP thymocytes isolated from WT mice. Values represent the relative gene expression normalized to GAPDH mRNA and are displayed as the mean ± SEM (n = 3; Mann–Whitney U‐test, *P < 0.05). The relative expression of ISGs was normalized against the level of expression in DN thymocytes (DN values set to 1).
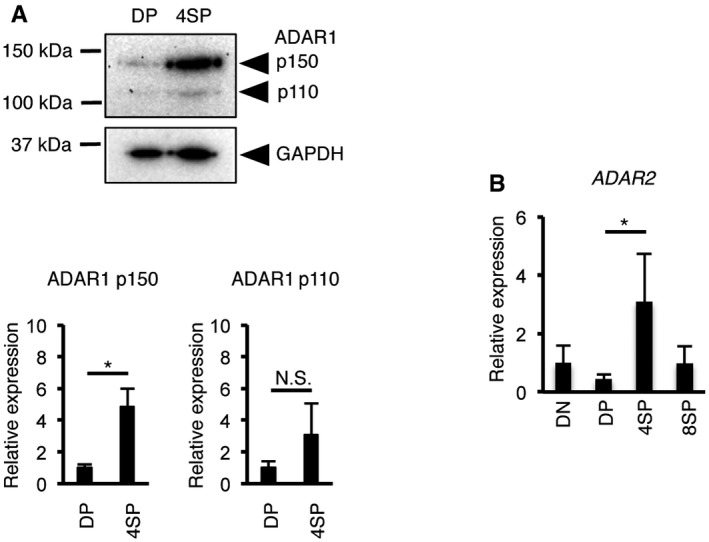
Immunoblot analysis of ADAR1 expression in DP and 4SP thymocytes isolated from wild‐type (WT) mice. Representative images are shown (upper panel). The band intensity of each ADAR1 isoform was normalized to that of GAPDH and is displayed as the mean ± SEM (n = 3; Mann–Whitney U‐test, *P < 0.05) (lower panel). The mean value for the relative expression of ADAR1 in DP thymocytes was set as 1.
The relative expression of ADAR2 mRNA in sorted double‐negative (DN), double‐positive (DP), CD4+ single‐positive (4SP), and CD8+ single‐positive (8SP) thymocytes isolated from wild‐type (WT) mice. The relative expression of ADAR2 mRNA was normalized to the level of expression in DN thymocytes (DN values set to 1). Values represent the relative gene expression normalized to GAPDH mRNA and are displayed as the mean ± SEM (n = 3; Mann–Whitney U‐test, *P < 0.05).
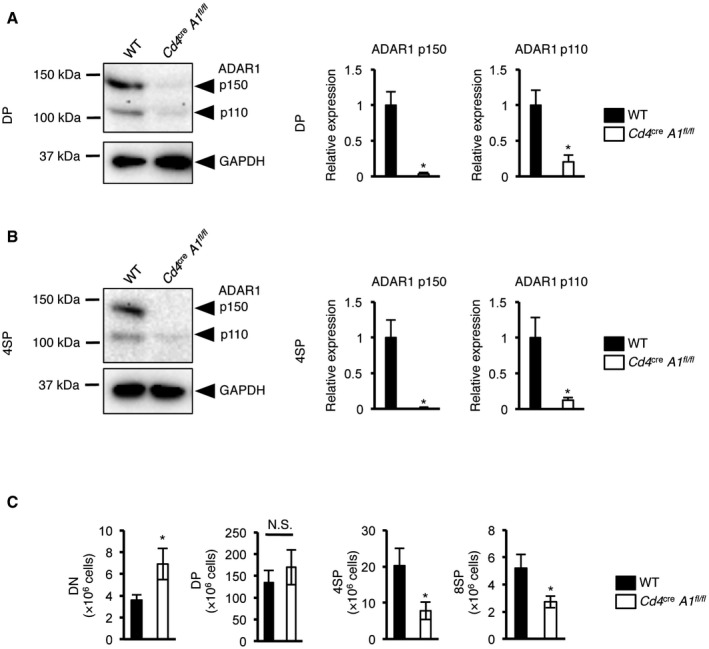
- A, B
Immunoblot analysis of ADAR1 expression in DP (A) and 4SP (B) thymocytes isolated from wild‐type (WT) and CD4+ cell‐specific Adar1 knockout (Cd4 cre A1 fl/fl) mice. Representative images are shown (left panel). The band intensity of each ADAR1 isoform was normalized to that of GAPDH and is displayed as the mean ± SEM (n = 3; Mann–Whitney U‐test, *P < 0.05; right panel). The mean value for the relative expression of ADAR1 in WT thymocytes was set as 1.
- C
The absolute number of double‐negative (DN), double‐positive (DP), CD4+ single‐positive (4SP), and CD8+ single‐positive (8SP) thymocytes isolated from wild‐type (WT) and Cd4 cre A1 fl/fl mice. Values are displayed as the mean ± SEM (n = 7 for each group; Mann–Whitney U‐test, *P < 0.05, N.S., not significant).
- A
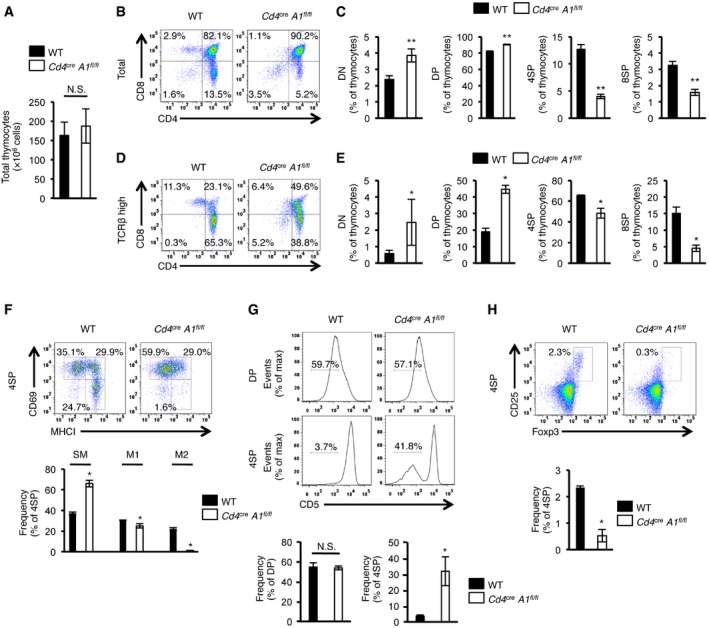
Total number of thymocytes in wild‐type (WT) and CD4+ cell‐specific Adar1 knockout (Cd4 cre A1 fl/fl) mice. Values are displayed as the mean ± SEM (n = 7 for each group; Mann–Whitney U‐test, N.S., not significant).
- B, C
Thymocytes isolated from WT and Cd4 cre A1 fl/fl mice were stained with anti‐CD4 and anti‐CD8 antibodies and analyzed by flow cytometry. Representative images are shown (B). The percentages of DN, DP, 4SP, and 8SP thymocytes were compared between WT and Cd4 cre A1 fl/fl mice (C). Values are displayed as the mean ± SEM (n = 7 for each group; Mann–Whitney U‐test, **P < 0.01).
- D, E
Thymocytes isolated from WT and Cd4 cre A1 fl/fl mice were stained with anti‐CD4, anti‐CD8, and anti‐TCRβ antibodies and were gated by the high expression of TCRβ (TCRβhigh). Representative images are shown (D). The percentages of DN, DP, 4SP, and 8SP thymocytes were compared between WT and Cd4 cre A1 fl/fl mice (E). Values are displayed as the mean ± SEM (n = 3 for each group; Mann–Whitney U‐test, *P < 0.05).
- F
Thymocytes isolated from WT and Cd4 cre A1 fl/fl mice were stained with anti‐CD4, anti‐CD8, anti‐CD69, and anti‐MHC‐I antibodies and were gated on 4SP thymocytes. Representative images are shown (upper panel). The percentages of CD69+MHC‐I− (SM), CD69+MHC‐I+ (M1), and CD69−MHC‐I− (M2) thymocytes were compared between WT and Cd4 cre A1 fl/fl mice (lower panel). Values are displayed as the mean ± SEM (n = 3 for each group; Mann–Whitney U‐test, *P < 0.05).
- G
Thymocytes isolated from WT and Cd4 cre A1 fl/fl mice were stained with antibodies against CD4, CD8 and CD5 and analyzed by flow cytometry. Representative flow cytometric images for DP and 4SP thymocytes are shown (upper panel). The percentages of CD5− DP and 4SP thymocytes were compared between WT and Cd4 cre A1 fl/fl mice (lower panel). Values are displayed as the mean ± SEM (n = 3 for each group; Mann–Whitney U‐test, *P < 0.05, N.S., not significant).
- H
Thymocytes isolated from WT and Cd4 cre A1 fl/fl mice were stained with anti‐CD4, anti‐CD8, anti‐CD25, and anti‐Foxp3 antibodies and were gated on 4SP thymocytes. Representative images are shown (upper panel). The percentages of CD25+Foxp3+ 4SP thymocytes (thymic Treg cells) were compared between WT and Cd4 cre A1 fl/fl mice (lower panel). Values are displayed as the mean ± SEM (n = 3 for each group; Mann–Whitney U‐test, *P < 0.05).
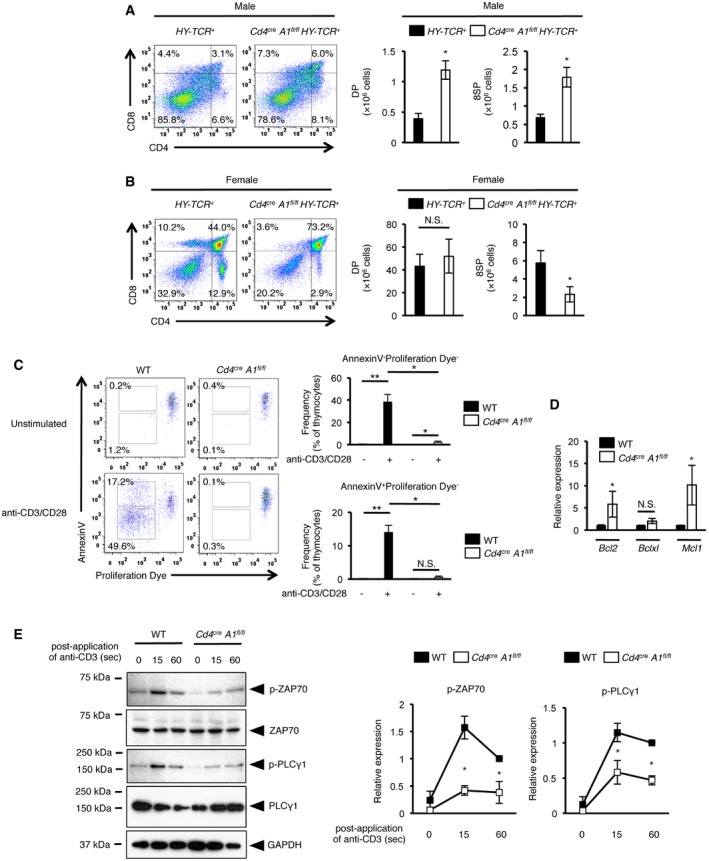
- A, B
CD4+ cell‐specific Adar1 knockout (Cd4 cre A1 fl/fl) mice were crossed with HY‐TCR + mice to generate Cd4 cre A1 fl/fl HY‐TCR + mice. Thymocytes isolated from male (A) and female (B) HY‐TCR + or Cd4 cre A1 fl/fl HY‐TCR + mice were stained with anti‐CD4 and anti‐CD8 antibodies and analyzed by flow cytometry. Representative images are shown (left panels). The absolute number of DP and 8SP thymocytes was compared between HY‐TCR + and Cd4 cre A1 fl/fl HY‐TCR + mice (right panels). Values are displayed as the mean ± SEM (n = 4 for each group; Mann–Whitney U‐test, *P < 0.05, N.S., not significant).
- C
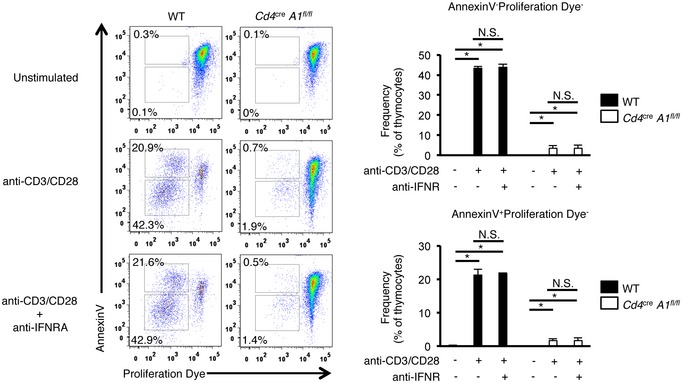
Thymocytes isolated from WT and Cd4 cre A1 fl/fl mice were labeled with Cell Proliferation Dye and then stimulated with plate‐bound anti‐CD3 and anti‐CD28 antibodies for 4 days. Apoptotic (Annexin V+) and proliferating thymocytes (reduced intensity of Proliferation Dye) were determined by flow cytometry. Representative flow cytometric images are shown (left panel). The percentages of either Annexin V+ or Annexin V− proliferating thymocytes were compared between WT (n = 5) and Cd4 cre A1 fl/fl (n = 4) mice (right panel). Values are displayed as the mean ± SEM (Mann–Whitney U‐test, *P < 0.05, **P < 0.01, N.S., not significant).
- D
The relative expression of anti‐apoptotic genes in sorted 4SP thymocytes isolated from WT and Cd4 cre A1 fl/fl mice. Values represent the relative gene expression normalized to Actinβ mRNA and are displayed as the mean ± SEM (n = 3; Mann–Whitney U‐test, *P < 0.05, N.S., not significant). The mean value for the relative expression of each anti‐apoptotic gene in WT 4SP thymocytes was set as 1.
- E
Immunoblot analysis of total and phosphorylated ZAP70 and PLCγ1 expression in anti‐CD3‐stimulated thymocytes isolated from WT and Cd4 cre A1 fl/fl mice. The expression of GAPDH is shown as a reference. Representative images are shown (left panel). The band intensity of p‐ZAP70 and p‐PLCγ1 was normalized to that of total ZAP70 and PLCγ1, respectively, and is displayed as the mean ± SEM (n = 3; Mann–Whitney U‐test, *P < 0.05) (right panel) by setting the mean value of stimulated WT samples at 60 s as 1.
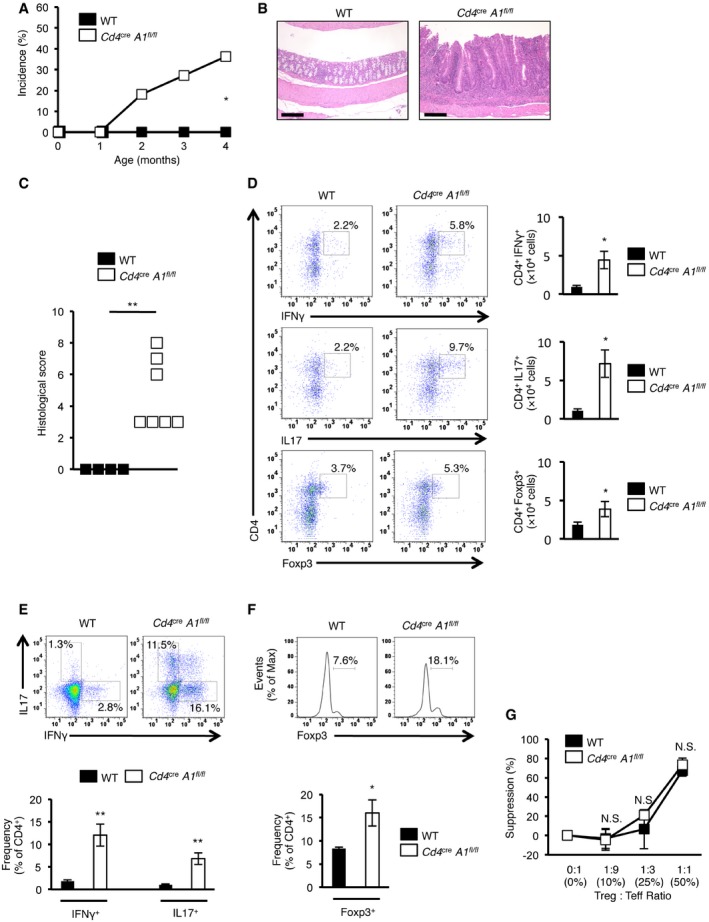
Incidence of spontaneous colitis observed in wild‐type (WT) and CD4+ cell‐specific Adar1 knockout (Cd4 cre A1 fl/fl) mice (n = 11 for each group; Fisher's exact test, *P < 0.05).
Representative images of HE staining of the colon dissected from a WT and Cd4 cre A1 fl/fl mouse. Scale bar, 200 μm.
Histological scores for colitis were compared between WT (n = 4) and Cd4 cre A1 fl/fl (n = 7) mice (Mann–Whitney U‐test, **P < 0.01).
Lymphocytes isolated from the colonic lamina propria of WT and Cd4 cre A1 fl/fl mice were stained with anti‐IFNγ, anti‐IL17, or anti‐Foxp3 antibodies together with anti‐CD4 antibodies and analyzed by flow cytometry. Representative images are shown (left panel). The absolute number of IFNγ‐, IL17‐, or Foxp3‐expressing CD4+ T cells was compared between WT and Cd4 cre A1 fl/fl mice (right panel). Values are displayed as the mean ± SEM (n = 3 for each group; Mann–Whitney U‐test, *P < 0.05).
Splenocytes isolated from WT and Cd4 cre A1 fl/fl mice were stained with anti‐IFNγ and anti‐IL17 together with anti‐CD4 antibodies and were gated on CD4+ cells. Representative flow cytometric images are shown (upper panel). The percentages of IFNγ‐ and IL17‐secreting CD4+ T cells were compared between WT and Cd4 cre A1 fl/fl mice (lower panel). Values are displayed as the mean ± SEM (n = 6 for each group; Mann–Whitney U‐test, **P < 0.01).
Splenocytes isolated from WT and Cd4 cre A1 fl/fl mice were stained with anti‐Foxp3 together with anti‐CD4 antibodies and were gated on CD4+ cells. Representative flow cytometric images are shown (upper panel). The percentages of Foxp3‐expressing CD4+ T cells were compared between WT and Cd4 cre A1 fl/fl mice (lower panel). Values are displayed as the mean ± SEM (n = 4 for each group; Mann–Whitney U‐test, *P < 0.05).
Effector T (Teff) cells isolated from the spleen of a WT mouse were stimulated with soluble anti‐CD3 (5 μg/ml) in the presence of mitomycin C‐treated splenocytes and were cultured with regulatory T (Treg) cells isolated from WT and Cd4 cre A1 fl/fl mice at the indicated ratios. After 72 h, the proliferative activity was measured. Values are displayed as the mean ± SEM (n = 3 for each group; Mann–Whitney U‐test, N.S., not significant). The mean value for the suppression of proliferative activity of Teff cells in a condition without Treg cells was set as 0%.
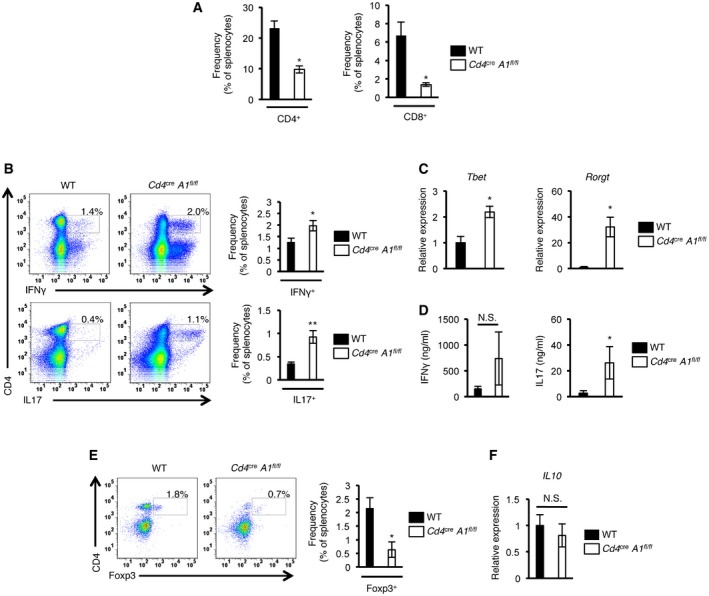
The proportions of CD4+ and CD8+ splenocytes isolated from wild‐type (WT) and CD4+ cell‐specific Adar1 knockout (Cd4 cre A1 fl/fl) mice. Values are displayed as the mean ± SEM (n = 4 for each group; Mann–Whitney U‐test, *P < 0.05).
Splenocytes isolated from WT and Cd4 cre A1 fl/fl mice were stained with either anti‐IFNγ or anti‐IL17 antibodies together with anti‐CD4 antibodies. Representative flow cytometric images are shown (left panel). The percentages of IFNγ‐ and IL17‐secreting CD4+ T cells were compared between WT and Cd4 cre A1 fl/fl mice (right panel). Values are displayed as the mean ± SEM (n = 6 for each group; Mann–Whitney U‐test, *P < 0.05, **P < 0.01).
The relative expressions of Tbet and Rorγt mRNAs in splenic CD4+ T cells isolated from WT and Cd4 cre A1 fl/fl mice. Values represent the relative gene expressions normalized to Actinβ mRNA and are displayed as the mean ± SEM (n = 3; Mann–Whitney U‐test, *P < 0.05). The mean value for the relative expression of Tbet and Rorγt mRNAs in WT splenic CD4+ T cells was set as 1.
Splenic CD4+ T cells isolated from WT and Cd4 cre A1 fl/fl mice were stimulated with plate‐bound anti‐CD3 and anti‐CD28 antibodies for 72 h, and the levels of IFNγ and IL17 in supernatants were measured by ELISA. Values are displayed as the mean ± SEM (n = 5 for each group; Mann–Whitney U‐test, *P < 0.05, N.S., not significant).
Splenocytes isolated from WT and Cd4 cre A1 fl/fl mice were stained with anti‐Foxp3 antibodies together with anti‐CD4 antibodies. Representative flow cytometric images are shown (left panel). The percentages of Foxp3‐expressing CD4+ T cells were compared between WT and Cd4 cre A1 fl/fl mice (right panel). Values are displayed as the mean ± SEM (n = 4 for each group; Mann–Whitney U‐test, *P < 0.05).
The relative expression of IL10 mRNA in mesenteric lymph node (MLN)‐derived Treg cells isolated from WT and Cd4 cre A1 fl/fl mice. Values represent the relative gene expression normalized to GAPDH mRNA and are displayed as the mean ± SEM (n = 3; Mann–Whitney U‐test, N.S., not significant). The mean value for the relative expression of IL10 mRNA in WT MLN‐derived Treg cells was set as 1.
- A
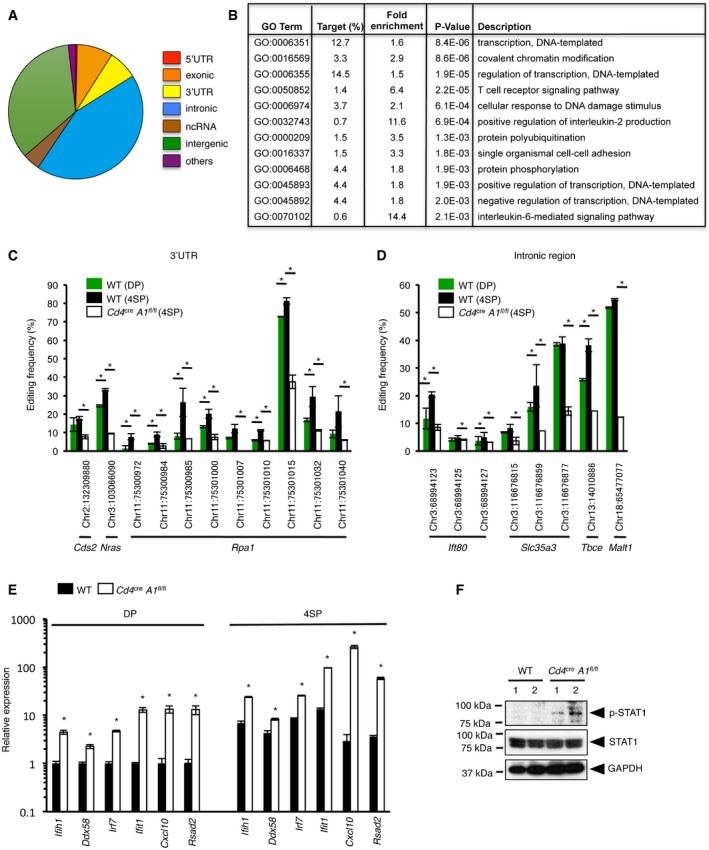
Distribution of the potential RNA editing sites found in 4SP thymocytes.
- B
The top 12 categories of biological processes, which are ranked according to the P‐value, for the genes that contained potential RNA editing sites at the 4SP stage. Fisher's exact test was used for the statistical analysis. GO, gene ontology.
- C, D
RNA editing in the 3′UTR (C) and intronic region (D) of each gene indicated in the figures with their chromosomal location was validated by direct Sanger sequencing, and the frequency of editing was compared among wild‐type (WT) DP thymocytes, WT 4SP thymocytes, and 4SP thymocytes isolated from CD4+ cell‐specific Adar1 knockout (Cd4 cre A1 fl/fl) mice. Values are displayed as the mean ± SEM (n = 3 for each group; Mann–Whitney U‐test, *P < 0.05).
- E
The relative expression of each interferon‐stimulated gene (ISG) indicated in the figure in sorted DP and 4SP thymocytes isolated from WT and Cd4 cre A1 fl/fl mice. Values represent the relative gene expression normalized to GAPDH mRNA and are displayed as the mean ± SEM (n = 3; Mann–Whitney U‐test, *P < 0.05). The mean value for the relative expression of each ISG in WT DP thymocytes was set as 1.
- F
Immunoblot analysis of total and phosphorylated STAT1 expression in thymocytes isolated from WT and Cd4 cre A1 fl/fl mice (n = 2 for each group). The expression of GAPDH is shown as a reference.
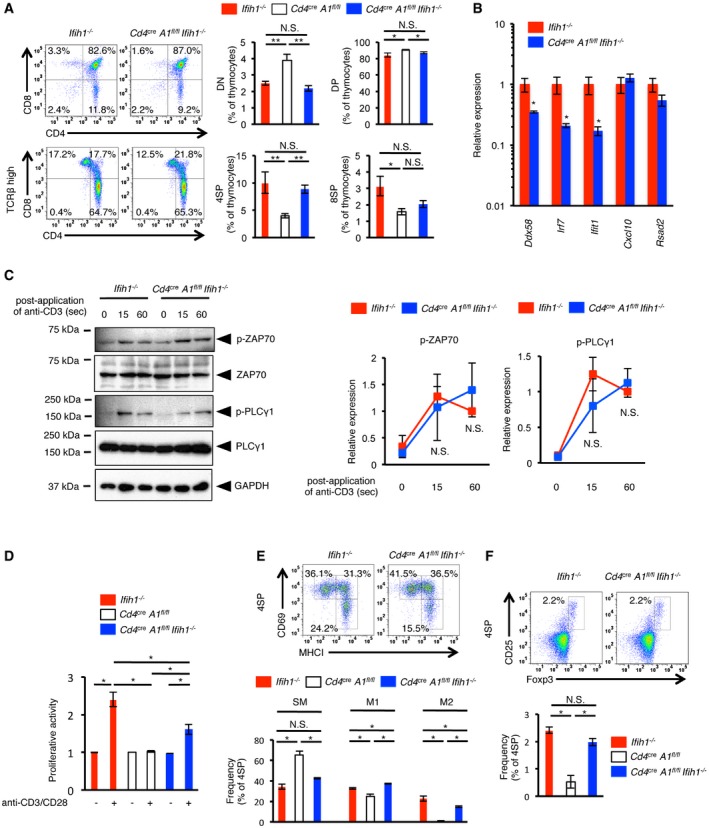
CD4+ cell‐specific Adar1 knockout (Cd4 cre A1 fl/fl) mice were crossed with MDA5 knockout (Ifih1 −/−) mice to generate Cd4 cre A1 fl/fl Ifih1 −/− mice. Thymocytes isolated from Ifih1 −/− and Cd4 cre A1 fl/fl Ifih1 −/− mice were stained with anti‐CD4, anti‐CD8, and anti‐TCRβ antibodies and analyzed by flow cytometry. Representative images are shown (left panel). The percentages of DN, DP, 4SP, and 8SP thymocytes were compared among Ifih1 −/− (n = 4), Cd4 cre A1 fl/fl Ifih1 −/− (n = 5), and Cd4 cre A1 fl/fl (n = 7) mice (right panel). The same data shown in Fig 2C were used for Cd4 cre A1 fl/fl mice. Values are displayed as the mean ± SEM (Mann–Whitney U‐test, *P < 0.05, **P < 0.01, N.S., not significant).
The relative expression of each interferon‐stimulated gene (ISG) indicated in the figure in sorted 4SP thymocytes isolated from Ifih1 −/− and Cd4 cre A1 fl/fl Ifih1 −/− mice. Values represent the relative gene expression normalized to GAPDH mRNA and are displayed as the mean ± SEM (n = 3; Mann–Whitney U‐test, *P < 0.05). The mean value for the relative expression of each ISG in Ifih1 −/− 4SP thymocytes was set as 1.
Immunoblot analysis of total and phosphorylated ZAP70 and PLCγ1 expression in anti‐CD3‐stimulated thymocytes isolated from Ifih1 −/− and Cd4 cre A1 fl/fl Ifih1 −/− mice. The expression of GAPDH is shown as a reference. Representative images are shown (left panel). The band intensity of p‐ZAP70 and p‐PLCγ1 was normalized to that of total ZAP70 and PLCγ1, respectively, and is displayed as the mean ± SEM (n = 3; Mann–Whitney U‐test, N.S., not significant) (right panel) by setting the mean value of stimulated Ifih1 −/− samples at 60 s as 1.
Thymocytes isolated from Ifih1 −/− and Cd4 cre A1 fl/fl Ifih1 −/− mice were stimulated with plate‐bound anti‐CD3 (5 μg/ml) and anti‐CD28 (1 μg/ml) antibodies for 72 h, and the proliferative activity was measured. Values are displayed as the mean ± SEM (n = 3 for each group; Mann–Whitney U‐test, *P < 0.05). The mean value for the activity of Ifih1 −/− thymocytes in an unstimulated condition was set as 1. For comparative analysis, the same data shown in Appendix Fig S1B were used for Cd4 cre A1 fl/fl mice.
Thymocytes isolated from Ifih1 −/− and Cd4 cre A1 fl/fl Ifih1 −/− mice were stained with anti‐CD4, anti‐CD8, anti‐CD69, and anti‐MHC‐I antibodies and were gated on 4SP thymocytes. Representative images are shown (upper panel). The percentages of CD69+MHC‐I− (SM), CD69+MHC‐I+ (M1), and CD69−MHC‐I− (M2) thymocytes were compared among Ifih1 −/− (n = 5), Cd4 cre A1 fl/fl Ifih1 −/− (n = 3), and Cd4 cre A1 fl/fl (n = 3) mice (lower panel). The same data shown in Fig 2F were used for Cd4 cre A1 fl/fl mice. Values are displayed as the mean ± SEM (Mann–Whitney U‐test, *P < 0.05, N.S., not significant).
Thymocytes isolated from Ifih1 −/− and Cd4 cre A1 fl/fl Ifih1 −/− mice were stained with anti‐CD4, anti‐CD8, anti‐CD25, and anti‐Foxp3 antibodies and were gated on 4SP thymocytes. Representative images are shown (upper panel). The percentages of CD25+Foxp3+ 4SP thymocytes (thymic Treg cells) were compared among Ifih1 −/− , Cd4 cre A1 fl/fl Ifih1 −/−, and Cd4 cre A1 fl/fl mice (lower panel). The same data shown in Fig 2H were used for Cd4 cre A1 fl/fl mice. Values are displayed as the mean ± SEM (n = 3 for each group; Mann–Whitney U‐test, *P < 0.05, N.S., not significant).
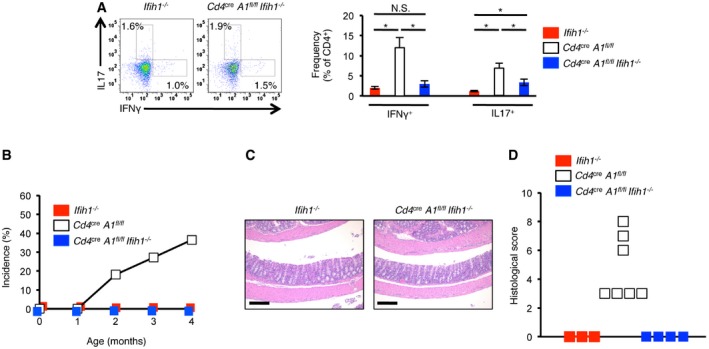
Splenocytes isolated from Ifih1 −/− and Cd4 cre A1 fl/fl Ifih1 −/− mice were stained with anti‐IFNγ and anti‐IL17 together with anti‐CD4 antibodies and were gated on CD4+ cells. Representative flow cytometric images are shown (left panel). The percentages of IFNγ‐ and IL17‐secreting CD4+ T cells were compared among Ifih1 −/− (n = 4), Cd4 cre A1 fl/fl Ifih1 −/− (n = 5), and Cd4 cre A1 fl/fl mice (n = 6) (right panel). The same data shown in Fig 4E were used for Cd4 cre A1 fl/fl mice. Values are displayed as the mean ± SEM (Mann–Whitney U‐test, *P < 0.05, N.S., not significant).
No incidence of spontaneous colitis observed in Ifih1 −/− (n = 5) and Cd4 cre A1 fl/fl Ifih1 −/− (n = 11) mice. For side‐by‐side comparison with Cd4 cre A1 fl/fl mice, the data shown in Fig 4A were included.
Representative images of HE staining of colon dissected from an Ifih1 −/− and a Cd4 cre A1 fl/fl Ifih1 −/− mouse. Scale bar, 200 μm.
Histological scores for the colitis in Ifih1 −/− (n = 3) and Cd4 cre A1 fl/fl Ifih1 −/− (n = 4) mice. For side‐by‐side comparison with Cd4 cre A1 fl/fl mice, the data shown in Fig 4C were included.
Comment in
-
T time for ADAR: ADAR1 is required for T cell self-tolerance.EMBO Rep. 2018 Dec;19(12):e47237. doi: 10.15252/embr.201847237. Epub 2018 Nov 21. EMBO Rep. 2018. PMID: 30467234 Free PMC article.
References
-
- Zipeto MA, Jiang Q, Melese E, Jamieson CH (2015) RNA rewriting, recoding, and rewiring in human disease. Trends Mol Med 21: 549–559 - PubMed
-
- Levanon EY, Eisenberg E, Yelin R, Nemzer S, Hallegger M, Shemesh R, Fligelman ZY, Shoshan A, Pollock SR, Sztybel D et al (2004) Systematic identification of abundant A‐to‐I editing sites in the human transcriptome. Nat Biotechnol 22: 1001–1005 - PubMed
Publication types
MeSH terms
Substances
LinkOut - more resources
Full Text Sources
Molecular Biology Databases
Research Materials
