. 2018 Oct 25;9(1):4430.
doi: 10.1038/s41467-018-06504-7.

A biomaterial with a channel-like pore architecture induces endochondral healing of bone defects

Affiliations

A biomaterial with a channel-like pore architecture induces endochondral healing of bone defects

A Petersen et al. Nat Commun. .

Abstract

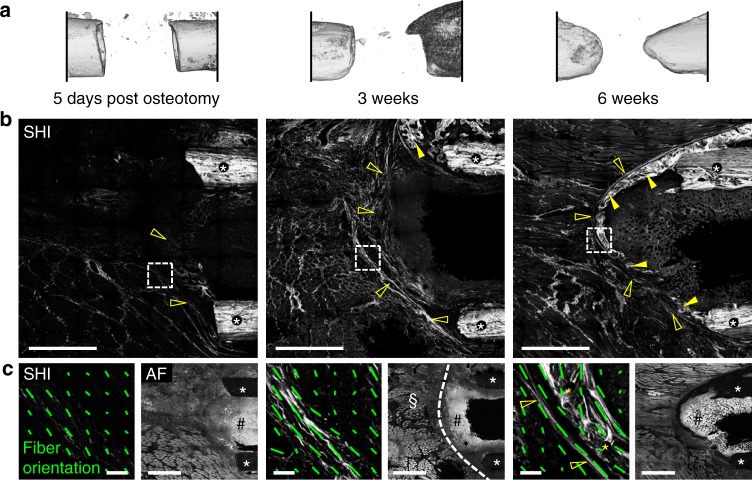
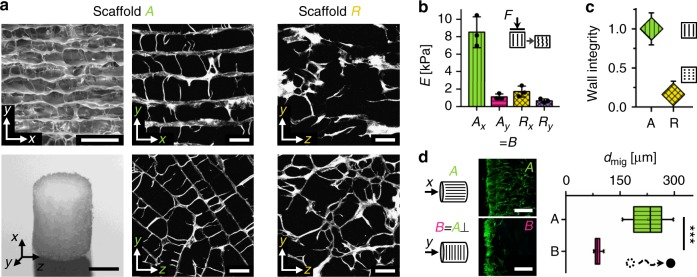
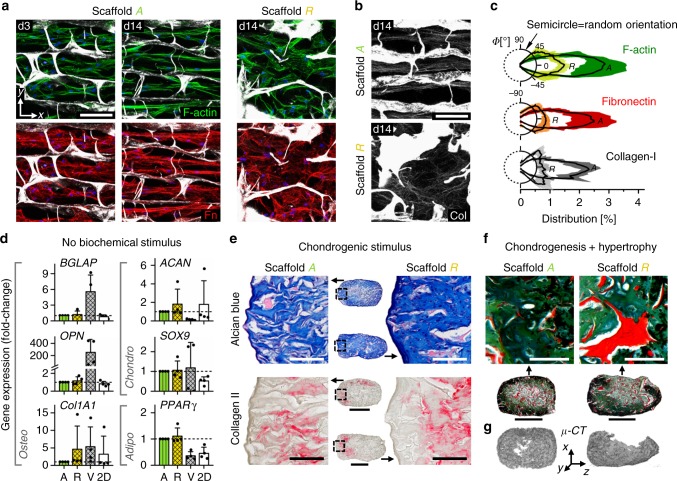
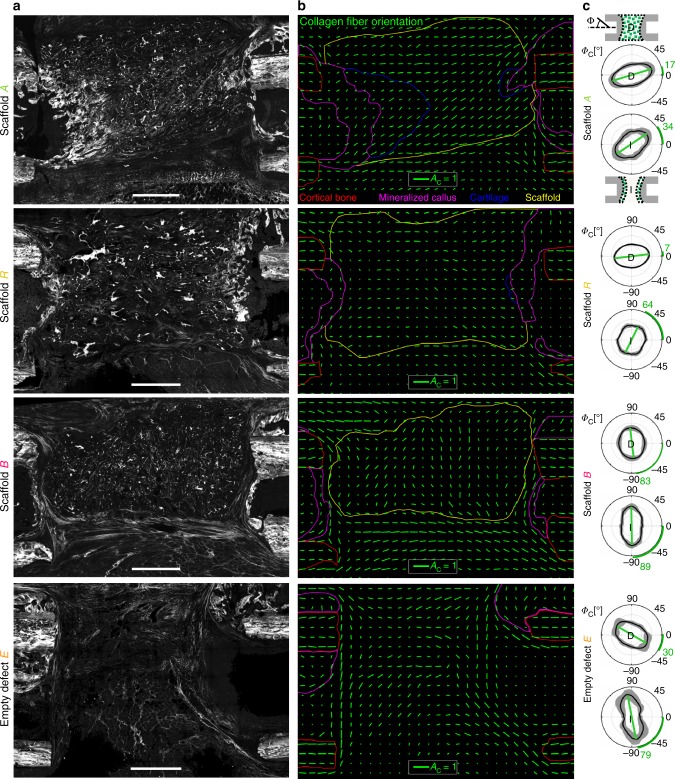
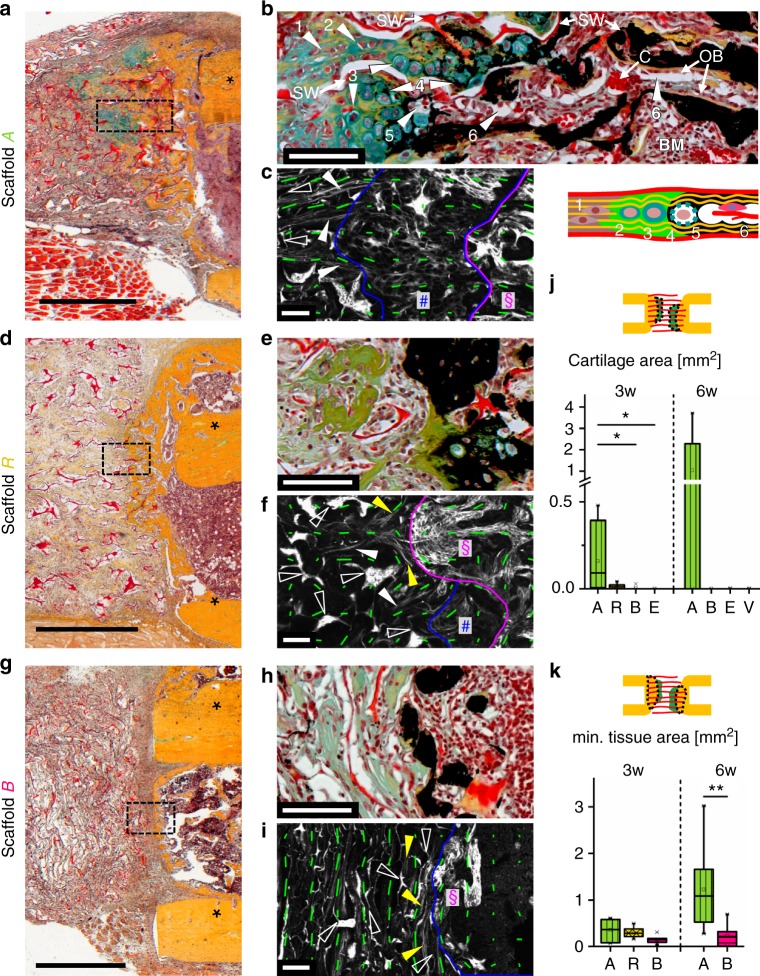
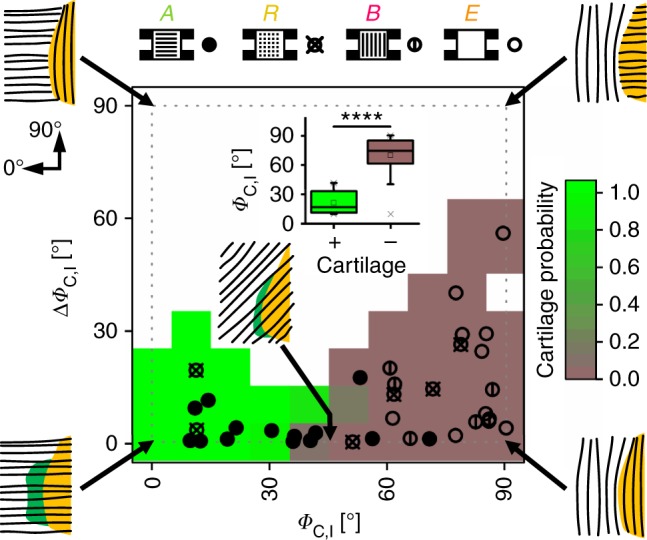
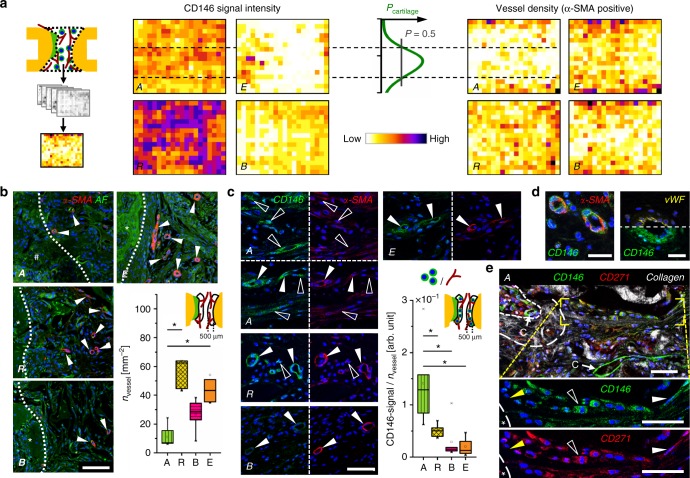
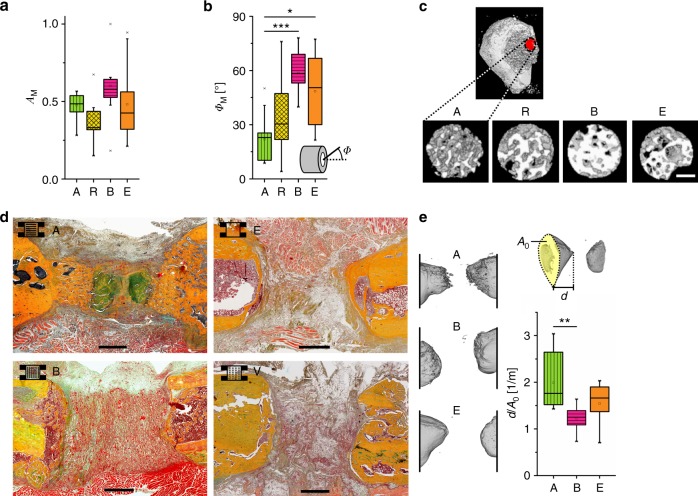
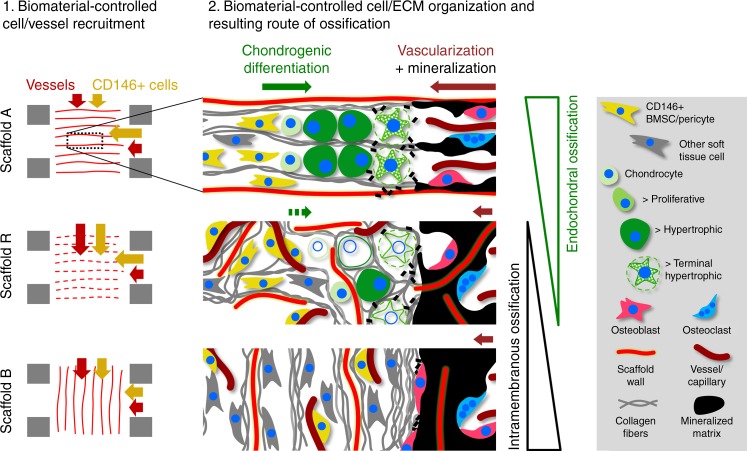
Biomaterials developed to treat bone defects have classically focused on bone healing via direct, intramembranous ossification. In contrast, most bones in our body develop from a cartilage template via a second pathway called endochondral ossification. The unsolved clinical challenge to regenerate large bone defects has brought endochondral ossification into discussion as an alternative approach for bone healing. However, a biomaterial strategy for the regeneration of large bone defects via endochondral ossification is missing. Here we report on a biomaterial with a channel-like pore architecture to control cell recruitment and tissue patterning in the early phase of healing. In consequence of extracellular matrix alignment, CD146+ progenitor cell accumulation and restrained vascularization, a highly organized endochondral ossification process is induced in rats. Our findings demonstrate that a pure biomaterial approach has the potential to recapitulate a developmental bone growth process for bone healing. This might motivate future strategies for biomaterial-based tissue regeneration.


Conflict of interest statement

The authors declare no competing interests.

Figures

Fig. 1
Fig. 1
Distinct collagen fiber patterns forming in bone defect guide tissue mineralization. a 3D µ-CT reconstruction of the 5 mm rat femoral bone defect at different time points showing progression of tissue mineralization toward the formation of a bone-like shell closing the marrow cavity. b Second harmonic imaging showing the emergence of a fibrillar collagen matrix at the end of the bone (open arrowheads) preceding tissue mineralization (full arrowheads). White asterisks indicate the bone cortices. c Orientation analysis revealed that distinct patterns of collagen fibers develop already in the first days post osteotomy and mature towards a dense, dome-like structure until 3 weeks post-op (detailed SHI recordings at regions indicated by dashed-line squares in b). Green lines indicate collagen fiber anisotropy AC (length of line) and direction of primary fiber orientation ΦC (angle) within the local ROIs. The formation of mineralized tissue (6 weeks, post-op, yellow asterisks) is guided by aligned collagen fibers toward the formation of the marrow-closing bone shell. Autofluorescence imaging (AF) indicates the separation of the bone marrow and the periosteum (hash symbol) from the defect region (paragraph symbol) by the deposited collagen fiber structure (dashed white line, 3 weeks post-op). Scale bars for b 1 mm; c SHI-images 50 µm, AF images 1 mm
Fig. 2
Fig. 2
Scaffold pore architecture guides cell migration in vitro. a Scanning electron microscopy (SEM) image showing the scaffold pore architecture with highly aligned pores along the x axis (top left). Photograph of the scaffold as used in vitro (5 mm diameter, 3 mm height) (bottom left). SHG images of the scaffold pore architecture for aligned scaffolds A and random scaffold R cut along (top middle and right) and perpendicular (bottom middle and right) to the direction of directional freezing during production. b Mechanical stiffness of the prototypes in the two directions shown in a (median ± SD). Characterization was performed on n = 3 technical replicates. c Analysis of pore wall integrity indicating a pronounced reduction of pore wall integrity along the x direction in random scaffold R compared with scaffold A (median ± SD). Characterization was performed on n = 8 individual multiphoton image stacks. A high wall integrity is a characteristic feature of the channel-like pore architecture of scaffold A. d Quantification of the migration distance dmig for migration of hBMSCs along (scaffold A) and perpendicular (scaffold B) to the pore orientation 3 days after cell seeding. Images on the left show representative cell distribution close to the surface of the scaffold 24 h post seeding (cross-sections stained for F-actin after cell seeding on the base of the scaffold cylinder). Significance calculated by Mann–Whitney test (two-sided). ***p < 0.001, n = 8 biological replicates (hBMSCs from 8 different donors), n = 2–3 technical replicates per donor. Boxplot in d shows the median, 25th and 75th percentile values (vertical bar, left and right bounds of the box), whiskers indicate the 1.5-fold IQR; open squares indicate means; crosses represent maximum/minimum values. Scale bars for a 200 µm in SEM image, 2 mm in photography, 100 µm in SHG images; d 250 µm
Fig. 3
Fig. 3
Scaffold pore architecture controls ECM structure but not cell differentiation in vitro. a Representative confocal images (maximal intensity projection) of hBMSC organization and matrix formation inside the scaffold pores 3 and 14 days post seeding. Top row shows F-actin of the cytoskeleton in green, lower row shows fibronectin in red. Cell nuclei are shown in blue and scaffold in gray. b SHG maximal intensity projections reveal formation of highly orientated collagen fibers inside the pores of scaffold A but a rather random orientation in scaffold R, 14 days post seeding. c Comparison of fiber orientation distribution (percent of total) for F-actin, fibronectin (Fn) and collagen (Col) in scaffold A compared with scaffold R, 14 days post seeding. Polar diagrams show mean value as solid line and standard deviation as color/gray band. n = 2–3 technical replicates. d Expression of osteogenic, chondrogenic and adipogenic genes for hBMSCs cultured on plastic (2D) and inside scaffolds A, R, and the commercial bone graft substitute Vitoss® (V). It is noteworthy that no significant differences were found between scaffolds A and R. Bar charts show fold-changes of expression compared with scaffold A (mean ± SD). n = 4 biological and n = 3 technical replicates. e Representative histological images of in vitro chondrogenesis of hBMSCs in scaffolds A and R over 3 weeks of culture in chondrogenic medium. Alcian blue staining (glycosaminoglycans) in top row and immunohistological staining for collagen II (red) in bottom row. No noticeable differences between the scaffold types were observed. n = 3 biological replicates. f Pronounced increase of chondrocyte volume and mineralization of the ECM indicate differentiation of scaffold-cartilage tissue into hypertrophic cartilage when cultured in hypertrophic medium for additional 2 weeks (combined Movat’s pentachrome and von Kossa staining). g Verification of matrix mineralization inside scaffolds by µ-CT. Scale bars for a, b 100 μm, e 200 µm (details) and 1 mm (overview), f 100 µm (details) and 1 mm (overview)
Fig. 4
Fig. 4
Scaffold guides collagen fibril alignment within the bone defect. a Representative SHG overview images of the bone defect 3 weeks post-op. b Analysis of local collagen fiber anisotropy in the bone defect zone for representative animals of each group. Green lines indicate anisotropy AC (length of line) and direction of primary fiber orientation ΦC (angle) within local ROIs of 200 µm × 200 µm size. Notice the pore orientation along the bone axis for scaffold A and perpendicular to the bone axis for scaffold B. Regions contoured by colored lines indicate cortical bone (red), mineralized callus matrix (magenta), scaffold (yellow), and cartilage (blue). c Distribution of collagen fiber orientation ΦC within the scaffold (groups A, R, B) or within the empty bone defect (group E) is shown in diagrams labeled “D”. Polar plots show the distribution of orientation as mean values of all animals per group (bold line) and its SD (gray band). Bone axis is ΦC = 0°. The fiber anisotropy can be read as the degree of polarization of the curve (long vs. short axis). Green lines and according green numbers indicate the angle of primary fiber orientation. Analysis of the local fiber orientation at the interface (diagrams labeled “I”) reveal stability of orientation along the bone axis only in scaffold A, whereas orientation in all other groups is dominated by the interface itself with fibers parallel to it and perpendicular to the bone axis (see also Fig. 1c). n = 5–7 animals for c. Scale bars for a 1 mm; b collagen fiber anisotropy AC = 1
Fig. 5
Fig. 5
Biomaterial pore architecture is decisive for the induction of EO. a Movat’s pentachrome (MP) staining showing EO in scaffold A characterized by cartilage (green) at the mineralization front 3 weeks post-op. Asterisks indicate cortical bone. b Magnifications of the cartilage zone in scaffold A in a combined MP and von Kossa staining (mineralized matrix appears black) showing (1) pre-chondrogenic cells, (2) chondrocytes, (3) hypertrophic chondrocytes, (4) mineralization of surrounding matrix, (5) vacated chondrocyte lacunae, (6) resulting channels populated with cells and blood vessels (see also according sketch). SW indicates scaffold wall (appears red), C blood vessel capillaries, OB osteoblasts, BM bone marrow. c SHG image and local anisotropy (green lines) revealing consistent collagen fiber orientation during the transition from the pre-cartilage zone (left of blue line) into cartilage (between blue and magenta line, hash symbol) and mineralized matrix (right of magenta line, paragraph symbol). Full arrowheads indicate in vivo formed collagen fibrils, open arrowheads show scaffold walls. d Reduced ingrowth of mineralized tissue into scaffold R vs. A. Only traces of cartilage were found in individual animals (Supplementary Fig. 2e). e Vanishing of EO in scaffold R (3 weeks post-op) indicated by the entrapment of hypertrophic chondrocytes into mineralized matrix associated with local collagen fiber alignment parallel (f, yellow arrowheads). g Ingrowth of bone into scaffold B was found rarely. h Except of individual chondrocytes in one animal (Supplementary Fig. 2f), no cartilage was found at the mineralization front. i Collagen fibers were predominantly aligned parallel to the mineralization front. j, k Boxplots of histomorphometric data obtained from MP stainings for scaffolds A, R, B, empty defect (E), and Vitoss® (V), 3 and 6 weeks post-op with j total cartilage area and k mineralized tissue area inside the scaffold. Boxplots show the median, 25th, and 75th percentile values (horizontal bar, bottom, and top bounds of the box), whiskers indicate 1.5-fold IQR, open squares indicate means, crosses represent max./min. values. Significance via Mann–Whitney test (two-sided) with Bonferroni correction; *p < 0.05, **p < 0.01, n = 6–7 animals (3 weeks) and 6–8 (6 weeks) per group. Scale bars for a, d, g 1 mm; b, c, e, f, h, i 100 μm
Fig. 6
Fig. 6
Dependency of cartilage incidence on collagen fiber orientation at the mineralization front. Data points in heatmap represent all in vivo specimens with ΦC,I indicating the primary direction of collagen fibers in the non-mineralized matrix (0° = bone axis) and ΔΦC,I indicating the difference in orientation between non-mineralized and mineralized matrix. Full circles represent specimens with scaffold A, crossed circles scaffold R, circles with vertical line scaffold B, and empty circles empty controls E. Green and light brown background colors indicate high and low probability for cartilage, respectively; white background without data points. Pictograms illustrate collagen fiber orientation (black lines) at the mineralization front. Boxplot insert highlights the correlation between low values of ΦC,I and the occurrence of cartilage. Boxplot shows the median, 25th, and 75th percentile values (horizontal bar, bottom, and top bounds of the box), whiskers indicate 1.5-fold IQR, open squares indicate means, crosses represent max./min. values. Significance via Mann–Whitney test (two-sided); ****p < 0.0001
Fig. 7
Fig. 7
High progenitor cell number and low vessel density constitute the environment for EO. a Heatmaps show distribution of CD146 signal and α-SMA-positive vessel density as mean values of all animals for groups A, R, B, and E. The probability to find cartilage in scaffold A was highest in the region with low number of vessels and high number of CD146+ cells (region of Pcartilage > 50%), see also Supplementary Fig. 10. b Immunohistological staining for α-SMA (red), cell nuclei (blue), and autofluorescence (AF) signal (green) at the interface between cartilage (group A, hash symbol) or mineralized tissue (groups R,B,E, asterisk) and non-mineralized tissue. Boxplot shows quantification of α-SMA-positive vessels 3 weeks post-op in a ROI of 500 µm from the interface. c Immunohistological staining for CD146 (green) and α-SMA (red) close to the interface showing CD146 signal around vessels, but also associated with individual elongated cells for group A (open arrowheads), bright CD146 signal around vessels for group R (full arrowheads), and lower CD146 signal around vessels for group B and E. Boxplot shows the ratio between CD146 signal and vessel density 3 weeks post-op in a ROI of 500 µm from the interface. d CD146 and α-SMA signal were both perivascular but did not colocalize. CD146 signal was detected outside the endothelium stained by von Willebrand Factor (vWF) in consecutive sections, verifying the specificity of CD146 staining. e CD146+ cells were found to be involved in the process of EO. Magnifications show cells in the pre-cartilage region (full white arrowheads) and in the cartilage region (open arrowheads) expressing CD146 but also CD271. CD146 signal was also found around capillaries (C) in the pre-chondrogenic region and in the bone marrow (double asterisk). Bone marrow was enframed by mineralized tissue rich in collagen (asterisk). All boxplots show the median, 25th, and 75th percentile values (horizontal bar, bottom, and top bounds of the box), whiskers indicate 1.5-fold IQR, open squares indicate means, crosses represent max./min. values. Significances via Mann–Whitney test (two-sided) with Bonferroni correction for b, c; *p < 0.05. n = 5–7 animals per group for a, b, c. Scale bars for b 100 µm, c, d 50 µm, e 25 µm
Fig. 8
Fig. 8
Scaffold-induced endochondral ossification forms an aligned network of mineralized matrix supporting directional bone regeneration. a Quantification of the structural anisotropy AM in the mineralized matrix close to the mineralization front between non-mineralized and mineralized matrix derived from 3D reconstructed in vitro µ-CT data. Both the proximal and the distal mineralization front were analyzed resulting in two values per sample. Boxplot shows a non-significant trend for a reduced anisotropy AM in scaffolds R compared with the other scaffold groups (A, B), 3 weeks post-op. b Analysis of the primary direction of anisotropy of the mineralized matrix. Boxplot shows the angle ΦM relative to the bone axis. Significant differences were found between scaffold A and both, scaffold B and the empty control group while the data points of group R showed a strong scattering. c 3D µ-CT reconstruction of the mineralized matrix in the VOIs used for quantification in a and b. The red dot indicates the position of the VOI at the growth tip of the mineralized callus. d Movat’s pentachrome staining showing guided EO along the scaffold pore orientation for A and no ingrowth for B and V compared with the formation of a bony shell for empty controls E, 6 weeks post-op. e 3D µ-CT reconstruction of the resulting bone geometry for A, B, and E, 6 weeks post-op. Boxplot shows the ratio d/A0 representing the length of the callus in the direction of the bone axis d divided by the cross-sectional area A0 at the osteotomy plane as a measure of the directionality of mineralization across the bone defect. All boxplots show the median, 25th, and 75th percentile values (horizontal bar, bottom, and top bounds of the box), whiskers indicate 1.5-fold IQR, open squares indicate means, crosses represent max./min. values. Statistical significance via Mann–Whitney test (two-sided) with Bonferroni correction, n = 5–6 animals (a, b) and 7–8 (e) per group. *p < 0.05, **p < 0.01, ***p < 0.001. Scale bars for c 200 µm, for d 1 mm
Fig. 9
Fig. 9
Selective cell recruitment and spatial alignment of cells and ECM induces EO inside the scaffold. Schematic illustration of the scaffold architecture-induced tissue organization and resulting ossification in the bone defect. In scaffold A, CD146+ cells are preferentially recruited from the bone marrow cavity while vessel ingrowth from the bone marrow is rare in all groups (see Supplementary Fig. 5c). Due to the pore orientation, CD146+ cell migration and vessel ingrowth from surrounding tissues is limited. Together, this creates a pro-chondrogenic condition with a high ratio of CD146+ cells per vessel. The pore architecture forces cells and ECM to align in the direction of the bone axis. At the front of EO, osteochondral progenitor cells (CD146+) differentiate into chondrocytes. Resulting from the linear alignment, vacated chondrocyte lacunae at the chondro-osseous junction form hollow channels that allow the ingrowth of capillaries (dark red arrow) stimulating terminal chondrocyte hypertrophy and migration of osteoblasts and osteoclasts remodeling the mineralized fibrocartilage matrix. Fragmented pore walls in scaffold R lead to increased invasion of vessels from surrounding tissues (muscle, periosteum), creating a less favorable environment for chondrogenic differentiation. This causes a starvation of the endochondral process. In scaffold B, perpendicular pore walls hinder migration of cells from the bone marrow space. Under these conditions, as in the empty bone defect, EO does not take place and bone formation is limited to intramembranous ossification

Similar articles

Cited by

References

    1. Emans P. J. C., M. M. J., van Rhijn, L. W., Welting, T. J. M. in Tissue Regeneration—FromBasic Biology to Clinical Application (eds Davies J.) (InTech, 2012).
    1. Kolk A, et al. Current trends and future perspectives of bone substitute materials—from space holders to innovative biomaterials. J. Cranio Maxill Surg. 2012;40:706–718. doi: 10.1016/j.jcms.2012.01.002. - DOI - PubMed
    1. Stewart, S., Bryant, S. J., Ahn, J., Hankenson, K. D. in Translational Regenerative Medicine (eds Atala, A. & Allickson, J.) (Elsevier Academic Press, 2014).
    1. Thompson Emmet M., Matsiko Amos, Farrell Eric, Kelly Daniel J., O'Brien Fergal J. Recapitulating endochondral ossification: a promising route toin vivobone regeneration. Journal of Tissue Engineering and Regenerative Medicine. 2014;9(8):889–902. doi: 10.1002/term.1918. - DOI - PubMed
    1. Gawlitta D, et al. Modulating endochondral ossification of multipotent stromal cells for bone regeneration. Tissue Eng. Part B Rev. 2010;16:385–395. doi: 10.1089/ten.teb.2009.0712. - DOI - PubMed

Publication types