. 2019 Jan;29(1):8-22.
doi: 10.1038/s41422-018-0103-x. Epub 2018 Oct 25.

Expansion and differentiation of human hepatocyte-derived liver progenitor-like cells and their use for the study of hepatotropic pathogens

Affiliations

Expansion and differentiation of human hepatocyte-derived liver progenitor-like cells and their use for the study of hepatotropic pathogens

Gong-Bo Fu et al. Cell Res. 2019 Jan.

Abstract

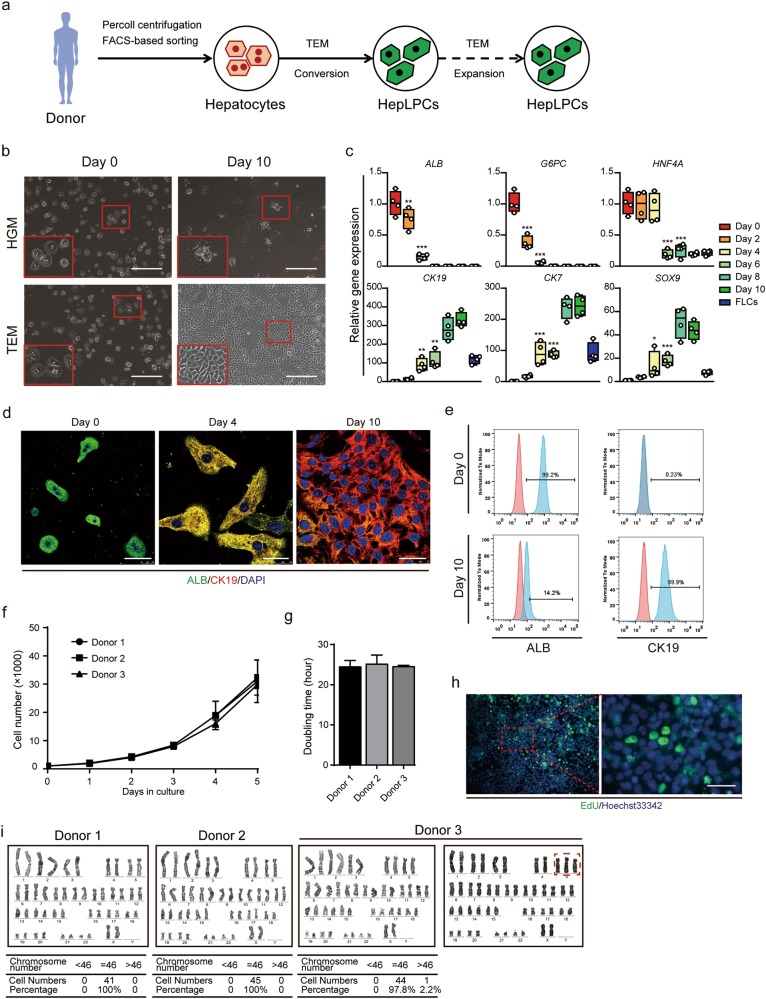
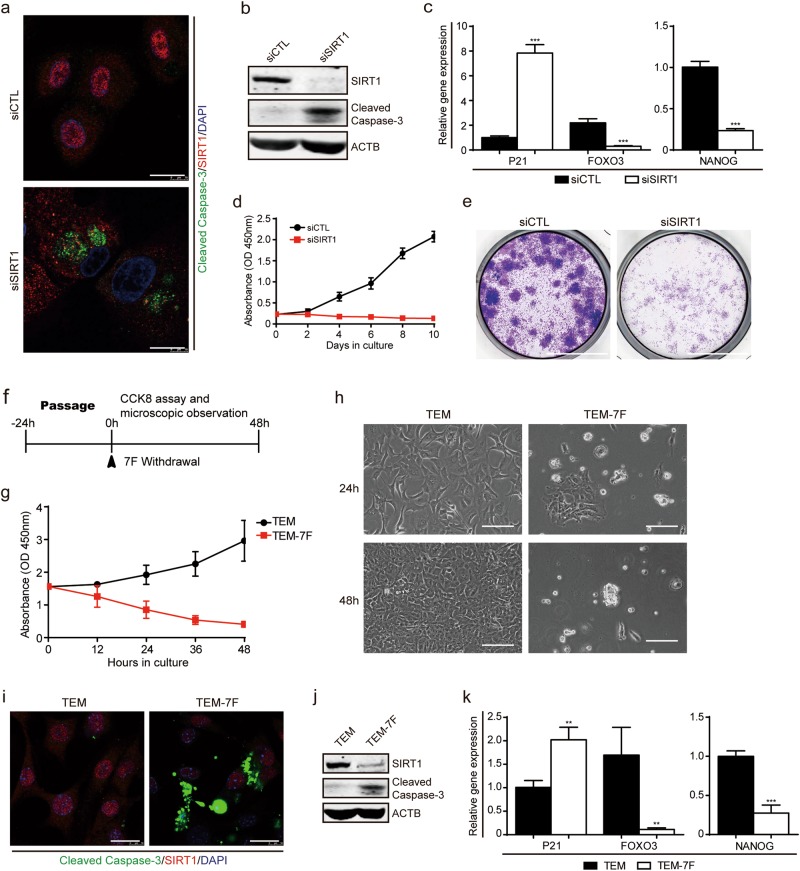
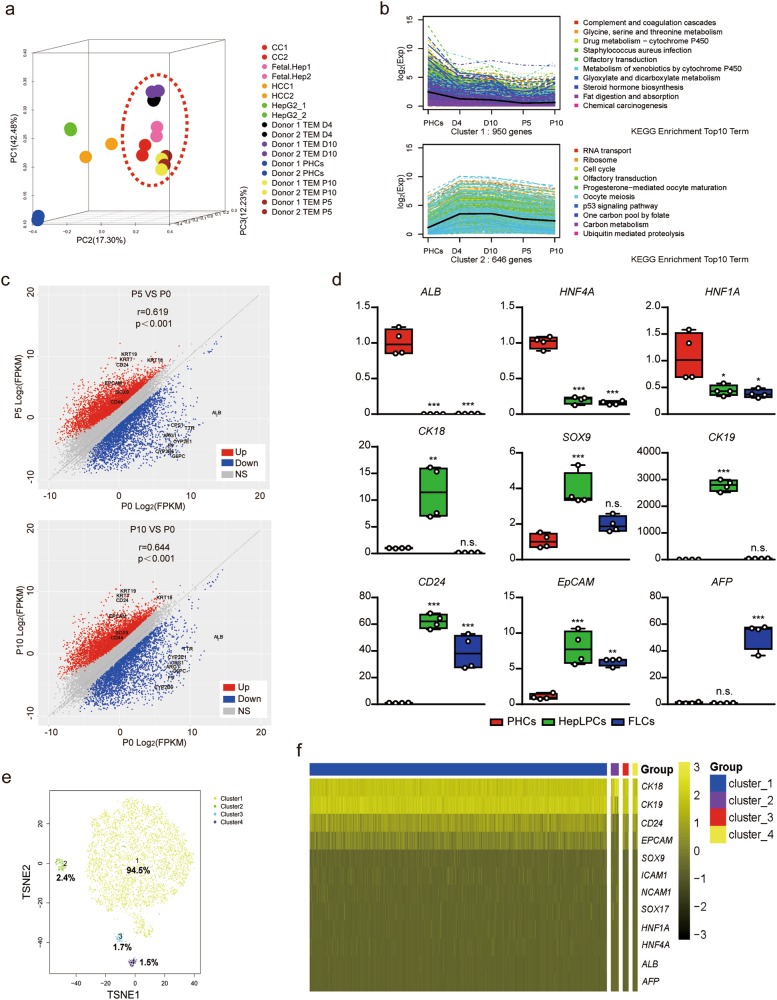
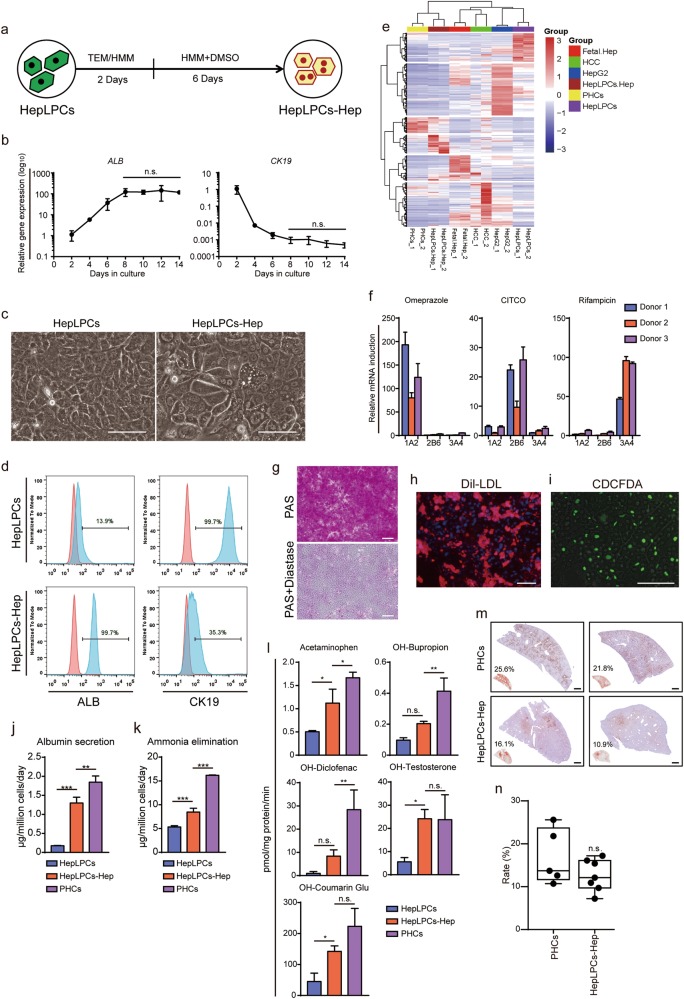
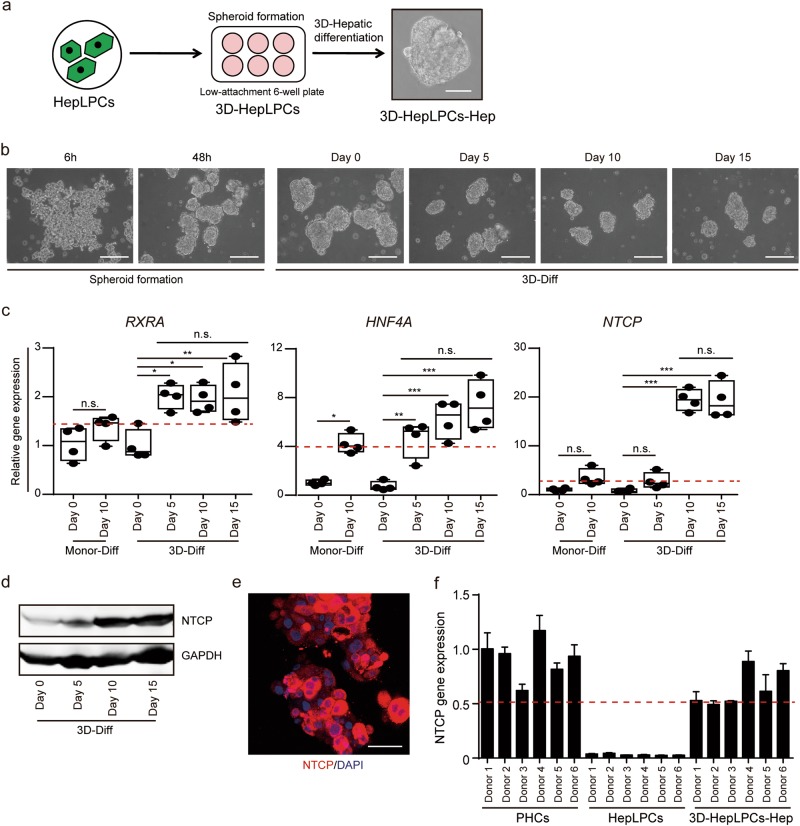
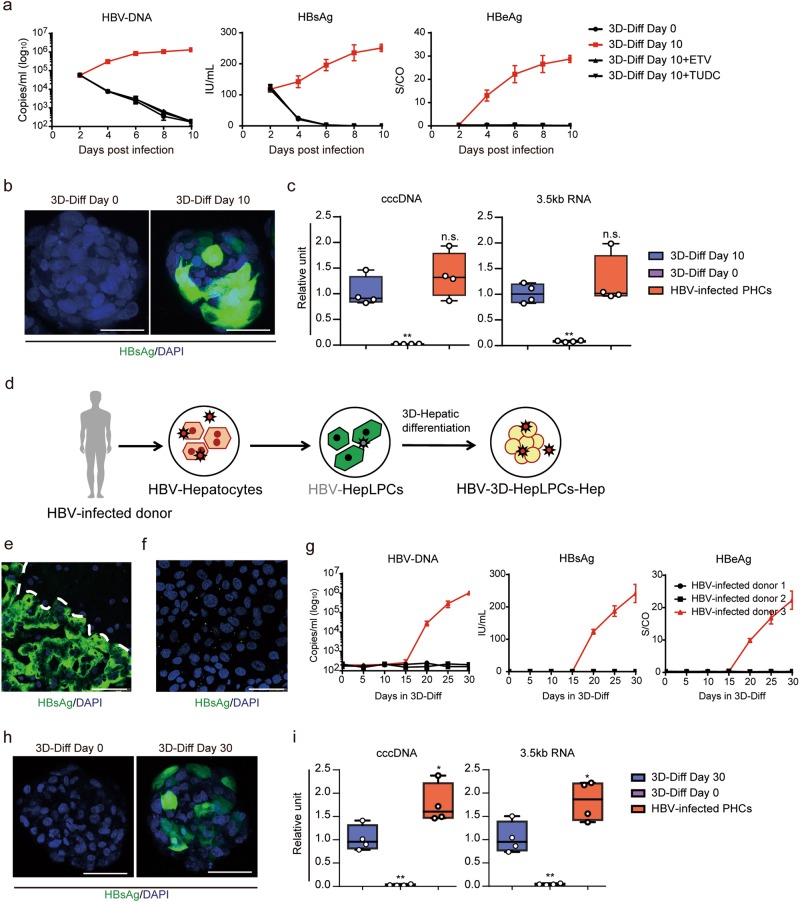
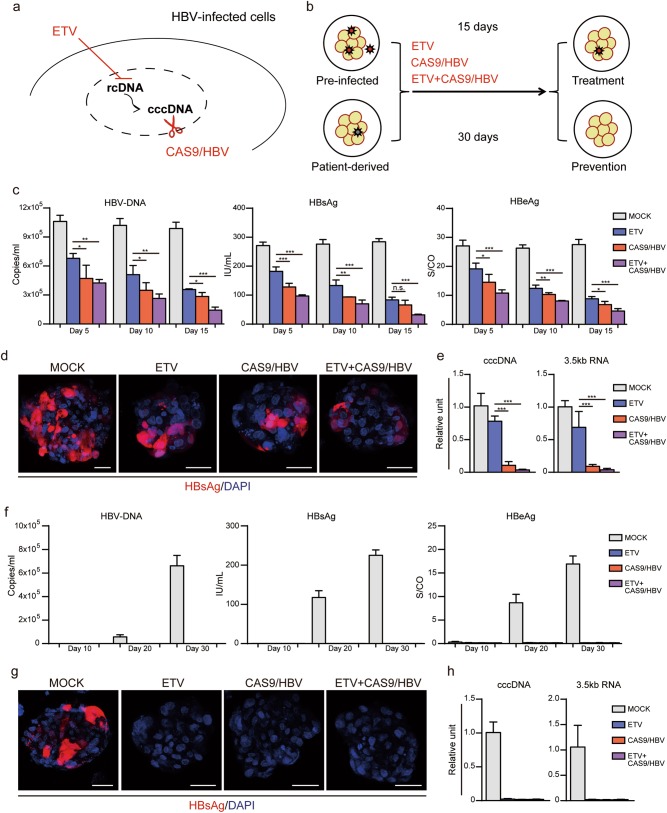
The study of pathophysiological mechanisms in human liver disease has been constrained by the inability to expand primary hepatocytes in vitro while maintaining proliferative capacity and metabolic function. We and others have previously shown that mouse mature hepatocytes can be converted to liver progenitor-like cells in vitro with defined chemical factors. Here we describe a protocol achieving efficient conversion of human primary hepatocytes into liver progenitor-like cells (HepLPCs) through delivery of developmentally relevant cues, including NAD + -dependent deacetylase SIRT1 signaling. These HepLPCs could be expanded significantly during in vitro passage. The expanded cells can readily be converted back into metabolically functional hepatocytes in vitro and upon transplantation in vivo. Under three-dimensional culture conditions, differentiated cells generated from HepLPCs regained the ability to support infection or reactivation of hepatitis B virus (HBV). Our work demonstrates the utility of the conversion between hepatocyte and liver progenitor-like cells for studying HBV biology and antiviral therapies. These findings will facilitate the study of liver diseases and regenerative medicine.


Conflict of interest statement

The authors declare no competing interests.

Figures

Fig. 1
Fig. 1
Generation of human hepatocytes-derived liver progenitor-like cells in vitro. a Overview of the protocol used to convert PHCs into HepLPCs. b Light microscopy images of PHCs cultured in HGM or TEM at day 0 and day 10. Scale bars, 200 µm. c QPCR analyses for the expression of the indicated genes during TEM culture from day 0 to day 10. FLCs, fetal liver cells, 5 gestational weeks (one-way ANOVA with Dunnett correction for multiple comparisons, n = 4 donors, *P < 0.05, **P < 0.01, ***P < 0.001). d Immunofluorescence analyses demonstrating the expression of ALB and CK19. Scale bars, 50 µm. e Flow cytometric analysis showing the proportion of ALB or CK19 positive-cells in the populations. Blue, positive-cells; red, negative controls. f Growth curves illustrate the number of cells counted per well at different time points. Results expressed as mean ± s.d. of three independent cultures derived from three donors. g Doubling time calculated for three donors. Error bars represent s.d.; n = 3. h Edu incorporation is detected at passage 10. Scale bar, 50 µm. i Representative karyotype images of three independently established HepLPCs. Two lines maintained normal diploid karyotypes, whereas the third was partly triploid for Chromosome 5
Fig. 2
Fig. 2
SIRT1 is essential for hepatocyte-to-LPC conversion and expansion. a Immunofluorescence images of SIRT1 and cleaved-caspase-3 at day 4 in cells transfected with control siRNA (siCTL) or siRNA-targeting SIRT1 (siSIRT1). Scale bars, 20 μm. b Western blot analysis of SIRT1 and cleaved-caspase-3 expression as in (a). c QPCR analyses for the expression of P21, FOXO3 and NANOG in cells transfected with siCTL or siSIRT1. Error bars represent s.d.; n = 3 donors (two-tailed unpaired t-test, ***P < 0.001). d CCK-8 analyses demonstrating suppression of cell proliferation in the presence of siSIRT1. Error bars represent s.d.; n = 5 technical replicates from one donor. e Light microscopy images show a reduction in clone formation following inhibition of SIRT1 by crystal violet staining. Scale bars, 10 mm. f Schematic of the 7 factors (7 F) withdrawal assay during passage. g CCK-8 analyses demonstrating suppression of cell proliferation in the absence of the 7 F within 48 h. Error bars represent s.d.; n = 5 technical replicates from one donor. h Light microscopy shows reduced cell proliferation in response to the withdrawal of the 7 F at 24 h and 48 h. Scale bars, 100 µm. i Immunofluorescence images of SIRT1 and cleaved-caspase-3 in HepLPCs cultured in TEM or TEM-7F at 24 h. Scale bars, 20μm. j Western blot analysis of SIRT1 and cleaved caspase-3 expression as in (i). k QPCR analyses for the expression of P21, FOXO3 and NANOG as in (i). Error bars represent s.d.; n = 3 donors (two-tailed unpaired t-test, **P < 0.01, ***P < 0.001)
Fig. 3
Fig. 3
Characterization of HepLPCs. a Principal component analysis of PHCs (freshly isolated), hepatic hepatoma cell lines (HepG2), hepatocellular carcinoma (HCC), cholangiocarcinoma (CC), fetal hepatocytes (Fetal.Hep) and HepLPCs at day 4, day 10, passage 5 and passage 10 in TEM from two donors based on global gene expression profile. b K-mean analysis of hepatic function related genes (top) and cell cycle related genes (bottom) in PHCs and cells at day 4, day 10, passage 5 and passage 10 in TEM. c Correlation scatter plot show the changes of liver progenitor related genes by KEGG enriched analysis. Passage 5 or passage 10 versus PHCs (P0). d QPCR analyses for the expression of liver progenitor related genes, PHCs were freshly isolated (one-way ANOVA with Dunnett correction for multiple comparisons, n = 4 donors, n.s., non-significant, *P < 0.05, **P < 0.01, ***P < 0.001). e t-SNE projection of all 7459 individual HepLPCs based on K-means clustering, different colors represent different subgroups. f Heatmap of liver progenitor- and hepatic lineage-related genes in different subgroups
Fig. 4
Fig. 4
Efficient hepatic differentiation of HepLPCs in vitro. a Schematic of the hepatic-differentiation protocol. TEM/HMM, mixed by 1:1. b QPCR analyses for the expression ALB and CK19 during hepatic-differentiation of HepLPCs (passage 5) from day 2 to day 14. Error bars represent s.d.; n = 3 donors (one-way ANOVA with Tukey correction for multiple comparisons, n.s., non-significant). c Light microscopy images of HepLPCs versus HepLPCs-Hep. Scale bars, 50 μm. d Flow cytometric analysis showing the proportion of ALB and CK19 positive-cells in HepLPCs or HepLPCs-Hep from donor 4 passage 5. Blue, positive-cells; red, negative controls. (e) Euclidean hierarchical clustering of HepG2, HCC, HepLPCs, HepLPCs-Hep and PHCs using differentially expressed genes ( ≥2-fold changes and P < 0.001) in HepLPCs versus HepLPCs-Hep. f Induction of CYP450 expression in HepLPCs-Hep from three donors (passage 5) in response to stimulation with omeprazole, CITCO, and rifampicin for 72 h. 1A2, CYP1A2; 2B6, CYP2B6; 3A4, CYP3A4. Expression normalized to DMSO-treated controls. Error bars represent s.d.; n = 3 technical replicates. g PAS staining with or without diastase, h DiI-LDL uptake and i CDCFDA staining of HepLPCs-Hep. Scale bars, 100 µm. j Albumin production and k ammonia elimination during 24 h measured in supernatant, PHCs were freshly isolated. Error bars represent s.d.; n = 3 donors (one-way ANOVA with Tukey correction for multiple comparisons, **P < 0.01, ***P < 0.001). l CYP metabolic activities of HepLPCs, HepLPCs-Hep (passage 5) and PHCs (freshly isolated). The metabolic products of Acetaminophen, OH-Bupropion, OH-Diclofenac, OH-Testosterone and OH-Coumarin Glu determined by liquid chromatography-tandem mass spectrometry according to standard curves. Error bars represent s.d.; n = 3 donors (one-way ANOVA with Tukey correction for multiple comparisons, n.s., non-significant, *P < 0.05, **P < 0.01). m Representative immunohistochemical staining of hALB of human chimeric mouse liver tissues, PHCs were freshly isolated. Scale bars, 400 µm. n Quantification of the repopulation efficiency estimated by hALB-positive foci. No significant difference is noticed between PHCs and HepLPCs-Hep (passage 5). Error bars represent s.d.; n.s., non-significant
Fig. 5
Fig. 5
Expression of proviral host factors in 3D-HepLPCs-Hep. a Overview of the protocol for formation and differentiation of 3D-HepLPCs. Scale bar, 50 μm. b Time course of 3D spheroid formation and hepatic differentiation. 3D-Diff, 3D spheroid differentiation. Scale bars, 200 µm. c QPCR analyses for the expression of RXRA, HNF4A and NTCP in HepLPCs (passage 5) with monolayer or 3D differentiation. (one-way ANOVA with Tukey correction for multiple comparisons, n = 4 donors, n.s., non-significant, *P < 0.05, **P < 0.01, ***P < 0.001). d Western blot analysis of NTCP expression in 3D-HepLPCs with differentiation from day 0 to day 15. e Immunofluorescence images of NTCP in HepLPCs with 3D spheroid differentiation. Scale bar, 25 μm. f QPCR analyses for the expression of NTCP in PHCs (collected overnight after seeding as a monolayer), HepLPCs and 3D-HepLPCs-Hep from six donors passage 5. Error bars represent s.d.; n = 3 technical replicates
Fig. 6
Fig. 6
HBV infection and reactivation in 3D-HepLPCs-Hep. a Extracellular HBV-DNA and secreted viral antigens were monitored from 2 to 10 days post infection in 3D-HepLPCs treated with ETV or TUDC. Error bars represent s.d.; n = 4 donors. b HBsAg staining in 3D-HepLPCs with or without differentiation at 8 days post infection. Scale bars, 25 μm. c QPCR analyses for the expression of cccDNA and 3.5 kb RNA in 3D-HepLPCs with or without differentiation versus HBV-infected PHCs (10 days post infection, n = 4 donors, one-way ANOVA with Dunnett correction for multiple comparisons, n.s., non-significant, **P < 0.01). d Schematic of HBV reactivation in 3D-HepLPCs-Hep derived from HBV-infected donor. e HBsAg staining of the liver tissue collected from HBV-infected donor and f disappearance after 10-day culture in TEM. Scale bars, 50 μm. g Extracellular HBV-DNA and secreted viral antigens are monitored from day 0 to day 30 in HMM + DMSO in 3D-HepLPCs derived from three HBV-infected donors, n = 3 technical replicates. h HBsAg staining of patient-derived 3D-HepLPCs with or without 30-day differentiation. Scale bars, 25 μm. i QPCR analyses for the expression of cccDNA and 3.5 kb RNA in patient-derived 3D-HepLPCs with or without 30-day differentiation versus HBV-infected PHCs (10 days post infection, n = 4 technical replicates, one-way ANOVA with Dunnett correction for multiple comparisons, *P < 0.05, **P < 0.01)
Fig. 7
Fig. 7
Anti-HBV studies in 3D spheroid models. a Schematic of HBV life cycle indicating the presumed mechanism of action of ETV and CAS9/HBV. b The antiviral drugs used in pre-infected or patient-derived 3D spheroid models. ce The makers’ expression of HBV in pre-infected 3D spheroid models. c Extracellular HBV-DNA and secreted viral antigens were monitored after drug treatment in pre-infected 3D spheroid models at different time points. Error bars represent s.d. (one-way ANOVA with Dunnett correction for multiple comparisons, n = 4 technical replicates, n.s., non-significant, *P < 0.05, **P < 0.01, ***P < 0.001). d HBsAg staining of pre-infected 3D spheroid models treated with the drugs for 15 days. Scale bars, 25 μm. e QPCR analyses for the expression of cccDNA and 3.5 kb RNA in pre-infected 3D spheroid models treated with the drugs. Error bars represent s.d. (one-way ANOVA with Dunnett correction for multiple comparisons, n = 4 technical replicates, *** P < 0.001). fh The makers’ expression of HBV in patient-derived 3D spheroid models. f Extracellular HBV-DNA and secreted viral antigens were monitored after drug treatment in patient-derived 3D spheroid models at day 10, day 20 and day 30. Error bars represent s.d.; n = 4 technical replicates. g HBsAg staining of patient-derived 3D spheroid models treated with the drugs for 30 days. Scale bars, 25 μm. h QPCR analyses for the expression of cccDNA and 3.5 kb RNA in patient-derived 3D spheroid models treated with the drugs. Error bars represent s.d.; n = 4 technical replicates

References

    1. Junge N., Sharma A. D. & Ott M. About cytokeratin 19 and the drivers of liver regeneration. J. Hepatol68, 1 (2017). - PubMed
    1. Michalopoulos GK, Khan Z. Liver stem cells: experimental findings and implications for human liver disease. Gastroenterology. 2015;149:876–882. doi: 10.1053/j.gastro.2015.08.004. - DOI - PMC - PubMed
    1. Tarlow BD, et al. Bipotential adult liver progenitors are derived from chronically injured mature hepatocytes. Cell Stem Cell. 2014;15:605–618. doi: 10.1016/j.stem.2014.09.008. - DOI - PMC - PubMed
    1. Lu WY, et al. Hepatic progenitor cells of biliary origin with liver repopulation capacity. Nat. Cell Biol. 2015;17:971–983. doi: 10.1038/ncb3203. - DOI - PMC - PubMed
    1. Raven A, et al. Cholangiocytes act as facultative liver stem cells during impaired hepatocyte regeneration. Nature. 2017;547:350–354. doi: 10.1038/nature23015. - DOI - PMC - PubMed

Publication types