. 2018 Oct 25;9(1):4440.
doi: 10.1038/s41467-018-06935-2.

Improved methods for marking active neuron populations

Affiliations

Improved methods for marking active neuron populations

Benjamien Moeyaert et al. Nat Commun. .

Abstract

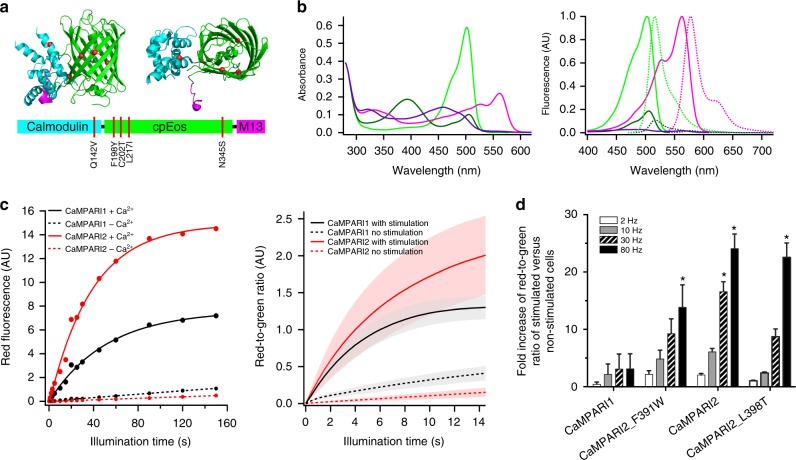
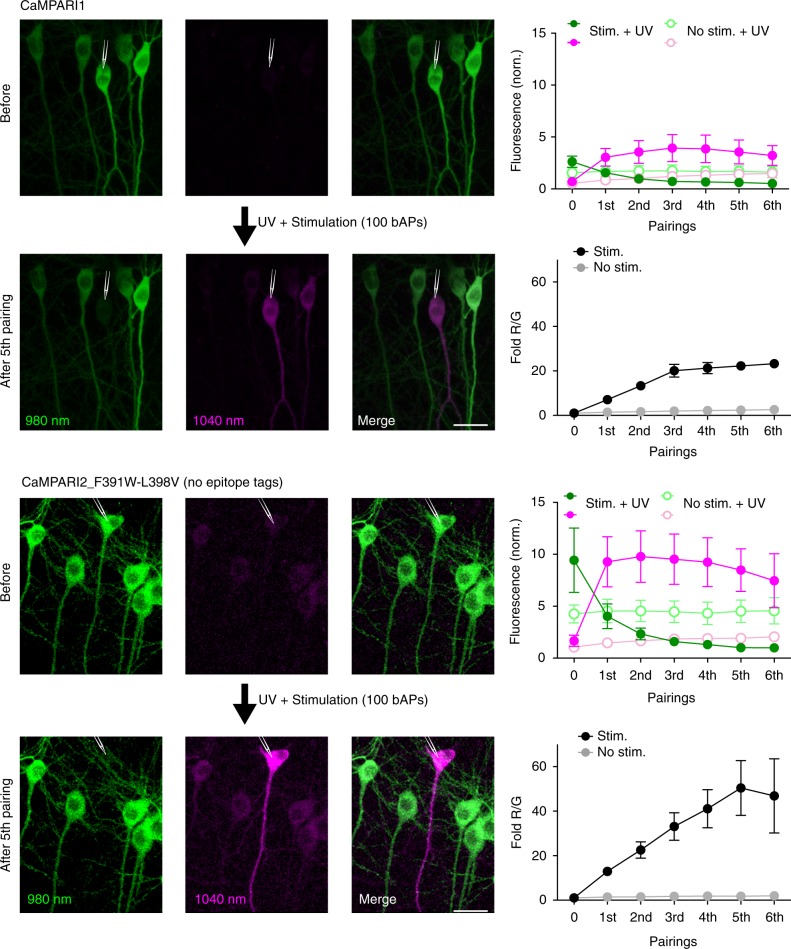
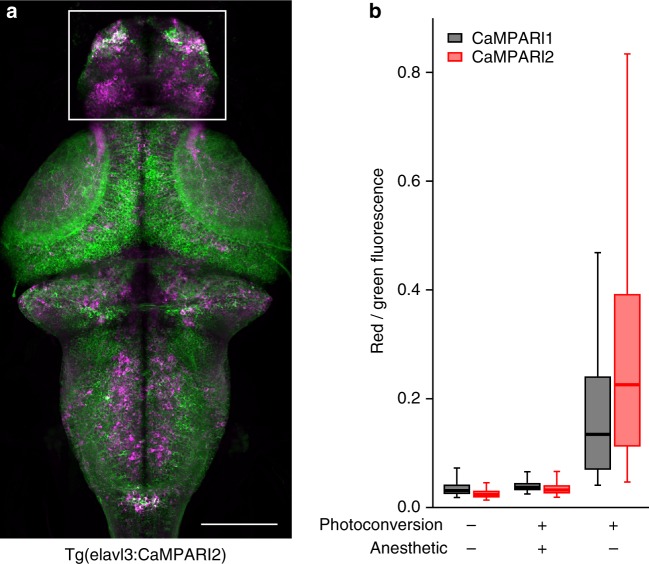
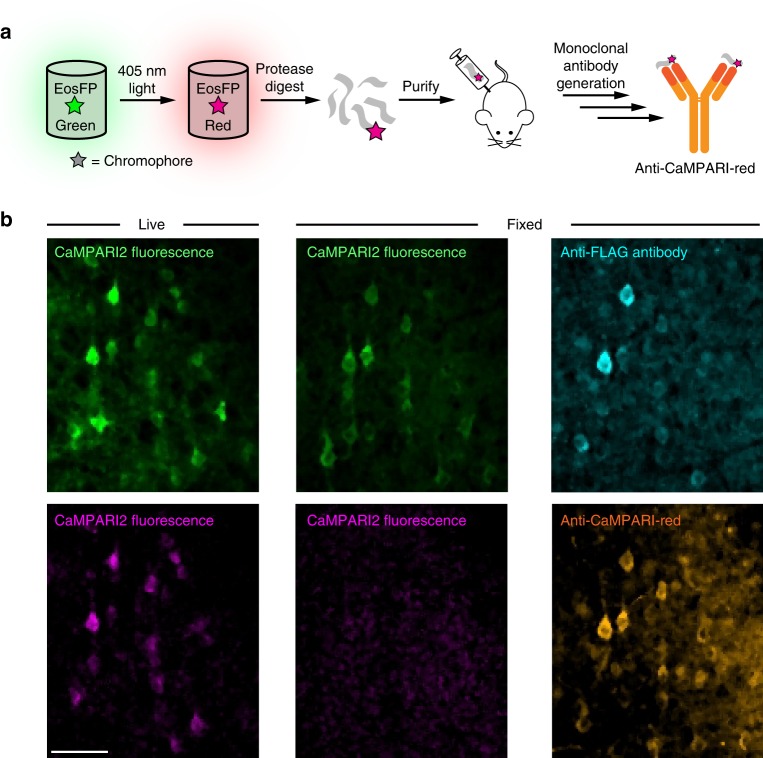
Marking functionally distinct neuronal ensembles with high spatiotemporal resolution is a key challenge in systems neuroscience. We recently introduced CaMPARI, an engineered fluorescent protein whose green-to-red photoconversion depends on simultaneous light exposure and elevated calcium, which enabled marking active neuronal populations with single-cell and subsecond resolution. However, CaMPARI (CaMPARI1) has several drawbacks, including background photoconversion in low calcium, slow kinetics and reduced fluorescence after chemical fixation. In this work, we develop CaMPARI2, an improved sensor with brighter green and red fluorescence, faster calcium unbinding kinetics and decreased photoconversion in low calcium conditions. We demonstrate the improved performance of CaMPARI2 in mammalian neurons and in vivo in larval zebrafish brain and mouse visual cortex. Additionally, we herein develop an immunohistochemical detection method for specific labeling of the photoconverted red form of CaMPARI. The anti-CaMPARI-red antibody provides strong labeling that is selective for photoconverted CaMPARI in activated neurons in rodent brain tissue.


Conflict of interest statement

E.R.S. is an inventor on US patent number 9,518,996 and US patent application 15/335,707, which may cover CaMPARI sequences described in this paper. The remaining authors declare no competing interests.

Figures

Fig. 1
Fig. 1
In vitro characterization of CaMPARI2. a Primary (bottom) and tertiary (top) structures of CaMPARI2. Mutations relative to CaMPARI1_W391F-V398L are shown in red. Two orthogonal views of the same CaMPARI crystal structure (PDB ID 4OY4 [10.2210/pdb4OY4/pdb] are shown. b Absorption (left) and fluorescence (right) excitation (full line) and emission (dotted line) spectra of CaMPARI2. Green and magenta spectra represent the green and red forms of CaMPARI; bright and dark lines represent the calcium-free and calcium-saturated states. c Photoconversion timecourse showing the red fluorescence of CaMPARI1 (black) and CaMPARI2 (red) as a function of exposure to 405 nm light. Left: photoconversion of purified CaMPARI protein in the presence (solid lines) or absence (dashed lines) of calcium. Right: photoconversion of primary rat hippocampal neurons with (solid lines) or without (dashed lines) 80 Hz stimulation. d Fold increase of the red-to-green ratio of CaMPARI variant-expressing neurons after 2 s of photoconversion during different electrical stimulation frequencies relative to no stimulation. Error bars are standard deviation, n = 3, asterisks denote values significantly differing from the corresponding CaMPARI1 value (p < 0.001, Dunnett’s multiple comparisons test)
Fig. 2
Fig. 2
Brightness and photoconversion of CaMPARI1 and CaMPARI2. Two-photon images of CaMPARI1 and CaMPARI2_F391W-L398V (no epitope tags) expressed in CA1 neurons of rat hippocampal slice cultures before and after pairing of stimulation (100 bAPs at 100 Hz) with UV light (2 s, 16 mW mm−2). Two lasers were simultaneously employed to acquire images of the green (980 nm) and red species (1040 nm) of the CaMPARI variants. A single cell, denoted by a pipette drawing, is patched and stimulated during the UV illumination. Green and red fluorescence is quantified along with the fold R/G in both stimulated (CaMPARI1 n = 5; CaMPARI2 n = 6) and unstimulated neighboring neurons (CaMPARI1 n = 5; CaMPARI2 n = 14) as a function of the number of pairings. Error bars are SEM. Note that fluorescence intensity is normalized to the laser power (see Methods), showing the increased brightness of CaMPARI2. Scale bars are 25 µm
Fig. 3
Fig. 3
In vivo characterization of CaMPARI2 in zebrafish. a Representative z-projection from a confocal stack from a 6-dpf larval transgenic pan-neuronal CaMPARI2 zebrafish brain photoconverted for 30 s during free swimming. b Boxplots represent the distribution of red-to-green fluorescence signals from individual neurons (between 1800 and 6000 cells per condition, representing 2–4 fish (Supplementary Fig. 9, 10). Data are measured from neurons in the forebrain (white box in a) following photoconversion of either freely swimming or tricaine-anesthetized larval zebrafish. Box represents 1st, 2nd, and 3rd quartile, while whiskers represent the 5th and 95th percentile. Scale bar is 100 µm
Fig. 4
Fig. 4
CaMPARI2 activity and PC in mouse primary visual cortex. a Schematic of the experimental setup (left). Two-photon fluorescence signal from cortical layer 2/3 neurons in V1 after PC (right). b Changes in fluorescence signal from four example cells marked in a. Cell numbers 1–2 are PC-tuned and have high OSI (0.8 and 0.92, respectively), cell number 3 is responsive and broadly tuned (OSI = 0.22), and cell number 4 is responsive and not PC-tuned (OSI = 0.96). c Correlation between peak ΔF/F0 for the northward moving grating stimulus and the red-to-green ratio for individual responsive cells expressing CaMPARI2. Cells were grouped into four categories: non-responsive (not significantly responsive cells, gray dots), broadly tuned (significantly responsive and OSI < 0.5, cyan), PC-tuned (OSI > 0.5 and significant response to northward moving grating stimulus, magenta), and not PC-tuned (OSI > 0.5 and no significant response to northward moving grating stimulus, green). d Comparison of red-to-green ratio distribution of the four groups mentioned in c. PC efficiency was higher for PC-tuned cells, leading to a significant increase in red-to-green ratio. *p < 0.05, ***p < 0.001 (Wilcoxon Rank-Sum Test). Error bars indicate the standard error. Scale bar is 40 µm
Fig. 5
Fig. 5
Anti-CaMPARI-red antibody. a Schematic representation of the protocol used to generate the anti-CaMPARI-red monoclonal antibody. b Green (top) and red (bottom) endogenous CaMPARI2 fluorescence (left and middle columns) in mouse brain tissue imaged before (left column) and after (middle column) chemical fixation with paraformaldehyde. The right column shows the same region of fixed tissue after antibody staining with anti-FLAG antibody for total CaMPARI (top, cyan) and anti-CaMPARI-red antibody (bottom, orange). Note that following chemical fixation much of the red CaMPARI fluorescence was lost but was recovered with the anti-CaMPARI-red antibody staining. Scale bar is 50 µm
Fig. 6
Fig. 6
Comparison between endogenous fluorescence and anti-CaMPARI-red antibody stain. HeLa cells (a) and rat brain (b) were immunostained with anti-CaMPARI2-red and anti-FLAG antibody as described in Supplementary Methods. Plots of endogenous fluorescence vs. the antibody signal show a linear relationship (green and magenta scatterplots). The black scatterplots show the correlation between the endogenous red-to-green ratio and the anti-CaMPARI-red-to-anti-FLAG ratio. Scale bars are 100 or 25 µm (insets)

Comment in

  • Highlighting active neurons.
    Vogt N. Vogt N. Nat Methods. 2019 Jan;16(1):25. doi: 10.1038/s41592-018-0281-y. Nat Methods. 2019. PMID: 30573825 No abstract available.

References

    1. Guzowski JF, Setlow B, Wagner EK, McGaugh JL. Experience-dependent gene expression in the rat hippocampus after spatial learning: a comparison of the immediate-early genes Arc, c-fos, and zif268. J. Neurosci. 2001;21:5089–5098. doi: 10.1523/JNEUROSCI.21-14-05089.2001. - DOI - PMC - PubMed
    1. Guenthner CJ, Miyamichi K, Yang HH, Heller HC, Luo L. Permanent genetic access to transiently active neurons via TRAP: targeted recombination in active populations. Neuron. 2013;78:773–784. doi: 10.1016/j.neuron.2013.03.025. - DOI - PMC - PubMed
    1. Koya E, et al. Targeted disruption of cocaine-activated nucleus accumbens neurons prevents context-specific sensitization. Nat. Neurosci. 2009;12:1069–1073. doi: 10.1038/nn.2364. - DOI - PMC - PubMed
    1. Reijmers LG, Perkins BL, Matsuo N, Mayford M. Localization of a stable neural correlate of associative memory. Science. 2007;317:1230–1233. doi: 10.1126/science.1143839. - DOI - PubMed
    1. Denny CA, et al. Hippocampal memory traces are differentially modulated by experience, time, and adult neurogenesis. Neuron. 2014;83:189–201. doi: 10.1016/j.neuron.2014.05.018. - DOI - PMC - PubMed

Publication types