. 2018 Oct 25;9(1):4450.
doi: 10.1038/s41467-018-06948-x.

Adhesion to nanofibers drives cell membrane remodeling through one-dimensional wetting

Affiliations

Adhesion to nanofibers drives cell membrane remodeling through one-dimensional wetting

Arthur Charles-Orszag et al. Nat Commun. .

Abstract

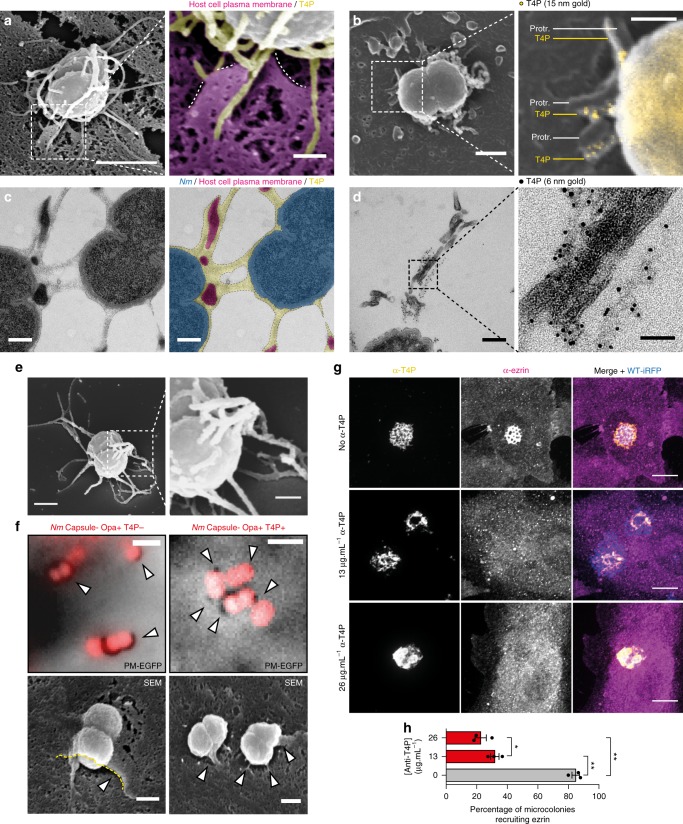
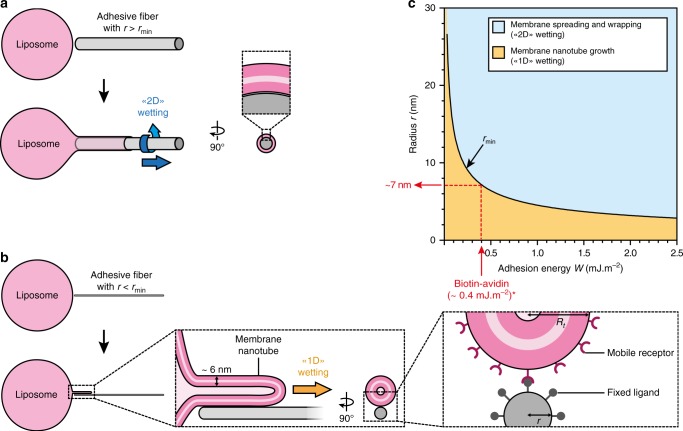
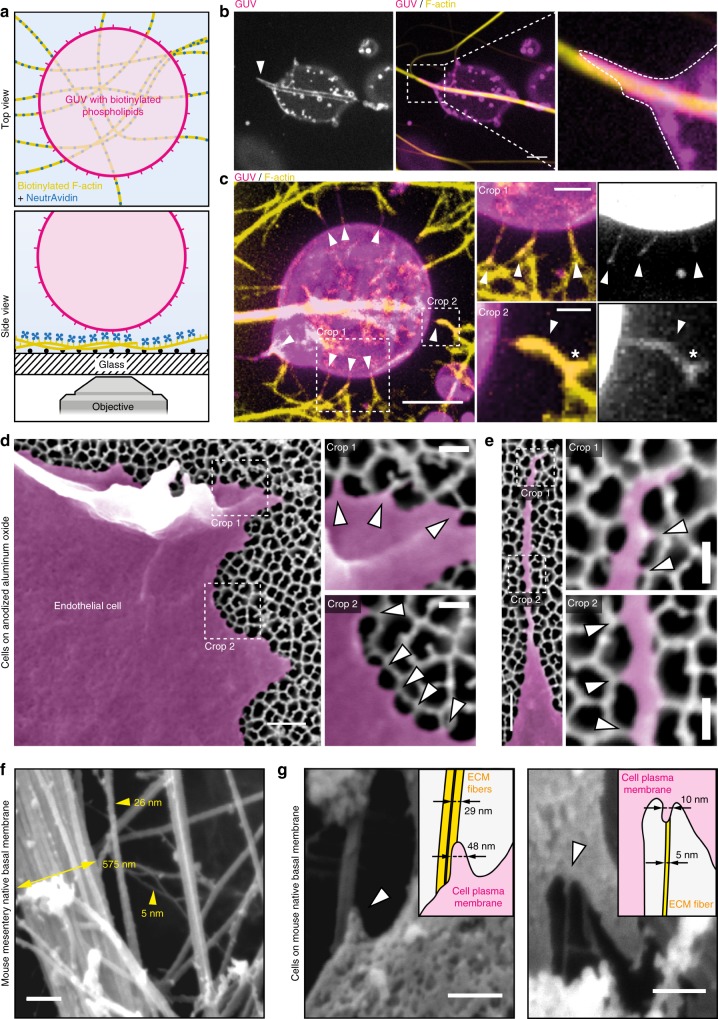
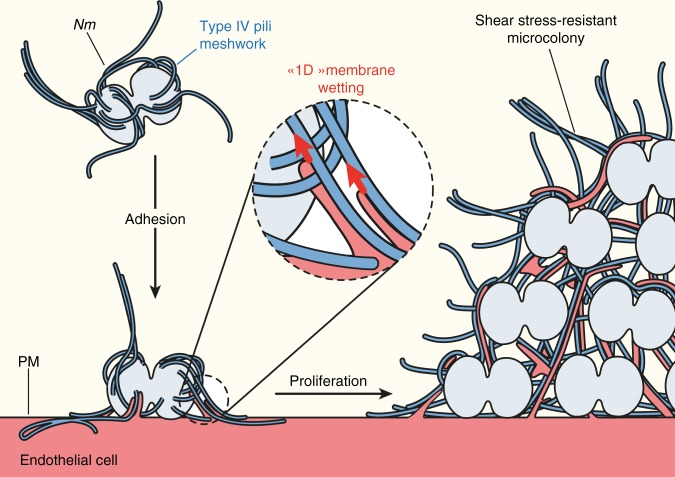
The shape of cellular membranes is highly regulated by a set of conserved mechanisms that can be manipulated by bacterial pathogens to infect cells. Remodeling of the plasma membrane of endothelial cells by the bacterium Neisseria meningitidis is thought to be essential during the blood phase of meningococcal infection, but the underlying mechanisms are unclear. Here we show that plasma membrane remodeling occurs independently of F-actin, along meningococcal type IV pili fibers, by a physical mechanism that we term 'one-dimensional' membrane wetting. We provide a theoretical model that describes the physical basis of one-dimensional wetting and show that this mechanism occurs in model membranes interacting with nanofibers, and in human cells interacting with extracellular matrix meshworks. We propose one-dimensional wetting as a new general principle driving the interaction of cells with their environment at the nanoscale that is diverted by meningococci during infection.


Conflict of interest statement

The authors declare no competing interests.

Figures

Fig. 1
Fig. 1
Plasma membrane remodeling by Nm occurs in vivo, and is initiated at the level of the individual bacterium in vitro. a Histoimmunolabeling of human blood vessels in a mouse after 3 h of infection with N. meningitidis(Nm)-GFP showing plasma membrane protrusions co-localizing with T4P between aggregated bacteria (arrowheads). Scale bar, 10 μm. Representative of n = 2 mice. b Scanning electron micrograph of an endothelial cell infected for 10 min. Arrowheads show plasma membrane protrusions. Scale bar, 500 nm. Representative of n = 2 independent experiments performed in duplicate. c Oblique illumination live imaging of an endothelial cell expressing the membrane marker GFP-F (GFP-Farnesyl, inverted contrast) infected by individual Nm-iRFP. Arrowheads show dynamic plasma membrane protrusions. Scale bar, 2 μm. n > 10 independent experiments. d Types of plasma membrane protrusions observed in high speed oblique illumination imaging. e Frequency distribution (gray bars) and Gaussian fit (red line) of the number of protrusions per bacterium. f Frequency distribution of the number of plasma membrane protrusions with short observed lifetimes. gi Plasma membrane protrusions on-rate (kon), off-rate (koff) and mean lifetime. Gray bars and error bars represent the mean ± SEM over 57 bacteria in six independent experiments. Dots represent the mean values of 4–14 bacteria in each experiment. jl Plasma membrane protrusions are still induced by Nm in cytochalasin D-treated cells but have shorter lifetimes. Scale bars, 2 μm. Bars and error bars in graphs represent the mean ± SEM in three independent experiments. Dots represent the mean of each individual experiment. The total number of bacteria analyzed was 26 and 15 in non-treated and treated cells, respectively. mp Mutant bacteria deficient for pilus retraction trigger plasma membrane protrusions with altered morphologies and that are no longer dynamic. Scale bars, 2 μm. Bars and error bars in graphs represent the mean ± SEM of three independent experiments. Dots represent the mean of each individual experiment. The total number of bacteria analyzed was 31 WT-iRFP and 28 pilT-iRFP
Fig. 2
Fig. 2
The morphology of plasma membrane protrusions is dictated by the fiber-like morphology of T4P. a Scanning electron micrograph of an endothelial cell after 10 min infection and stabilization of the T4P with a monoclonal antibody. Colorized crop shows plasma membrane protrusions (magenta, dotted lined) attached alongside T4P fibers (yellow). Scale bars, 1 μm and 200 nm. n = 2 independent experiments performed in duplicate. b Same experiment after immunogold labeling of T4P. Protr., protrusions. Scale bars, 500 nm and 200 nm. n = 2 independent experiments performed in duplicate. c Transmission electron micrograph of a microcolony of Nm after high pressure freezing and freeze substitution, showing plasma membrane protrusions embedded in a meshwork of T4P. Scale bars, 200 nm. Representative of multiple microcolonies in n = 1 experiment. d Same experiment after immunogold labeling of T4P. Scale bars, 200 nm and 50 nm. Representative of multiple microcolonies in n = 1 experiment. e Scanning electron micrograph of the meshwork of T4P produced by an individual bacterium in culture. Scale bars, 500 nm and 200 nm. n = 2 experiment. f Non-piliated Opa + bacteria remodel the plasma membrane in a phagocytic cup-like fashion. Re-expression of T4P reverts the remodeling to a protrusion morphology. Scale bars, 2 μm (darkfield) and 500 nm (SEM). n = 3 and 1 experiments. g An anti-T4P moclonal antibody affects plasma membrane remodeling by Nm. Plasma membrane recruitment was assessed by the accumulation of ezrin. Scale bars, 10 μm. Representative of n = 3 experiments. h Quantification of the experiment in g. Bars and error bars represent the mean ± SEM. Dots represent the mean of individual experiments. 216 to 240 microcolonies were counted per condition
Fig. 3
Fig. 3
Theoretical prediction of a novel regime of wetting for the spreading of a liposome on an adhesive nanofiber. a A liposome spreads on a fiber of radius r > rmin by “2D” membrane wetting, where the bilayer wraps around the fiber. b On a fiber of radius r < rmin, the liposome cannot wrap the fiber because of the curvature energy of the bilayer and is predicted to grow a tube of radius Rt along the fiber, which we call “1D” membrane wetting. In the inset most to the right mobile receptors and fixed ligands are indicated schematically, their size or distribution are not drawn to scale. c Phase diagram of a membrane bilayer spreading on a fiber versus nanofiber radius r and adhesion energy W. The black line corresponds to rmin separates the “2D” (blue region) and “1D” (yellow region) membrane wetting regimes. (*) Considering a biotinylated actin filament decorated with NeutrAvidin and a molar ratio of biotinylated actin:actin of 1:10 (Fig. 4), we estimated the adhesion energy W for the biotin-avidin complex to be 0.4 mJ.m-2, yielding a minimum radius rmin = 7 nm below which “2D” wetting can no longer occur (See Methods)
Fig. 4
Fig. 4
Membrane wetting on fibers drives the deformation of giant unilamellar vesicles and occurs in human endothelial cells. a Schematic of the experimental setup where giant unilamellar vesicles (GUVs) containing biotinylated phospholipids adhere to biotinylated F-actin fibers decorated with NeutrAvidin. b GUVs spread on thick adhesive bundles (arrowhead) by wrapping around the fibers (crop, dotted line), as predicted by the canonical “2D” membrane wetting regime. Scale bar, 5 μm. c On thin adhesive fibers, GUVs extend small membrane tubes that align with the fibers (arrowheads), as predicted in the “1D” membrane wetting regime. Membrane tubes can branch when encountering branched adhesive fibers (crop 2, asterisk). Scale bars, 5, 2 and 1 μm. Representative of n = 3 experiments. d Endothelial cells cultured on porous aluminum filters coated with an RGD peptide show local linear plasma membrane deformations that match with the thin pore walls (arrowheads). e Pore walls dictate the path followed by filopodia, where the plasma membrane is also found to deform locally when encountering a pore wall (arrowheads). Representative of = 2 experiments. Scale bars, 500 nm and 150 nm for the crops. f SEM shows that native basal membranes from mouse mesentery feature fibers with diameters down to 5 nm. Scale bar, 250 nm. g Endothelial cells cultured on such extracellular matrices show nanoscale plasma membrane protrusions aligning on nanoscale fibers. Scale bars, 250 and 200 nm
Fig. 5
Fig. 5
Working model for the mechanism of wetting-induced plasma membrane protrusions by Nm T4P fibers. Nm produces T4P as a meshwork of fibers. Upon adhesion to the host endothelial cell, the high adhesiveness of T4P allows “1D” membrane wetting of the plasma membrane, and thus remodeling of the membrane alongside T4P fibers. As the bacteria proliferate and aggregate extracellularly, plasma membrane protrusions remain attached to T4P fibers and end up embedded in a dense extracellular T4P meshwork. This complex T4P-plasma membrane structure provides the microcolony with enough mechanical coherence to resist blood flow-generated shear stress

Comment in

References

    1. McMahon HT, Gallop JL. Membrane curvature and mechanisms of dynamic cell membrane remodelling. Nature. 2005;438:590–596. doi: 10.1038/nature04396. - DOI - PubMed
    1. Parton RG, del Pozo MA. Caveolae as plasma membrane sensors, protectors and organizers. Nat. Rev. Mol. Cell Biol. 2013;14:98–112. doi: 10.1038/nrm3512. - DOI - PubMed
    1. McMahon HT, Boucrot E. Molecular mechanism and physiological functions of clathrin-mediated endocytosis. Nat. Rev. Mol. Cell Biol. 2011;12:517–533. doi: 10.1038/nrm3151. - DOI - PubMed
    1. Levin R, Grinstein S, Canton J. The life cycle of phagosomes: formation, maturation, and resolution. Immunol. Rev. 2016;273:156–179. doi: 10.1111/imr.12439. - DOI - PubMed
    1. Ridley AJ. Life at the leading edge. Cell. 2011;145:1012–1022. doi: 10.1016/j.cell.2011.06.010. - DOI - PubMed

Publication types