. 2018 Nov;20(11):1303-1314.
doi: 10.1038/s41556-018-0215-z. Epub 2018 Oct 22.

Deregulation of CRAD-controlled cytoskeleton initiates mucinous colorectal cancer via β-catenin

Affiliations

Deregulation of CRAD-controlled cytoskeleton initiates mucinous colorectal cancer via β-catenin

Youn-Sang Jung et al. Nat Cell Biol. 2018 Nov.

Abstract

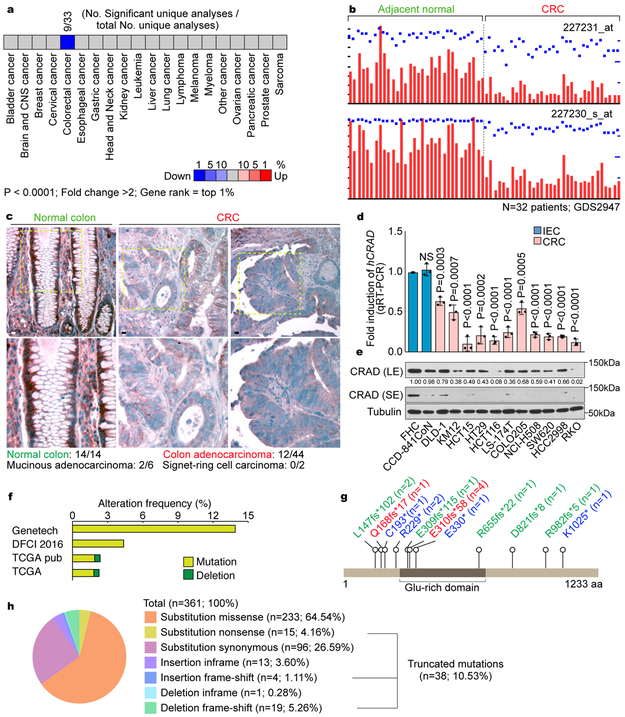
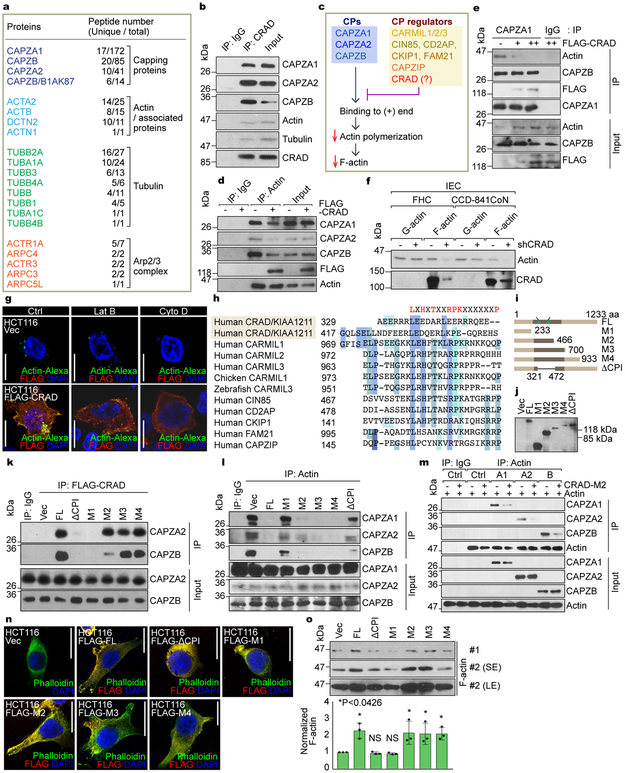
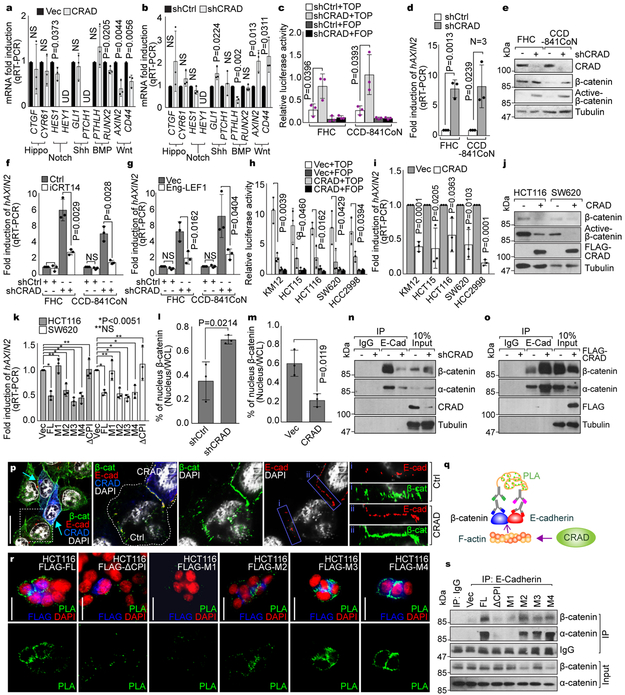
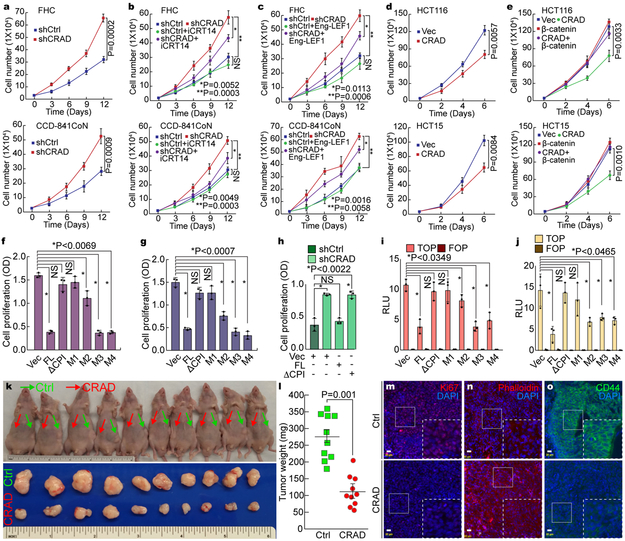
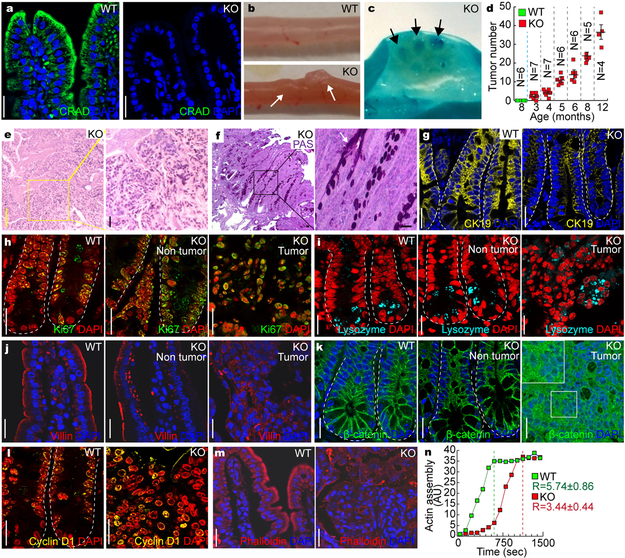
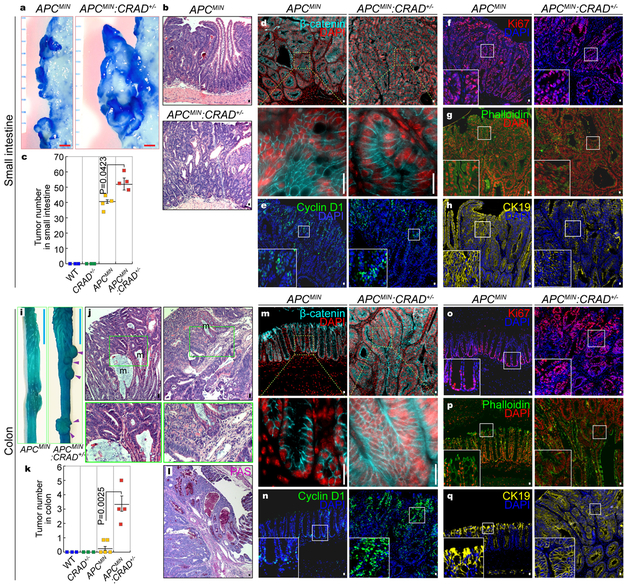
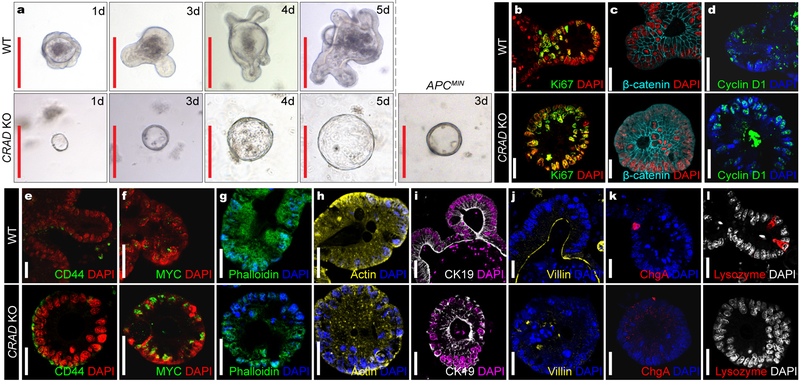
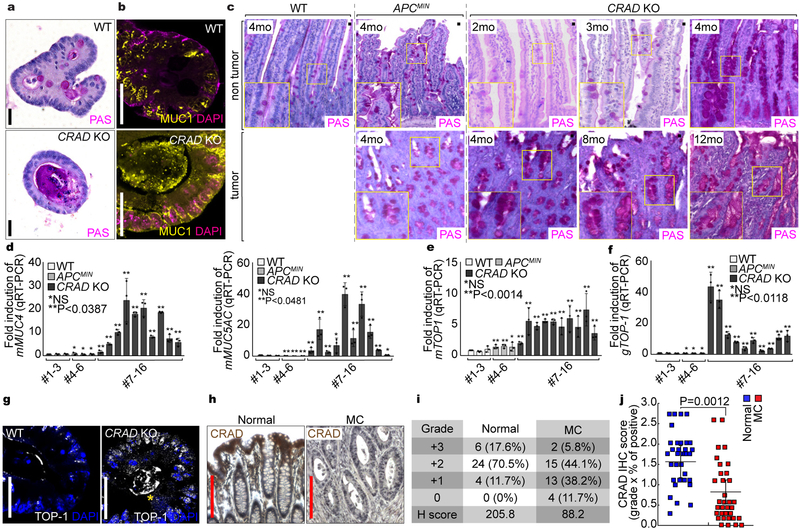
Epithelial integrity is maintained by the cytoskeleton and through cell adhesion. However, it is not yet known how a deregulated cytoskeleton is associated with cancer. We identified cancer-related regulator of actin dynamics (CRAD) as frequently mutated or transcriptionally downregulated in colorectal cancer. We found that CRAD stabilizes the cadherin-catenin-actin complex via capping protein inhibition. The loss of CRAD inhibits F-actin polymerization and subsequently disrupts the cadherin-catenin-actin complex, which leads to β-catenin release and Wnt signalling hyperactivation. In mice, CRAD knockout induces epithelial cell integrity loss and Wnt signalling activation, resulting in the development of intestinal mucinous adenoma. With APC mutation, CRAD knockout initiates and accelerates mucinous and invasive adenoma development in the colorectum. These results define CRAD as a tumour suppressor, the inactivation of which deregulates the cytoskeleton and hyperactivates Wnt signalling thus initiating mucinous colorectal cancer. Our study reveals the unexpected roles of an actin cytoskeletal regulator in maintaining epithelial cell integrity and suppressing tumorigenesis.


Conflict of interest statement

Disclosure of Potential Conflicts of Interest

The authors declare no competing financial interests.

Figures

Figure 1.
Figure 1.. CRAD inactivation in CRC
a, Oncomine analysis of CRAD expression in human cancers. b, GEO (GDS2947) analysis of CRAD expression in adjacent normal tissues vs. colorectal adenoma tissues. n=32 patients; probes: 227231_at and 227230_s_at. c, IHC of CRAD in normal colon and colorectal adenocarcinoma. Images are representative of 14 normal colon and 38 CRC samples. d and e, CRAD expression in IECs and CRC cells. qRT-PCR (d; n=3 independent experiments) and IB (e) analyses. The representative images are shown from three independent IB experiments. f, Genetic alteration of CRAD. cBioportal datasets: Genentech 2012 (n=72 patient samples); TCGA pub 2012 (n=212 patient samples); TCGA provisional (n=220 patient samples); DFCI 2016 (n=619 patient samples). g and h, COSMIC analysis of CRAD mutations in CRC. n values indicate patient sample number. Scale bars indicate 50μm; Error bars: mean ± S.D.; NS: not significant (P>0.05); Two-sided unpaired t-test.
Figure 2.
Figure 2.. Positive regulation of the actin polymerization by CRAD-inhibited capping proteins
a, CRAD-interacting proteins identified by tandem affinity purification and mass spectrometry (TAP-MS) (see Table S2). TAP-MS was performed once. b, The endogenous interaction of CRAD with CPs, actin, and tubulin. FHC cell lysates were analyzed for co-IP. c, Illustration of the hypothetical model of CRAD-induced actin polymerization. d and e, The decreased interaction between CPs and actin by CRAD. The reciprocal co-IP analysis of HCT116 cells transfected with FLAG-CRAD plasmid, with either actin (d) or CAPZA1 antibodies (e). f, Decreased F-actin by CRAD depletion in IECs. Fractionation and IB assays of F-/G-actin. g, The increase of uncapped barbed (+) ends by CRAD. Cells were permeabilized by the saponin-containing buffer for visualization of uncapped barbed (+) ends using Super Resolution microscope. Images are representative of two independent experiments (n=3 each independent samples) with similar results. h, Comparative amino acid sequence analysis of potential CPI motifs in CRAD with those in known CP regulators. i and j, The generation of CRAD mutant constructs (i) and IB assays (j). IB was performed once. k and l, CRAD-CPs binding via CPI motifs. The reciprocal co-IP analysis of HCT116 cell lysates transfected with FLAG-CRAD (FL, ΔCPI, and M1-M4) plasmids, with either FLAG (k) or actin antibodies (l). m, The decreased interaction between CAPZs and actin by CRAD. Direct binding and blocking were analyzed by co-IP assay using purified recombinant proteins. n and o, The increase of F-actin formation by ectopic expression of CPI motifs-containing CRAD mutants. After 24hr transfection with each plasmid, HCT116 CRC cells were visualized by Phalloidin IF staining (n). Images are representative of three independent experiments (n=3 each independent samples) with similar results. Cells were also fractionated into F-actin and G-actin and analyzed for IB (o; upper), (normalized by G-actin expression using ImageJ [u; lower]). SE/LE: short or long exposure. Scale bars indicate 20μm; Data in panels b, d-f, k-m, and o are from n=3 independent experiments; Error bars: mean ± S.D.; NS: not significant (P>0.05); Two-sided unpaired t-test.
Figure 3.
Figure 3.. Loss of CRAD-activated Wnt signaling by disrupting CCA complex
a, Decreased Wnt signaling target genes by CRAD. 24hr after transfection, HCT116 cells were analyzed for qRT-PCR. b, Increased Wnt signaling target genes by CRAD knockdown. CRAD-depleted CCD-841CoN cells were analyzed for qRT-PCR. c and d, Increased β-catenin transcriptional activity by CRAD depletion. IECs were transfected with β-catenin reporter plasmids (TOP/FOPFLASH) for luciferase assays (c). qRT-PCR for AXIN2 (d). e, Increased β-catenin protein by CRAD depletion in IECs. IB assays. f and g, Inhibition of CRAD depletion-induced AXIN2 upregulation by iCRT14 (f) or Eng-LEF1 (g). 24hr after iCRT14 (an inhibitor of β-catenin-TCF binding; 100μM) treatment or Eng-LEF1 (a dominant-negative mutant blocking β-catenin-mediated gene activation) transient transfection, IECs were analyzed for qRT-PCR. h-j, Suppression of β-catenin transcriptional activity by CRAD in CRC cells. 24hr after transfection, CRC cells were analyzed for TOP/FOPFLASH luciferase analysis (h), qRT-PCR of AXIN2 (i), and IB for β-catenin (j). Experiment performed once. k, The inhibition of β-catenin target gene expression by CPI motif-containing CRAD mutants. 24hr after transfection, CRC cells were analyzed for TOP/FOPFLASH luciferase activity. l, Decreased nuclear β-catenin by CRAD. IECs (l) and CRC cells (m) were transfected with shCtrl or shCRAD and Vec or CRAD, respectively. After 48hr, cells were fractionated into the cytosolic and nucleus fractions, followed by IB. Quantification of nucleus β-catenin was assessed using ImageJ. n, Decreased interaction between E-cadherin and catenins by CRAD depletion. Co-IP assays of shCRAD-CCD-841CoN. The representative images are shown from three independent experiments with similar results. o and p, Increased interaction between E-cadherin and catenins by CRAD. HCT116 cells were transfected with FLAG-CRAD plasmid. Co-IP assays (o) and IF staining (p). Arrows indicate CRAD-expressing cells. Compared to i (non-transfected cells), ii (CRAD-expressing cells) displays the increased colocalization of E-cadherin and β-catenin by CRAD. The representative images are shown from three independent experiments with similar results. q, Illustration of E-cadherin-β-catenin binding analysis using Duolink assays. r and s, Restoration of E-cadherin-β-catenin binding by CPI motif-containing CRAD mutants in CRC cells. Duolink assay (r). Green (PLA) fluorescence indicates E-cadherin-β-catenin interaction. Co-IP analysis (s). Representative images of three experiments with similar results; Scale bars indicate 20μm; Data in panels a-h and k-m are from n=3 independent experiments; Error bars: mean ± S.D.; NS: not significant (P>0.05); Two-sided unpaired t-test;
Figure 4.
Figure 4.. Inhibition of CRC cell proliferation by CRAD
a, IEC hyperproliferation by CRAD depletion. The proliferation of FHC and CCD-841CoN cells (shCtrl [control] and shCRAD) were analyzed by cell counting. b and c, Suppression of shCRAD-induced cell hyperproliferation by β-catenin inhibition in IECs. FHC and CCD-841CoN (shCtrl and shCRAD) cells were treated with iCRT14 (100μM) for 14 days, and cell number was counted (b). IECs (shCtrl and shCRAD) were transfected with Eng-LEF1 and analyzed for cell proliferation (c). d, CRC cell growth inhibition by CRAD expression. HCT116 and HCT15 cells (Vec [control] and CRAD expressing) were analyzed for cell proliferation. e, β-catenin rescues CRAD-induced CRC cell growth inhibition. HCT116 and HCT15 cells were transfected with CRAD or β-catenin plasmids and analyzed for cell proliferation. f-h, CRC cell growth inhibition by CPI motif-containing CRAD mutants. CRAD (FL, ΔCPI, and M1-M4)-transfected CRC cells were analyzed for cell proliferation. HCT116 (f); SW620 cells (g). CCD-841CoN cells were transfected with each plasmid and analyzed for cell proliferation (h). i and j, Suppression of β-catenin reporter by CPI motif-containing CRAD mutants. HCT116 (i) and SW620 (j) cells transfected with CRAD FL or mutant constructs were analyzed for luciferase activity. k-o, Inhibition of ex vivo tumor development by CRAD. HCT116 (control [Ctrl]) and HCT116-CRAD cells were subcutaneously injected into the left flank (control; green arrows; k) and the right flank (CRAD-expressing; red arrows; k), and analyzed for tumor weight (l; n=10 mice) and IHC (m-o); Ki67 (m); Phalloidin (n); CD44 (o). These experiments (k and l) were performed once. Scale bars indicate 20μm; Data in panel a-j and o are from n=3 independent experiments; Error bars: mean ± S.D.; NS: not significant (P>0.05); Two-sided unpaired t-test.
Figure 5.
Figure 5.. Intestinal adenoma development by CRAD KO
a, CRAD expression in the small intestine. Immunohistochemistry (IHC) of mouse intestine. CRAD KO mouse serves as a negative control. b and c, Intestinal adenoma development in CRAD KO mice. The adenomas in the small intestine of CRAD KO mice (3mo of age; b). Methylene blue staining (c). Arrows indicate intestinal adenoma. d, Age-dependent intestinal adenoma development in CRAD KO mice. N values indicate the number of mice. Error bars: mean ± S.D. The experiment was performed once. e, Hematoxylin and eosin (H&E) staining of intestinal adenoma (CRAD KO). f, Periodic Acid-Schiff (PAS) staining of intestinal adenoma in CRAD KO mice. g, Disruption of epithelial cell integrity. Cytokeratin 19 (CK19). Arrows: Villi not expressing CK19. h, Cell hyperproliferation in CRAD KO small intestine. CRAD KOKi67. i, Abnormal differentiation of IECs by CRAD KO. WT and CRAD KO small intestine were immunostained with Lysozyme. j, Disorganized cell adhesion in CRAD KO mice. Cells were stained with Villin. k, The increase of β-catenin in CRAD KO tumor. l, Upregulation of β-catenin target genes in the intestinal adenoma of CRAD KO mice. IHC for Cyclin D1. m, Disorganized actin cytoskeleton in CRAD KO-induced tumor. F-actin was visualized by Phalloidin staining. n, The decrease of the actin polymerization in CRAD KO mice. Cell extracts from the small intestine were analyzed for actin polymerization assays. n=3 independent experiments. R values indicate the velocity of actin assembly. Representative images of three independent mice per group (WT vs. KO); AU: arbitrary unit; Scale bars indicate 20μm.
Figure 6.
Figure 6.. Accelerated intestinal tumorigenesis by CRAD heterogeneous KO
a, Representative images of intestinal tumors from the small intestine of APCMIN (n=4 mice) and APCMIN:CRAD+/− (n=4 mice) (4mo of age). b and c, The increase of small intestinal tumors in APCMIN:CRAD+/− (n=4) mice, compared to APCMIN (n=4) mice. Representative H&E images of small intestinal tumors in APCMIN and APCMIN:CRAD+/− mice (b). Quantification of adenomas (4mo of age; c). d-h, IHC of intestinal tumors from the small intestine of APCMIN and APCMIN:CRAD+/− mice. β-catenin (d); Cyclin D1 (e); Ki67 (f); Phalloidin (g); CK19 (h). i, Colorectal tumors in APCMIN:CRAD+/− (n=4) mice (4mo of age; Arrowheads). j, H&E staining of the colorectal tumors in APCMIN:CRAD+/− mice. m: mucin-accumulated lesion. 4mo of age. n=3. k, Comparative analysis of colorectal tumors (4mo of age). WT (n=3 mice); CRAD+/− (n=3 mice); APCMIN (n=5 mice); APCMIN:CRAD+/− (n=4 mice.) l, PAS staining of colorectal tumors in APCMIN:CRAD+/− mice. m-q, IHC of colorectal tumors from APCMIN and APCMIN:CRAD+/− mice (4mo of age). β-catenin (m); Cyclin D1 (n); Ki67 (o); Phalloidin (p); CK19 (q). Images of panel b, d-h, j, and l-q are representative of IHC experiments from three independent tumors; Red scale bars indicate 1mm; Blue scale bars indicate 10mm; Black or white scale bars indicate 20μm; Error bars: mean ± S.D.; Two-sided unpaired t-test.
Figure 7.
Figure 7.. Mucinous Intestinal tumorigenesis by CRAD KO
a, Cystic spheroids formation by CRAD KO. Isolated crypts from WT, CRAD KO, and APCMIN were maintained in the organoid culture medium. These data are representative of three independent organoid experiments with similar results. 10 organoids per group [WT vs. KO] were analyzed. b-l, IHC analysis of the organoids derived from CRAD WT and KO mouse intestine. Compared to WT, CRAD KO-driven cystic spheroids showed that increase of cell proliferation (Ki67; b), increase of β-catenin (c) and its target genes (Cyclin D1 [d]; CD44 [e]; MYC [f]), disruption of the actin cytoskeleton (Phalloidin [g]; Actin [h]), loss of epithelial cell integrity (CK19 [i]; Villin [j]), and decreased IEC lineage differentiation (Chromogranin A: ChgA; [k]; Lysozyme [l]). Representative images of three experiments; Red scale bars indicate 20μm; White scale bars indicate 20μm.
Figure 8.
Figure 8.. Increased mucin deposition by CRAD KO
a and b, Excessive mucin deposition in CRAD KO-induced cystic spheroids. PAS staining (a) and IHC of MUC1 (b) were performed using organoids from WT and CRAD KO mice. c and d, Increased mucin deposition in CRAD KO-induced tumors. After fixation and paraffin embedding, each sample was stained with PAS (c). Increased mucin expression in CRAD KO tumors (qRT-PCR; d). e-g, Upregulation of TOP-1 in CRAD KO tumors. WT intestine (#1–3) and tumors from APCMIN (#4–6) and CRAD KO (#7–16) were analyzed for TOP-1 mRNA (qRT-PCR; e; n=3) and genomic DNA (real-time PCR; f). After 5 days of culture, normal crypt organoid from CRAD WT and spheroid organoids from CRAD KO were immunostained with a TOP-1 antibody (g). h-j, CRAD inactivation in MC patients. IHC of TMA with CRAD antibody, Images are representative of 34 patients samples (h). After scoring of CRAD expression, H-scores (i) and IHC scores (j) were calculated. Normal (n=34 patient samples) vs. MC (n=34 patient samples). Images of panel a-c and g are representative of three independent experiments; Red scale bars indicate 200μm; black or white scale bars indicate 20μm; Data in panel d-f were obtained from n=3 independent experiments; Error bars: mean ± S.D.; NS: not significant (P>0.05); Two-sided unpaired t-test.

Comment in

  • CRAD as a cytoskeletal tumour suppressor.
    Eng G, Braverman J, Yilmaz ÖH. Eng G, et al. Nat Cell Biol. 2018 Nov;20(11):1232-1233. doi: 10.1038/s41556-018-0225-x. Nat Cell Biol. 2018. PMID: 30361696 No abstract available.

References

    1. Mege RM, Gavard J & Lambert M Regulation of cell-cell junctions by the cytoskeleton. Curr Opin Cell Biol 18, 541–548 (2006). - PubMed
    1. Gumbiner BM & Kim NG The Hippo-YAP signaling pathway and contact inhibition of growth. J Cell Sci 127, 709–717 (2014). - PMC - PubMed
    1. Oda H & Takeichi M Evolution: structural and functional diversity of cadherin at the adherens junction. J Cell Biol 193, 1137–1146 (2011). - PMC - PubMed
    1. Maiden SL & Hardin J The secret life of alpha-catenin: moonlighting in morphogenesis. J Cell Biol 195, 543–552 (2011). - PMC - PubMed
    1. Bianchini JM et al. Reevaluating alphaE-catenin monomer and homodimer functions by characterizing E-cadherin/alphaE-catenin chimeras. J Cell Biol 210, 1065–1074 (2015). - PMC - PubMed

Publication types

MeSH terms