. 2019 Feb;10(1):63-72.
doi: 10.1002/jcsm.12348. Epub 2018 Oct 25.

Cancer cachexia impairs neural respiratory drive in hypoxia but not hypercapnia

Affiliations

Cancer cachexia impairs neural respiratory drive in hypoxia but not hypercapnia

Daryl P Fields et al. J Cachexia Sarcopenia Muscle. 2019 Feb.

Abstract

Background: Cancer cachexia is an insidious process characterized by muscle atrophy with associated motor deficits, including diaphragm weakness and respiratory insufficiency. Although neuropathology contributes to muscle wasting and motor deficits in many clinical disorders, neural involvement in cachexia-linked respiratory insufficiency has not been explored.

Methods: We first used whole-body plethysmography to assess ventilatory responses to hypoxic and hypercapnic chemoreflex activation in mice inoculated with the C26 colon adenocarcinoma cell line. Mice were exposed to a sequence of inspired gas mixtures consisting of (i) air, (ii) hypoxia (11% O2 ) with normocapnia, (iii) hypercapnia (7% CO2 ) with normoxia, and (iv) combined hypercapnia with hypoxia (i.e. maximal chemoreflex response). We also tested the respiratory neural network directly by recording inspiratory burst output from ligated phrenic nerves, thereby bypassing influences from changes in diaphragm muscle strength, respiratory mechanics, or compensation through recruitment of accessory motor pools.

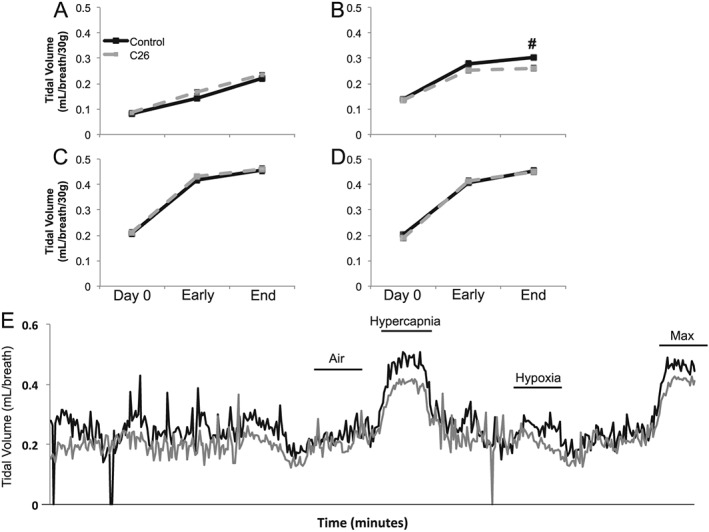
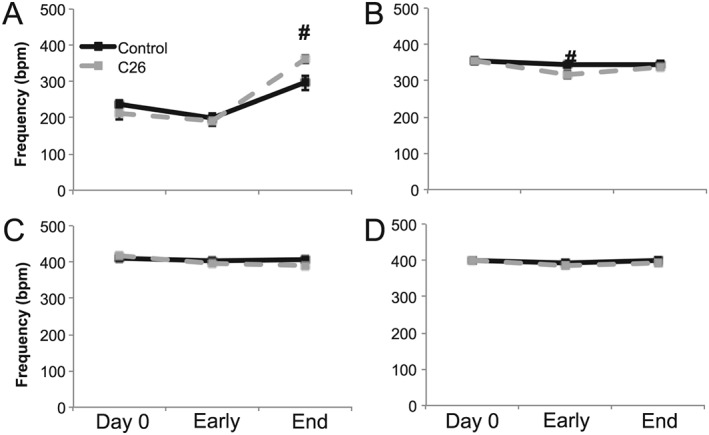
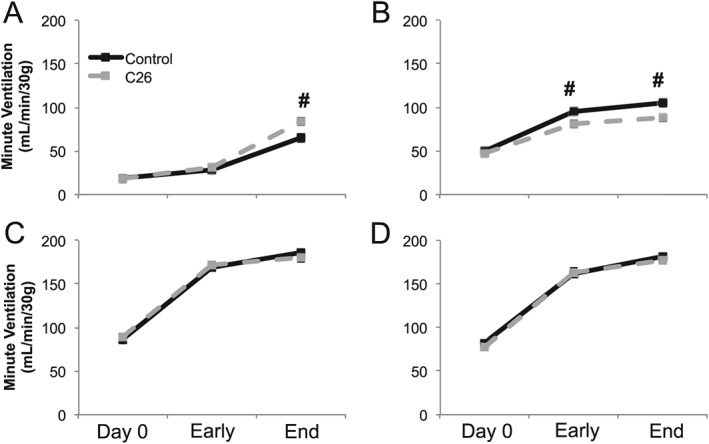
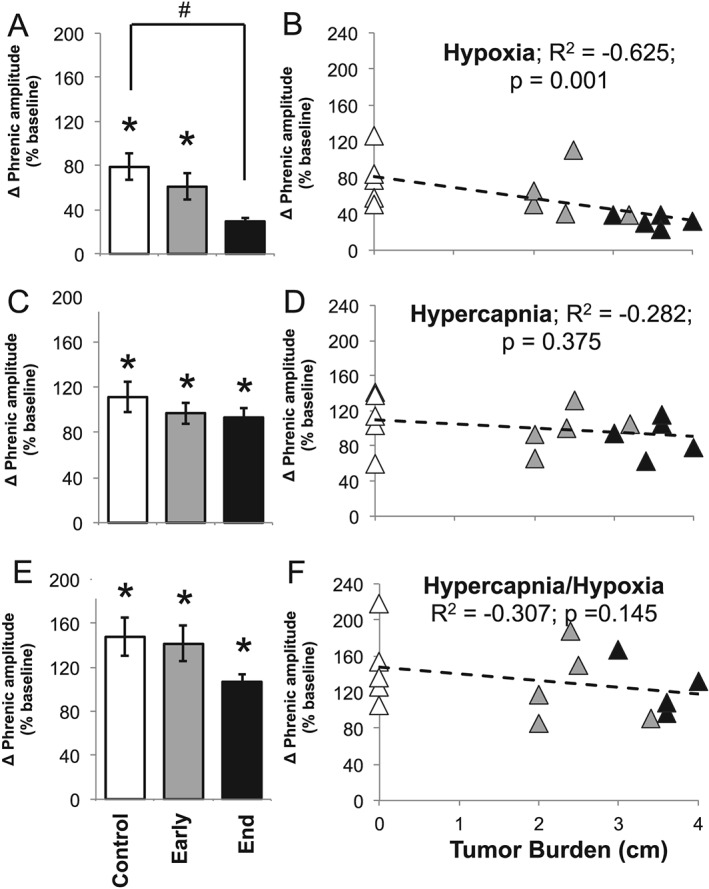
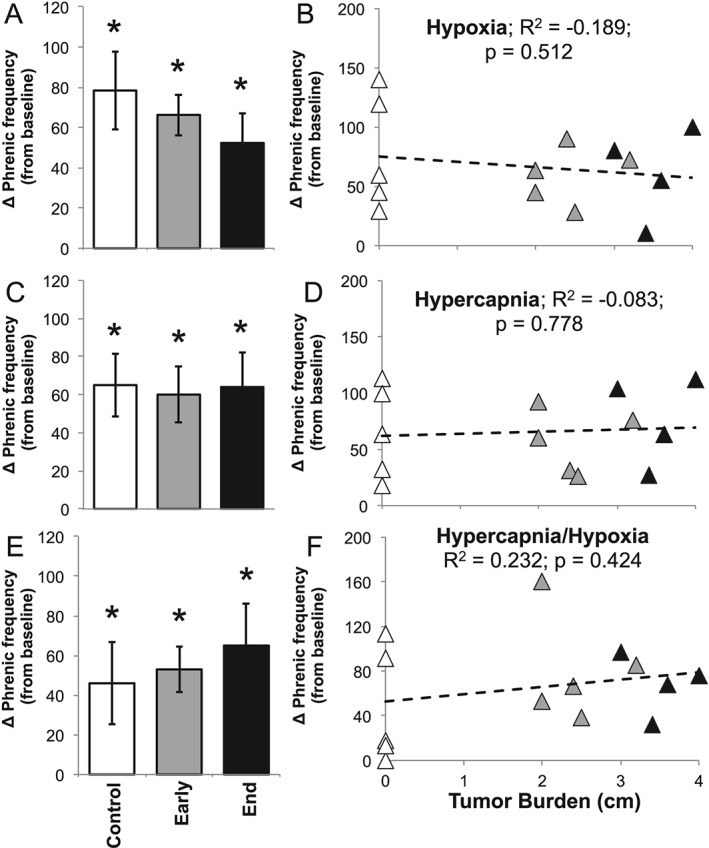
Results: Cachectic mice demonstrated a significant attenuation of the hypoxic tidal volume (0.26mL±0.01mL vs 0.30mL±0.01mL; p<0.05), breathing frequency (317±10bpm vs 344±6bpm; p<0.05) and phrenic nerve (29.5±2.6% vs 78.8±11.8%; p<0.05) responses. On the other hand, the much larger hypercapnic tidal volume (0.46±0.01mL vs 0.46±0.01mL; p>0.05), breathing frequency (392±5bpm vs 408±5bpm; p>0.05) and phrenic nerve (93.1±8.8% vs 111.1±13.2%; p>0.05) responses were not affected. Further, the concurrent hypercapnia/hypoxia tidal volume (0.45±0.01mL vs 0.45±0.01mL; p>0.05), breathing frequency (395±7bpm vs 400±3bpm; p>0.05), and phrenic nerve (106.8±7.1% vs 147.5±38.8%; p>0.05) responses were not different between C26 cachectic and control mice.

Conclusions: Breathing deficits associated with cancer cachexia are specific to the hypoxic ventilatory response and, thus, reflect disruptions in the hypoxic chemoafferent neural network. Diagnostic techniques that detect decompensation and therapeutic approaches that support the failing hypoxic respiratory response may benefit patients at risk for cancer cachectic-associated respiratory failure.

Keywords: Breathing; Cancer; Chemoreflex and hypoxia.


Conflict of interest statement

The authors have no conflicts of interest to declare.

Figures

Figure 1
Figure 1
Plethysmography tidal volume measurements. Tidal volume during (A) air, (B) hypoxia, (C) hypercapnia, and (D) maximum respiratory challenges at day 0, early disease (day 14), and end‐stage disease (day 25) time points of control (black solid) and C26 (grey dash) mice. All tidal volumes are weight adjusted. # denotes significant difference between control and C26 mice (P < 0.05). (E) Representative traces for control (black) and C26 (grey) mice demonstrating tidal volumes during normoxia (air), hypercapnia, hypoxia, and maximum respiratory challenges. Represent trace tidal volumes are not weight adjusted.
Figure 2
Figure 2
Plethysmography frequency measurements. Breathing frequency during (A) air, (B) hypoxia, (C) hypercapnia, and (D) maximum respiratory challenges at day 0, early disease (day 14), and end‐stage disease (day 25) time points of control (black solid) and C26 (grey dash) mice. # denotes significant difference between control and C26 mice (P < 0.05).
Figure 3
Figure 3
Plethysmography minute ventilation measurements. Weight‐adjusted minute ventilation during (A) air, (B) hypoxia, (C) hypercapnia, and (D) maximum respiratory challenges at day 0, early disease (day 14), and end‐stage disease (day 25) time points of control (black solid) and C26 (grey dash) mice. # denotes significant difference between control and C26 mice (P < 0.05).
Figure 4
Figure 4
Neurophysiology: phrenic nerve amplitude. Relative (baseline) change of phrenic nerve amplitude during (A) hypoxia, (C) hypercapnia, and (E) maximum respiratory challenges within control, early disease (day 14), and end‐stage disease (day 25) mice. * denotes significant difference from starting baseline (P < 0.05), and # denotes significant difference from control group (P < 0.05). Linear regression analysis of tumour burden and phrenic amplitude during (B) hypoxia, (D) hypercapnia, and (F) hypercapnia/hypoxia (maximum) respiratory challenges within control (white triangle), early disease (grey triangle), and end‐stage (black triangle) mice.
Figure 5
Figure 5
Neurophysiology: phrenic nerve frequency. Absolute phrenic nerve frequency during (A) hypoxia, (C) hypercapnia, and (E) maximum respiratory challenges within control, early disease (day 14), and end‐stage disease (day 25) mice. * denotes significant difference from starting baseline (P < 0.05). Linear regression analysis of tumour burden and phrenic frequency during (B) hypoxia, (D) hypercapnia, and (F) hypercapnia/hypoxia (maximum) respiratory challenges within control (white triangle), early disease (grey triangle), and end‐stage (black triangle) mice.
Figure 6
Figure 6
Diagram of the afferent–efferent neural control network. (A) The hypoxic respiratory response begins at peripheral carotid bodies (1) that synapse onto central respiratory modulators of the medullary brainstem (2). Brainstem neurons project to respiratory spinal motor neurons (3) that exit the central nervous system to synapse onto respiratory muscle fibres of the diaphragm (4). (B) The hypercapnia respiratory response begins at central chemoreceptors (1) that synapse onto central respiratory modulators of the medullary brainstem (2). Brainstem neurons project to respiratory spinal motor neurons (3) that exit the central nervous system to synapse onto respiratory muscle fibres of the diaphragm (4).

Similar articles

Cited by

References

    1. Aoyagi T, Terracina KP, Raza A, Matsubara H, Takabe K. Cancer cachexia, mechanism and treatment. World J Gastroint Oncol 2015;7:17–29. - PMC - PubMed
    1. Fearon K, Strasser F, Anker SD, Bosaeus I, Bruera E, Fainsinger RL, et al. Definition and classification of cancer cachexia: an international consensus. Lancet Oncol 2011;12:489–495. - PubMed
    1. Argilés JM, Busquets S, Toledo M, López‐Soriano FJ. The role of cytokines in cancer cachexia. Curr Opin Support Palliat Care 2009;3:263–268. - PubMed
    1. Aversa Z, Costelli P, Muscaritoli M. Cancer‐induced muscle wasting: latest findings in prevention and treatment. Ther Adv Med Oncol 2017;9:369–382. - PMC - PubMed
    1. Zhou X, Wang JL, Lu J, Song Y, Kwak KS, Jiao Q, et al. Reversal of cancer cachexia and muscle wasting by ActRIIB antagonism leads to prolonged survival. Cell 2010;142:531–543. - PubMed

Publication types

LinkOut - more resources