. 2019 Apr;10(2):164-175.
doi: 10.1017/S2040174418000764. Epub 2018 Oct 26.

Transgenerational effects of maternal bisphenol: a exposure on offspring metabolic health

Affiliations

Transgenerational effects of maternal bisphenol: a exposure on offspring metabolic health

A Bansal et al. J Dev Orig Health Dis. 2019 Apr.

Erratum in

Abstract

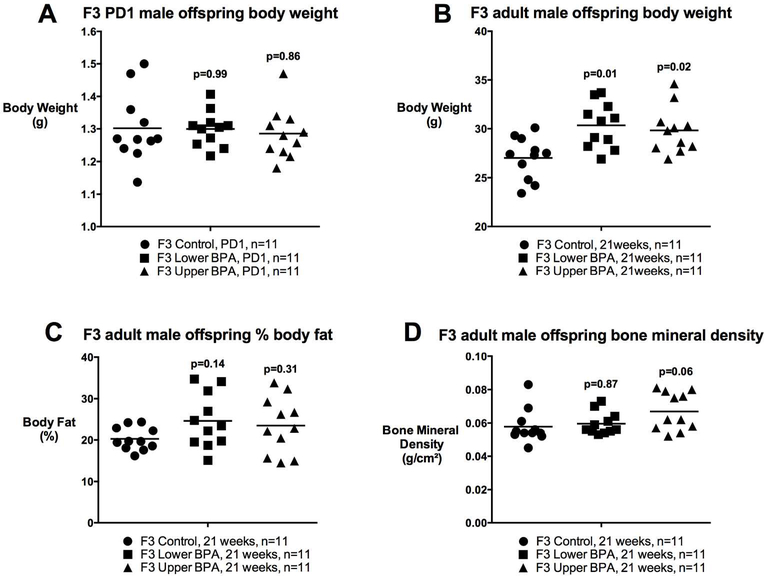
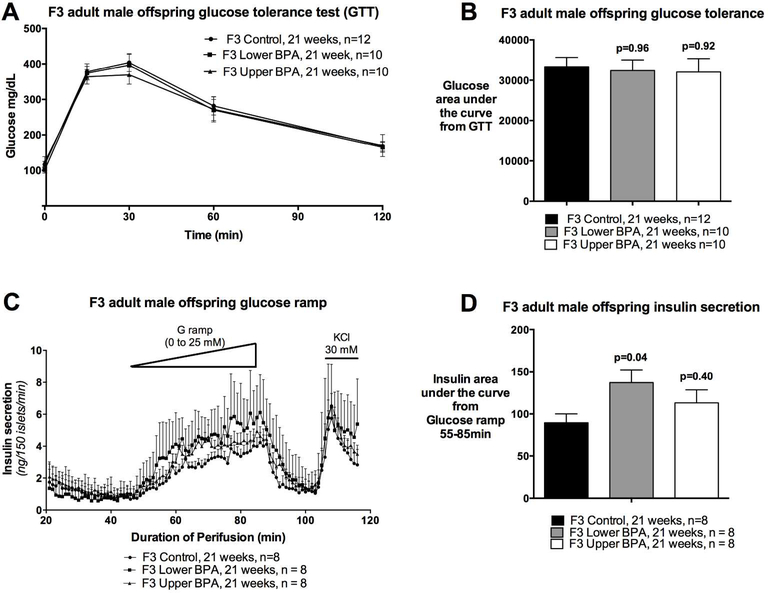
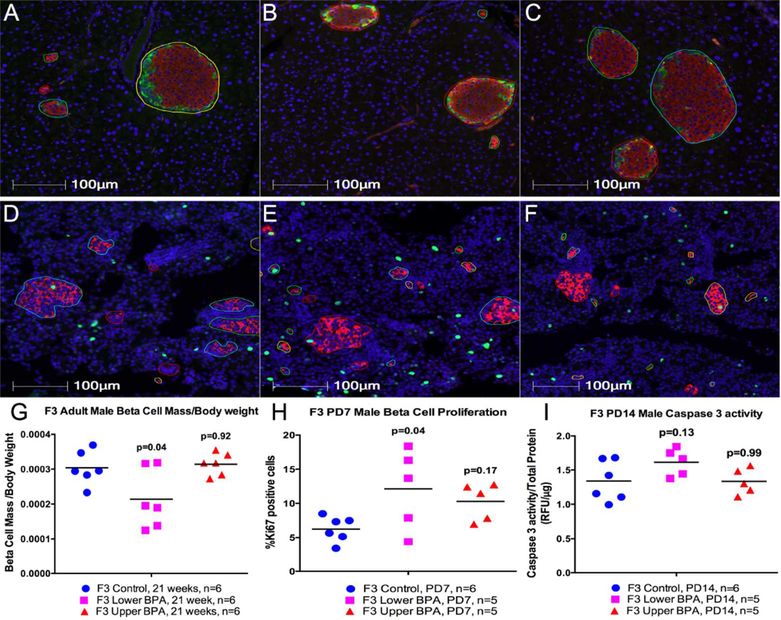
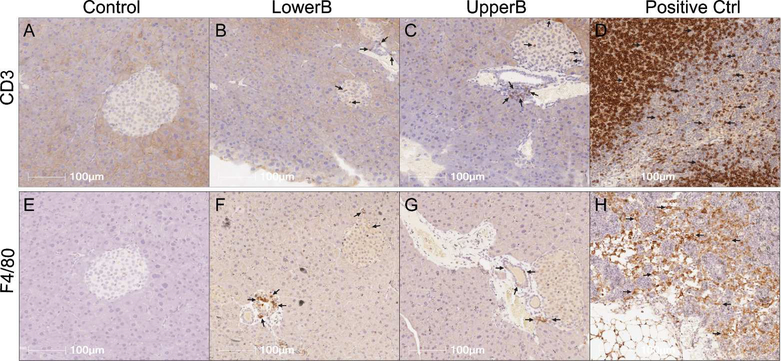
Exposure to the endocrine disruptor bisphenol A (BPA) is ubiquitous and associated with health abnormalities that persist in subsequent generations. However, transgenerational effects of BPA on metabolic health are not widely studied. In a maternal C57BL/6J mice (F0) exposure model using BPA doses that are relevant to human exposure levels (10 μg/kg/day, LowerB; 10 mg/kg/day, UpperB), we showed male- and dose-specific effects on pancreatic islets of the first (F1) and second generation (F2) offspring relative to controls (7% corn oil diet; control). In this study, we determined the transgenerational effects (F3) of BPA on metabolic health and pancreatic islets in our model. Adult F3 LowerB and UpperB male offspring had increased body weight relative to Controls, however glucose tolerance was similar in the three groups. F3 LowerB, but not UpperB, males had reduced β-cell mass and smaller islets which was associated with increased glucose-stimulated insulin secretion. Similar to F1 and F2 BPA male offspring, staining for markers of T-cells and macrophages (CD3 and F4/80) was increased in pancreas of F3 LowerB and UpperB male offspring, which was associated with changes in cytokine levels. In contrast to F3 BPA males, LowerB and UpperB female offspring had comparable body weight, glucose tolerance and insulin secretion as Controls. Thus, maternal BPA exposure resulted in fewer metabolic defects in F3 than F1 and F2 offspring, and these were sex- and dose-specific.

Keywords: endocrine disruptors; inflammation; insulin secretion; islets; transgenerational; β-cell mass.


Conflict of interest statement

Disclosure statement: The authors declare no conflict of interest.

Figures

Figure 1.
Figure 1.. Postnatal body weight and body composition of F3 male offspring.
A) Postnatal day (PD) 1 body weight, B) Body weight at 21 weeks of age, C) % Body Fat at 21 weeks of age, and D) Bone mineral density at 21 weeks of age. Data are individual litter data (n=11 litters per group) with mean superimposed, and analysed using Dunnett’s test. P values are relative to Control.
Figure 2.
Figure 2.. Glucose tolerance test, and insulin secretion in F3 adult male offspring.
A) Curve from glucose tolerance test, B) Glucose area under the curve from the glucose tolerance test, C) Insulin secretion on islet perifusion with increasing concentration of glucose (from 0 to 25 mM) on a glucose ramp, potassium chloride (KCl) used as a depolarizing positive control, and D) Glucose stimulated insulin secretion determined as insulin area under the curve from time 55 to 85 min of the glucose ramp. Data are individual litter data (one animal per litter; n=8–12 litters per group), and presented as mean + SEM, and analysed using Dunnett’s test. P values are relative to Control.
Figure 3.
Figure 3.. Beta cell mass, proliferation and cell death in F3 male offspring.
(A to F) Representative photomicrographs of pancreatic immunofluorescent staining in 21 week old (A to C) and 7 days old (D to F) Control, Lower BPA, and Upper BPA male mice respectively. All images have insulin (red), and DAPI (blue). Images A to C have glucagon (green), somatostatin (yellow), while images D to F have Ki67 (green). Images are magnified at 20X. G) Beta cell mass adjusted for body weight in 21 weeks old male offspring, H) Percent proliferating beta cells in 7 days old male offspring, I) Caspase 3 acitivity in 14 days old offspring. Data are individual litter data (one animal per litter; n=5–6 litters per group) with mean superimposed, and analyzed by Dunnett’s test. P values are relative to Control.
Figure 4.
Figure 4.. Representative photomicrographs of pancreatic immunohistochemical staining in F3 male offspring.
(A to D) Sections stained for CD3: cluster of differentiation 3, marker for T lymphocytes, and (E to H) Sections stained for F4/80: marker for macrophages. LowerB (Lower BPA), UpperB (Upper BPA), Positive Ctrl (internal control- lymph node). Image magnified 20X. One animal per litter; n=6 litters per group.
Figure 5.
Figure 5.. Parameters of mothers of F3 offspring.
A) Weekly body weight from mating until weaning (n=8–9 litters per group), and B) Food intake from pregnancy until weaning (n=8–9 litters per group). Data are presented as mean + SEM, and analysed using Dunnett’s test. P values are relative to Control, and were not statistically different.

References

    1. Gore AC, Chappell VA, Fenton SE, Flaws JA, Nadal A, Prins GS, Toppari J, and Zoeller RT. EDC-2: The Endocrine Society’s Second Scientific Statement on Endocrine-DisruptingChemicals. Endocr Rev. 2015;36(6):E1–E150. doi: 10.1210/er.2015-1010. Epub 2015 Nov 6. - DOI - PMC - PubMed
    1. Kavlock RJ, Daston GP, DeRosa C, Fenner-Crisp P, Gray LE, Kaattari S, Lucier G, Luster M, Mac MJ, Maczka C, et al. Research needs for the risk assessment of health and environmental effects of endocrine disruptors: a report of the U.S. EPA-sponsored workshop. Environ Health Perspect. 1996;104(Suppl 4):715–40. - PMC - PubMed
    1. Zoeller RT, Brown TR, Doan LL, Gore AC, Skakkebaek NE, Soto AM, Woodruff TJ, and Vom Saal FS. Endocrine-disrupting chemicals and public health protection: a statement of principles from The Endocrine Society. Endocrinology. 2012;153(9):4097–110. doi: 10.1210/en.2012-1422. Epub 2012 Jun 25. - DOI - PMC - PubMed
    1. Stahlhut RW, Welshons WV, and Swan SH. Bisphenol A data in NHANES suggest longer than expected half-life, substantial nonfood exposure, or both. Environ Health Perspect. 2009;117(5):784–9. - PMC - PubMed
    1. Shankar A, and Teppala S. Relationship between urinary bisphenol A levels and diabetes mellitus. J Clin Endocrinol Metab. 2011;96(12):3822–6. doi: 10.1210/jc.2011-1682. Epub 2011 Sep 28. - DOI - PMC - PubMed

Publication types

MeSH terms