Comparative Study
. 2018 Oct 25;10(10):2973-2990.
doi: 10.18632/aging.101603.

Quantitative characterization of biological age and frailty based on locomotor activity records

Affiliations
Comparative Study

Quantitative characterization of biological age and frailty based on locomotor activity records

Timothy V Pyrkov et al. Aging (Albany NY). .

Abstract

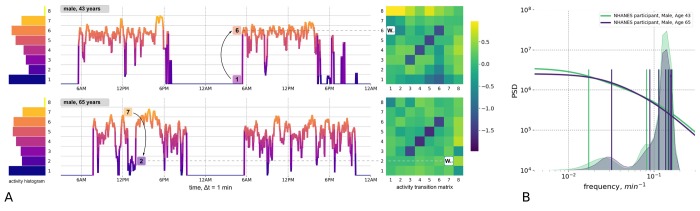
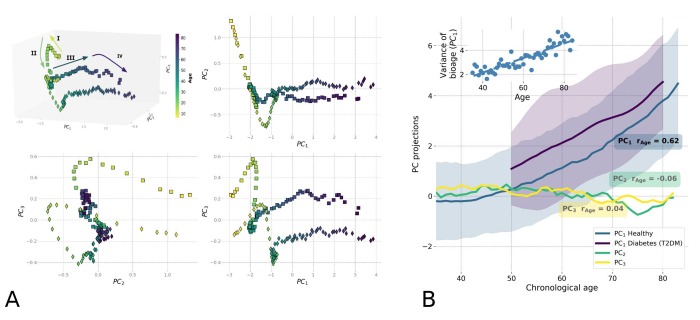
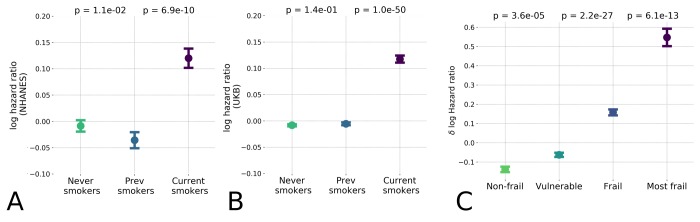
We performed a systematic evaluation of the relationships between locomotor activity and signatures of frailty, morbidity, and mortality risks using physical activity records from the 2003-2006 National Health and Nutrition Examination Survey (NHANES) and UK BioBank (UKB). We proposed a statistical description of the locomotor activity tracks and transformed the provided time series into vectors representing physiological states for each participant. The Principal Component Analysis of the transformed data revealed a winding trajectory with distinct segments corresponding to subsequent human development stages. The extended linear phase starts from 35-40 years old and is associated with the exponential increase of mortality risks according to the Gompertz mortality law. We characterized the distance traveled along the aging trajectory as a natural measure of biological age and demonstrated its significant association with frailty and hazardous lifestyles, along with the remaining lifespan and healthspan of an individual. The biological age explained most of the variance of the log-hazard ratio that was obtained by fitting directly to mortality and the incidence of chronic diseases. Our findings highlight the intimate relationship between the supervised and unsupervised signatures of the biological age and frailty, a consequence of the low intrinsic dimensionality of the aging dynamics.

Keywords: NHANES; UK Biobank; biological clock; health span; physical activity.


Conflict of interest statement

CONFLICTS OF INTEREST: P.O. Fedichev is a shareholder of Gero LLC. A.Gudkov is a member of Gero LLC Advisory Board. T.V. Pyrkov, E. Getmantsev, B. Zhurov, K. Avchaciov, M. Pyatnitskiy, L. Menshikov, K. Khodova, and P.O. Fedichev are employees of Gero LLC. A patent application submitted by Gero LLC on the described methods and tools for evaluating health non-invasively is pending.

Figures

Figure 1
Figure 1
Quantitative description of human locomotor activity tracks. (A) Individuals with the same daily average level of activity can yet differ by their chronological age, health status and activity distribution during the day. Representative 2-day long locomotor activity tracks of two NHANES 2003−2006 cohort participants aged 43 (upper) and 65 (lower) illustrate how movement patterns can be visually different while having the same level of daily average activity. We quantify individual sample by dividing activity levels into 8 bins (left panel, histograms) and then counting the probabilities Wij of random jumps from each discrete activity state j to every other state i per unit time (right panel, color corresponds to intensity of transitions with respect to the population average). (B) The eigenfrequencies of the Markov chain transition matrices are calculated for same two middle-aged and old individuals and represented by vertical bars (note the difference in the positions of the bars). The distribution of the eigenfrequencies in the relevant age-cohorts of 35-45 y.o. 65-75 y.o. are illustrated by overlaid transparent histograms (the light green and dark blue, respectively). Power Spectral Densities (PSD) reconstructed for Markov chain transition matrices (see Appendix A for details) reproduces the approximately a scale-invariant segment of the true PSD of the signal on time-scales up to tens of minutes. This characteristic shift of the cross-over frequency with age has been reported in numerous studies of human and animal locomotor activity (see text).
Figure 2
Figure 2
Principle Component Analysis (PCA) reveals low-dimensional aging trajectory. (A) The graphical representation of the PCA for 5−85-year-old NHANES 2003−2006 participants follows a winding aging trajectory. Samples were plotted in the first three PCs in 3D space along with 2D projections. To simplify the visualization, the PC scores are shown for the age-matched averages for men (squares) and women (diamonds) and color-coded by age. The Roman numerals and corresponding arrows illustrate the approximately linear dynamics of PC scores over sequential stages of human life: I) age<16; II) age 16−35; III) age 35−65; and IV) age >65. (B) Age-dependence of PCA scores along chronological age for NHANES 2003-2006 cohort aged 35+ is shown by age-cohort average values. Human physiological state dynamics has a low intrinsic dimensionality: only the principal component score, PC1, which corresponds to the largest variance in data, showed a notable correlation with age (Pearson's r = 0.62 for PC1 and r < 0.2 for other PCs) and therefore could be used as a natural biomarker of age. Shaded regions illustrate the spread corresponding to one standard deviation in each age-matched cohort for PC1. The inset shows the increase of variance in biological age (PC1) in the age- and sex-matched cohorts along the chronological age.
Figure 3
Figure 3
Hazards ratio models show high correlation with each other and are strongly associated with average level of physical activity and the largest variance in physiological measurements (PC1). (A) Scatter plots of estimated mortality hazard ratio (log-scale) vs PC1 scores and log-hazard ratio estimated by “LogMort” model trained on NHANES survival follow-up data shows high correlation (see text). (B) Different models for hazard ratio of mortality and morbidity show high correlation between each other and the PC1 "biological age" in NHANES samples. Models for mortality and morbidity were built using Cox proportional hazards method based on either NHANES or UKB death follow-up data and UKB follow-up on diagnosis. All values were adjusted by age and gender and thus represent the corresponding Biological Age Acceleration (BAA) values.
Figure 4
Figure 4
Hazards ratio model distinguished low and high-risk populations and hazardous lifestyles. The effect of unhealthy lifestyle such as smoking caused reversible effect on estimated hazards ratio in the NHANES (A) population and the UK Biobank (B) datasets; (C) Distribution of logarithm of estimated hazards ratio in frailty cohorts shown by median ± standard error of mean (S.E.M.). “Frail” and “most frail” cohorts are stratified on the basis of the respective Frailty Index (FI) values computed according to [2] and are characterized by significant difference in the predicted log-mortality.

Similar articles

Cited by

References

    1. Mitnitski AB, Mogilner AJ, Rockwood K. Accumulation of deficits as a proxy measure of aging. Sci World J. 2001; 1:323–36. 10.1100/tsw.2001.58 - DOI - PMC - PubMed
    1. Rockwood K, Blodgett JM, Theou O, Sun MH, Feridooni HA, Mitnitski A, Rose RA, Godin J, Gregson E, Howlett SE. A frailty index based on deficit accumulation quantifies mortality risk in humans and in mice. Sci Rep. 2017; 7:43068. 10.1038/srep43068 - DOI - PMC - PubMed
    1. Antoch MP, Wrobel M, Kuropatwinski KK, Gitlin I, Leonova KI, Toshkov I, Gleiberman AS, Hutson AD, Chernova OB, Gudkov AV. Physiological frailty index (PFI): quantitative in-life estimate of individual biological age in mice. Aging (Albany NY). 2017; 9:615–26. 10.18632/aging.101206 - DOI - PMC - PubMed
    1. Jazwinski SM, Kim S. Metabolic and Genetic Markers of Biological Age. Front Genet. 2017; 8:64. 10.3389/fgene.2017.00064 - DOI - PMC - PubMed
    1. Pyrkov TV, Slipensky K, Barg M, Kondrashin A, Zhurov B, Zenin A, Pyatnitskiy M, Menshikov L, Markov S, Fedichev PO. Extracting biological age from biomedical data via deep learning: too much of a good thing? Sci Rep. 2018; 8:5210. 10.1038/s41598-018-23534-9 - DOI - PMC - PubMed

Publication types

MeSH terms