Editorial
. 2018 Aug;6(16):325.
doi: 10.21037/atm.2018.07.38.

Overview of model validation for survival regression model with competing risks using melanoma study data

Affiliations
Editorial

Overview of model validation for survival regression model with competing risks using melanoma study data

Zhongheng Zhang et al. Ann Transl Med. 2018 Aug.

Abstract

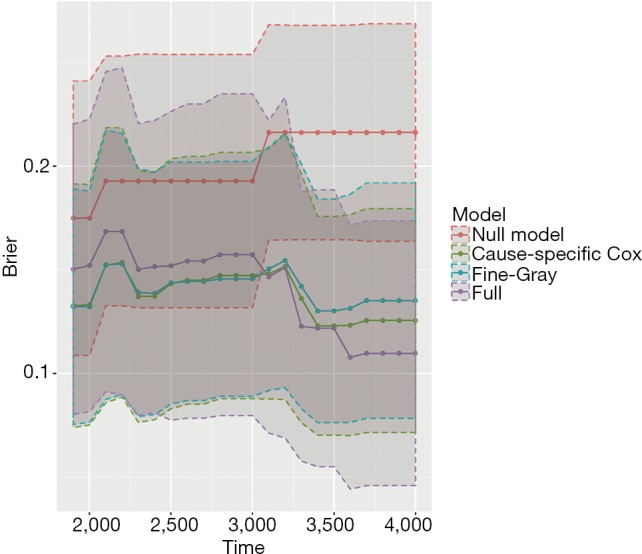
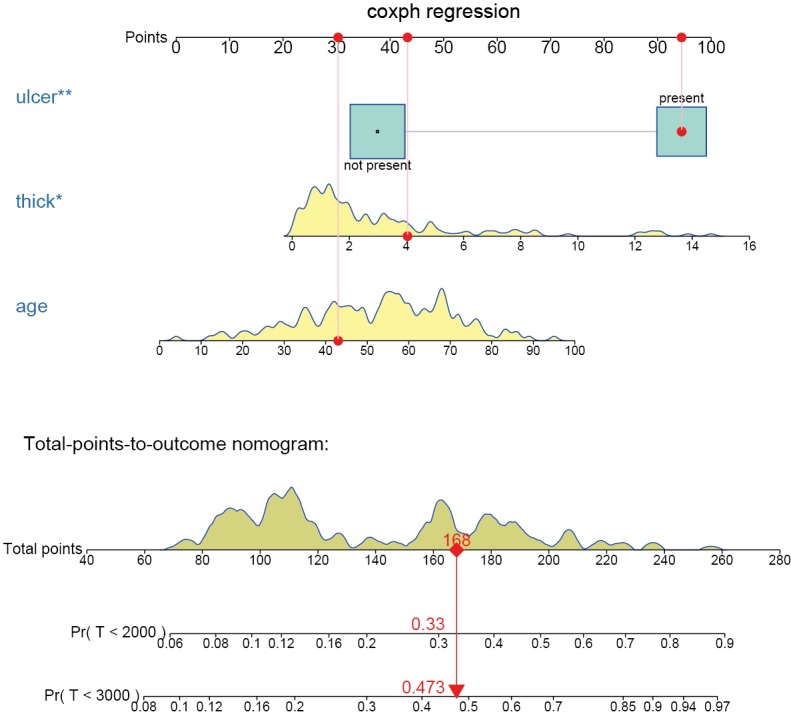
The article introduces how to validate regression models in the analysis of competing risks. The prediction accuracy of competing risks regression models can be assessed by discrimination and calibration. The area under receiver operating characteristic curve (AUC) or Concordance-index, and calibration plots have been widely used as measures of discrimination and calibration, respectively. One-time splitting method can be used for randomly splitting original data into training and test datasets. However, this method reduces sample sizes of both training and testing datasets, and the results can be different by different splitting processes. Thus, the cross-validation method is more appealing. For time-to-event data, model validation is performed at each analysis time point. In this article, we review how to perform model validation using the riskRegression package in R, along with plotting a nomogram for competing risks regression models using the regplot() package.

Keywords: Calibration plot; competing risk; discrimination; prediction model.


Conflict of interest statement

Conflicts of Interest: The authors have no conflicts of interest to declare.

Figures

Figure 1
Figure 1
Absolute risk for patients #1 to #5 over day 1,000 to 4,000 after operation.
Figure 2
Figure 2
Calibration curves for the cause-specific proportional hazards model, Fine-Gray model and the full model. The validation is performed on the test dataset. AUC and Brier score are expressed as the point estimates and 95% confidence intervals.
Figure 3
Figure 3
Calibration curves obtained by using cross-validation method.
Figure 4
Figure 4
Calibration curves vary depending on different bandwidths. At a bandwidth of 0.8, nearly all observations are grouped as one risk group, thus the calibration curves are identical for all three models and are flat and smooth. In contrast, the curves with bandwidth =0.1 appear to be wiggly.
Figure 5
Figure 5
The AUC for all three models. Note that the cause-specific hazard model has the same values to that of the Fine-Gray model, and their dots and lines overlap. AUC, area under operating characteristic curve.
Figure 6
Figure 6
Brier scores for all models, with confidence interval.
Figure 7
Figure 7
Nomogram for predicting cumulative risk at 2,000 and 3,000 days with Fine-Gray model. The patient #24 is illustrated in the nomogram by mapping its values to the covariate scales. The probability of melanoma-caused death by day 2,000 and 3,000 are estimated to be 0.330 and 0.473, respectively. *, P<0.05; **, P<0.01.
Figure 8
Figure 8
nomogram for predicting cumulative risk at 2,000 and 3,000 days with cause-specific hazard model. The patient #24 is illustrated in the nomogram by mapping its values to the covariate scales. The probabilities of melanoma-caused death by day 2,000 and 3,000 are estimated to be 0.337 and 0.478, respectively. *, P<0.05; **, P<0.01.

References

    1. Putter H, Fiocco M, Geskus RB. Tutorial in biostatistics: competing risks and multi-state models. Stat Med 2007;26:2389-430. 10.1002/sim.2712 - DOI - PubMed
    1. Prentice RL, Kalbfleisch JD, Peterson AV, Jr, et al. The analysis of failure times in the presence of competing risks. Biometrics 1978;34:541-54. 10.2307/2530374 - DOI - PubMed
    1. Cox DR. Regression Models and Life-Tables. J R Stat Soc Series B Stat Methodol 1972;34:187-220.
    1. Fine JP, Gray RJ. A Proportional Hazards Model for the Subdistribution of a Competing Risk. J Am Stat Assoc 1999;94:496-509. 10.1080/01621459.1999.10474144 - DOI
    1. Zhang Z, Geskus RB, Kattan MW, et al. Nomogram for survival analysis in the presence of competing risks. Ann Transl Med 2017;5:403. 10.21037/atm.2017.07.27 - DOI - PMC - PubMed

Publication types