. 2018 Oct 11:9:1423.
doi: 10.3389/fphys.2018.01423. eCollection 2018.

The Hierarchical Modular Structure of HER2+ Breast Cancer Network

Affiliations

The Hierarchical Modular Structure of HER2+ Breast Cancer Network

Sergio Antonio Alcalá-Corona et al. Front Physiol. .

Abstract

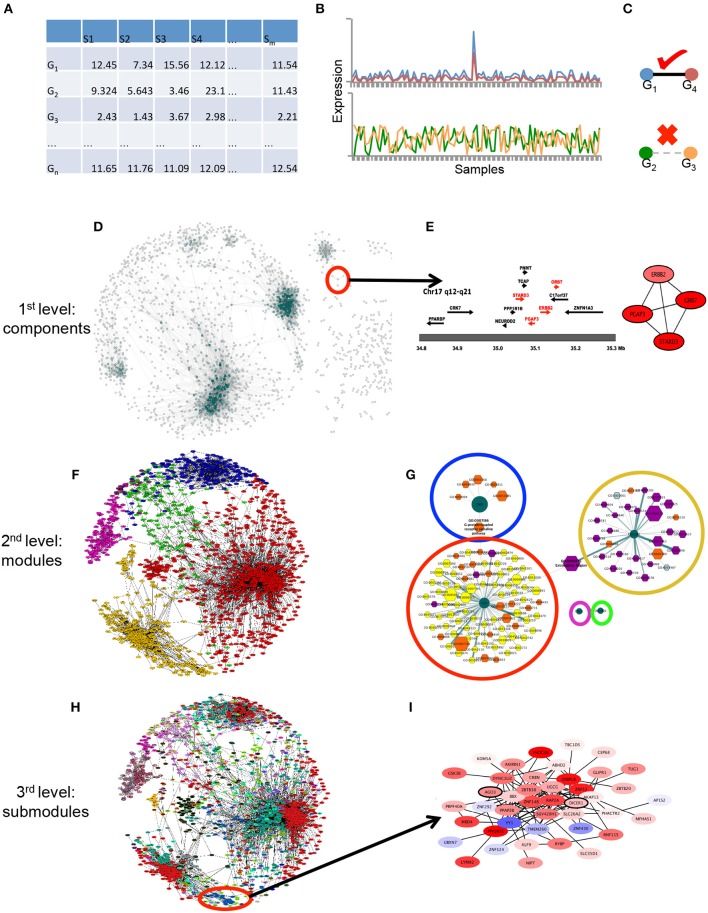
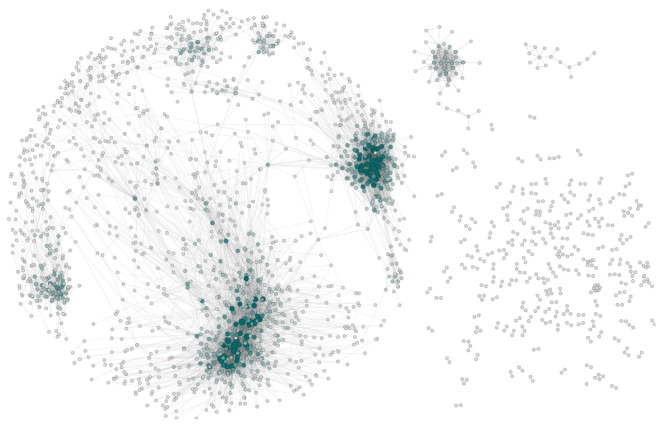
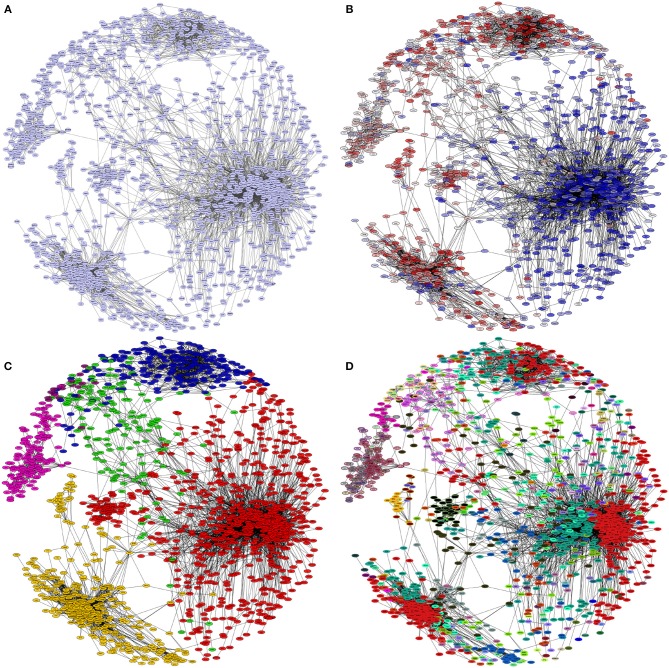
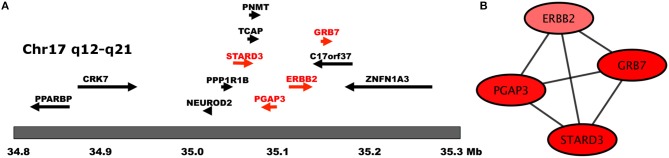
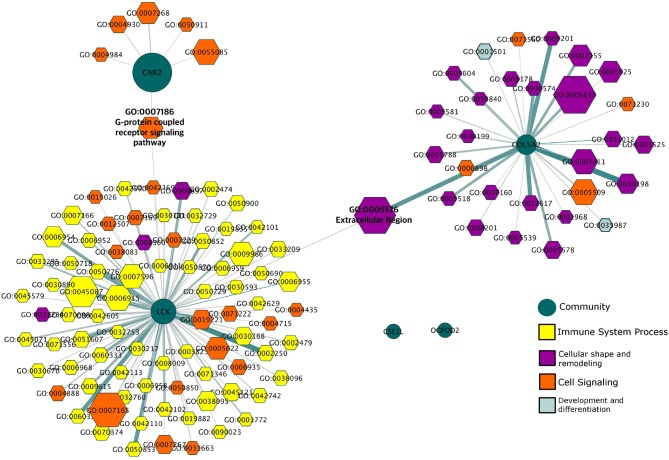
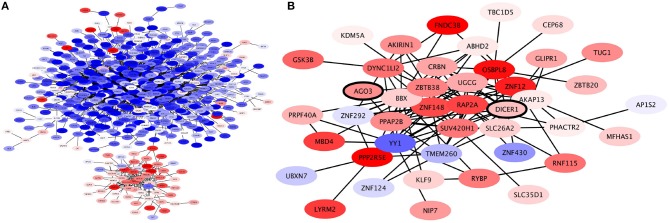
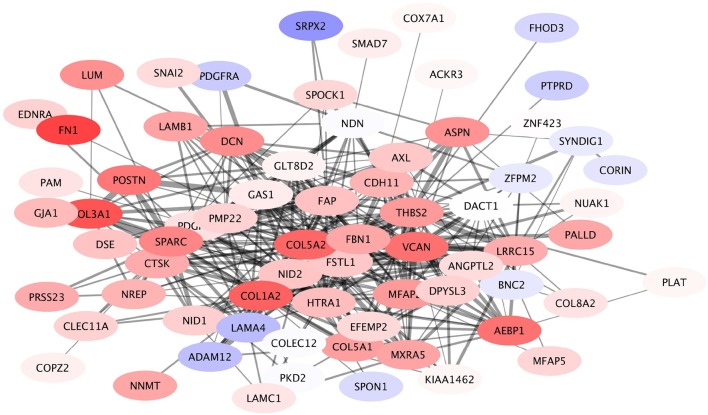
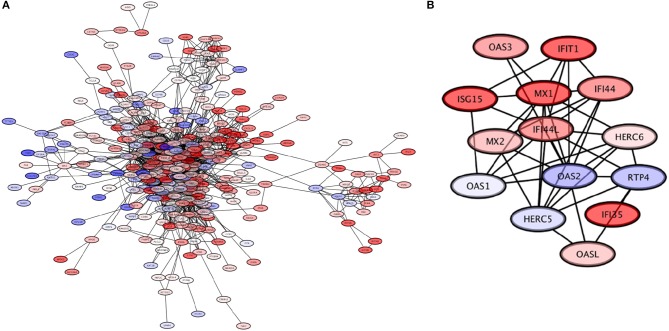
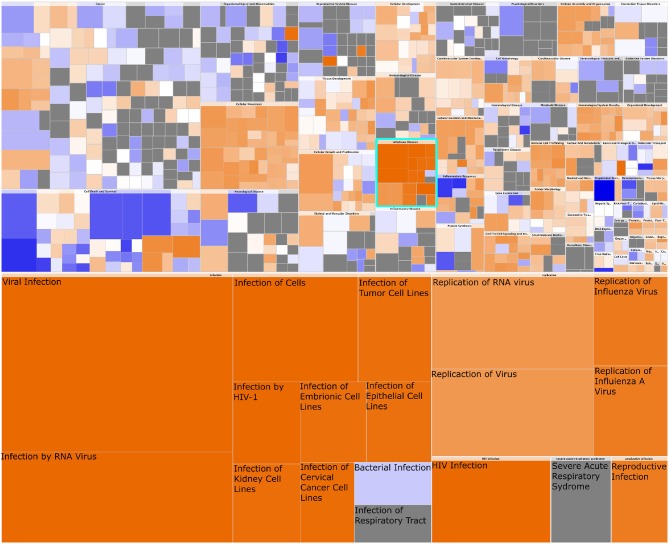
HER2-enriched breast cancer is a complex disease characterized by the overexpression of the ERBB2 amplicon. While the effects of this genomic aberration on the pathology have been studied, genome-wide deregulation patterns in this subtype of cancer are also observed. A novel approach to the study of this malignant neoplasy is the use of transcriptional networks. These networks generally exhibit modular structures, which in turn may be associated to biological processes. This modular regulation of biological functions may also exhibit a hierarchical structure, with deeper levels of modular organization accounting for more specific functional regulation. In this work, we identified the most probable (maximum likelihood) model of the hierarchical modular structure of the HER2-enriched transcriptional network as reconstructed from gene expression data, and analyzed the statistical associations of modules and submodules to biological functions. We found modular structures, independent from direct ERBB2 amplicon regulation, involved in different biological functions such as signaling, immunity, and cellular morphology. Higher resolution submodules were identified in more specific functions, such as micro-RNA regulation and the activation of viral-like immune response. We propose the approach presented here as one that may help to unveil mechanisms involved in the development of the pathology.

Keywords: breast cancer; gene regulatory networks; genetic; modular networks; molecular subtypes; signaling pathways; transcription.


Figures

Figure 1
Figure 1
Graphical pipeline. (A) Data acquisition: The gene expression matrix (samples in columns, genes in rows) is generated with HER2+ samples from the datasets used in de Anda-Jáuregui et al. (2015). (B) Gene-gene relationships: By means of mutual information between couples of genes in (A), gene expression across all samples are correlated. (C) High correlations are considered if they pass a certain threshold value (in this case the top 10,000 interactions). (D) First level of modularity: connected components. The largest level of modularity in this network is associated to certain structures, shown in (E), the amplicon in Chr17 is depicted there. (F) Second level of modularity: Infomap-derived communities. In different colors, the modules generated by the infomap algorithm are depicted. (G) The aforementioned modules are enriched with Gene Ontology categories, which apparently represent specific categories (orange, violet and yellow nodes) per module (dark green centered nodes). (H) Third level of modularity: Hierarchical map equation. In different colorsthe modules obtained in (F) are systematically separated into submodules, and these are again enriched, as observed in (I).
Figure 2
Figure 2
The network architecture of Her2+ breast cancer. The visualization shows the connected components (islands) of this network separately. In this representation nodes are colored and sized according to their node degree (i.e., the number of neighbors connected to a gene). The layout and arrangement of the network showcases the giant component (Left) and several small islands (Right).
Figure 3
Figure 3
Hierarchical levels of modularity in the HER2+ network. In each panel, the giant component of the HER2+ breast cancer network is depicted. The colors of the nodes in each panel represent different groupings: (A) all nodes are colored the same, as they belong to the same connected component. (B) Nodes are colored by expression levels (blue: underexpressed, red: overexpressed) regardless of connectivity patterns. Notice that genes are grouped together depending on the differential expression pattern. (C) Nodes are colored according to modules detected by Infomap; in (D) nodes are colored by submodules inside the modules, these submodules were detected using the hierarchical map equation.
Figure 4
Figure 4
Genes of the HER2 Amplicon. In this figure we show (A) the chromosomal location of HER2 Amplicon genes (adapted from Kauraniemi and Kallioniemi, 2006), and (B) The transcription interactions of those genes in the regulatory network. Notice that in (B), only genes belonging to the amplicon appear in said component.
Figure 5
Figure 5
Gene Ontology Categories associated with HER2+ modules. This network depicts the different biological features (hexagons) to which the modules (green circles) in the giant component of the HER2+ network are associated. Processes are colored according to the general biological function in which they participate.
Figure 6
Figure 6
Expression profile of CNR2 Community. (A) This community is roughly divided in two based on expression levels: the genes in the communities depicted on the upper side of the network are underexpressed (blue); these are genes involved in plasma-membrane associated processes. Meanwhile, the genes in the community depicted at the bottom are overexpressed; these are genes involved in intracellular signaling. (B) Expression profile of ZBTB38 Submodule of CNR2 module. Genes in this module are mostly overexpressed. Two of the genes in this submodule are DICER and AGO3, crucial elements of micro-RNA regulation (bold).
Figure 7
Figure 7
Expression profile of COL5A2 module. This submodule is composed mostly by overexpressed genes. Interestingly the underexpressed genes (depicted in light blue) have a small number of connections, compared to the number of links that the majority of overexpressed genes have.
Figure 8
Figure 8
The LCK module. (A) The LCK module, with genes colored based on their expression levels. (B) The OAS2L submodule of the LCK module, which exhibits mostly overexpressed genes; this module is involved in processes related to response to viral infection.
Figure 9
Figure 9
Heatmap of Diseases and Functions associated with HER2+ breast cancer. In this figure we observe the whole set of Diseases and Functions associated with the gene expression signature of HER2+ breast cancer. The heatmap in the upper part represents High-level functional categories: Cancer, Cellular movement, etc. Square color is the z-score of the function, it reflects the direction of change of the function, based on the differential expression of the genes in said function. Orange color represent a positive z-score, which indicates a trend toward an increase. Blue squares represent a decrease. Square size is proportional to the number of genes in said function. In turquoise is delimited the High-level category corresponding to Infectious Disease. This category is zoomed-in at the bottom of the figure. Notice that every process but bacterial infection are consistently increased, and those correspond to viral infection-related processes.

References

    1. Adamcsek B., Palla G., Farkas I. J., Derényi I., Vicsek T. (2006). Cfinder: locating cliques and overlapping modules in biological networks. Bioinformatics 22, 1021–1023. 10.1093/bioinformatics/btl039 - DOI - PubMed
    1. Alcalá-Corona S. A., De Anda Jáuregui G., Espinal-Enríquez J., Hernández-Lemus E. H.-L. (2017). Network modularity in breast cancer molecular subtypes. Front. Physiol. 8:915. 10.3389/fphys.2017.00915 - DOI - PMC - PubMed
    1. Alcalá-Corona S. A., Velázquez-Caldelas T. E., Espinal-Enríquez J., Hernández-Lemus E. (2016). Community structure reveals biologically functional modules in mef2c transcriptional regulatory network. Front. Physiol. 7:184. 10.3389/fphys.2016.00184 - DOI - PMC - PubMed
    1. Alves N. A. (2007). Unveiling community structures in weighted networks. Phys. Rev. E 76:036101. 10.1103/PhysRevE.76.036101 - DOI - PubMed
    1. Amini A. A., Chen A., Bickel P. J., Levina E. (2013). Pseudo-likelihood methods for community detection in large sparse networks. Ann. Statist. 41, 2097–2122. 10.1214/13-AOS1138 - DOI