Do current guidelines for waist circumference apply to black Africans? Prediction of insulin resistance by waist circumference among Africans living in America
- PMID: 30364383
- PMCID: PMC6195140
- DOI: 10.1136/bmjgh-2018-001057
Do current guidelines for waist circumference apply to black Africans? Prediction of insulin resistance by waist circumference among Africans living in America
Abstract
Background: To lower the risk of diabetes and heart disease in Africa, identification of African-centred thresholds for inexpensive biomarkers of insulin resistance (IR) is essential. The waist circumference (WC) thresholds that predicts IR in African men and women have not been established, but investigations recently conducted in Africa using indirect measures of IR suggest IR is predicted by WC of 80-95 cm in men and 90-99 cm in women. These WC cannot be used for guidelines until validated by direct measurements of IR and visceral adipose tissue (VAT). Therefore, we determined in a group of African-born black people living in America (A) the WC, which predicts IR and (B) the influence of abdominal fat distribution on IR.
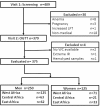
Methods: The 375 participants (age 38±10 years (mean±SD), 67% men) had IR determined by HOMA-IR and Matsuda index. VAT and subcutaneous adipose tissue (SAT) were measured by abdominal CT scans. Optimal WC for the prediction of IR was determined in sex-specific analyses by area under the receiver operating characteristic (AUC-ROC) and Youden index.
Results: Women had more SAT (203±114 vs 128±74 cm2) and less VAT than men (63±48 vs 117±72 cm2, p<0.001). Optimal WC for prediction of IR in men and women were: 91 cm (AUC-ROC: 0.80±0.03 (mean±SE)) and 96 cm (AUC-ROC: 0.81±0.08), respectively. Regression analyses revealed a significant sex-VAT interaction (p<0.001). Therefore, for every unit increase in VAT, women had a 0.94 higher unit increase in SAT and 0.07 higher unit increase in WC than men.
Conclusion: Working with a group of African-born black people living in America, we accessed technology, which validated observations made in Africa. Higher SAT at every level of VAT explained why the WC that predicted IR was higher in women (96 cm) than men (91 cm). For Africans to benefit from WC measurements, convening a panel of experts to develop evidence-based African-centred WC guidelines may be the way forward.
Keywords: Africans; insulin resistance; visceral adiposity; waist circumference.
Conflict of interest statement
Competing interests: None declared.
Figures


References
-
- IDF , 2017. IDF Diabetes Atlas - 8th Edition. http://www.diabetesatlas.org
-
- Alberti KG, Eckel RH, Grundy SM, et al. . Harmonizing the metabolic syndrome: A joint interim statement of the International Diabetes Federation Task Force on Epidemiology and Prevention; National Heart, Lung, and Blood Institute; American Heart Association; World Heart Federation; International Atherosclerosis Society; and International Association for the Study of Obesity. Circulation 2009;120:1640–5. 10.1161/CIRCULATIONAHA.109.192644 - DOI - PubMed
LinkOut - more resources
Full Text Sources
Medical
Research Materials
