

Fracture toughness testing using photogrammetry and digital image correlation
- PMID: 30364661
- PMCID: PMC6197497
- DOI: 10.1016/j.mex.2018.09.012
Fracture toughness testing using photogrammetry and digital image correlation
Abstract
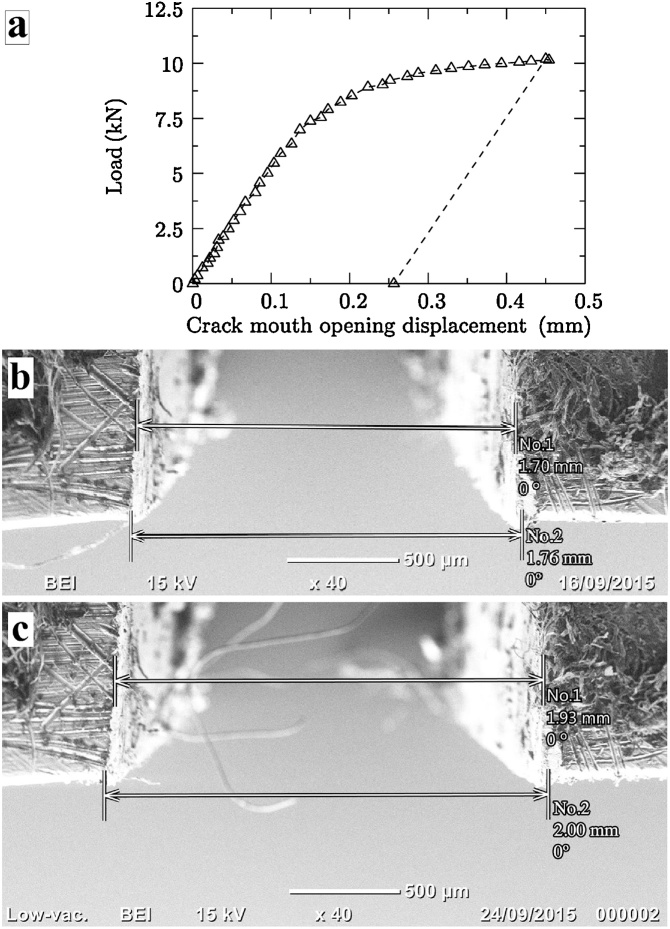
Digital image correlation (DIC) is an optical technique commonly used for measuring displacement fields by tracking artificially applied random speckle patterns, which can sometimes be a problem for tracking small-scale displacements. DIC is particularly useful for tracking the crack mouth opening displacement (CMOD) of a notched metallic specimen subjected to three-point bending for fracture toughness determination because the edges of the notch provide the required textural features for DIC without the need for speckle patterns. This simplifies the set-up process as the specimen and stage geometries do not need to account for the placement of a strain gauge. To enhance the accuracy of DIC, this study then successfully downscaled a photogrammetry technique commonly used to track crack propagation in large scale concrete tests so that the pixel coordinates of the captured images can be automatically related to their real-world coordinates, allowing for small scale displacements to be accurately tracked.
Keywords: Digital image correlation (DIC); Digital image correlation with photogrammetry; Fracture toughness; High chromium white cast iron; Metal matrix composite; Photogrammetry.
Figures


References
-
- LePage W.S., Daly S.H., Shaw J.A. Cross polarization for improved digital image correlation. Exp. Mech. 2016;56:969–985.
-
- Hild F., Roux S. Comparison of local and global approaches to digital image correlation. Exp. Mech. 2012;52:1503–1519.
-
- Pan B., Qian K., Xie H., Asundi A. Two-dimensional digital image correlation for in-plane displacement and strain measurement: a review. Meas. Sci. Technol. 2009;20:062001.
-
- Bornert M., Brémand F., Doumalin P., Dupré J.-C., Fazzini M., Grédiac M., Hild F., Mistou S., Molimard J., Orteu J.-J., Robert L., Surrel Y., Vacher P., Wattrisse B. Assessment of digital image correlation measurement errors: methodology and results. Exp. Mech. 2008;49:353–370.
-
- Pan B. Recent progress in digital image correlation. Exp. Mech. 2010;51:1223–1235.
LinkOut - more resources
Full Text Sources
Miscellaneous
