Anti-inflammatory and antioxidant effects of MOK, a polyherbal extract, on lipopolysaccharide‑stimulated RAW 264.7 macrophages
- PMID: 30365058
- PMCID: PMC6257867
- DOI: 10.3892/ijmm.2018.3937
Anti-inflammatory and antioxidant effects of MOK, a polyherbal extract, on lipopolysaccharide‑stimulated RAW 264.7 macrophages
Abstract
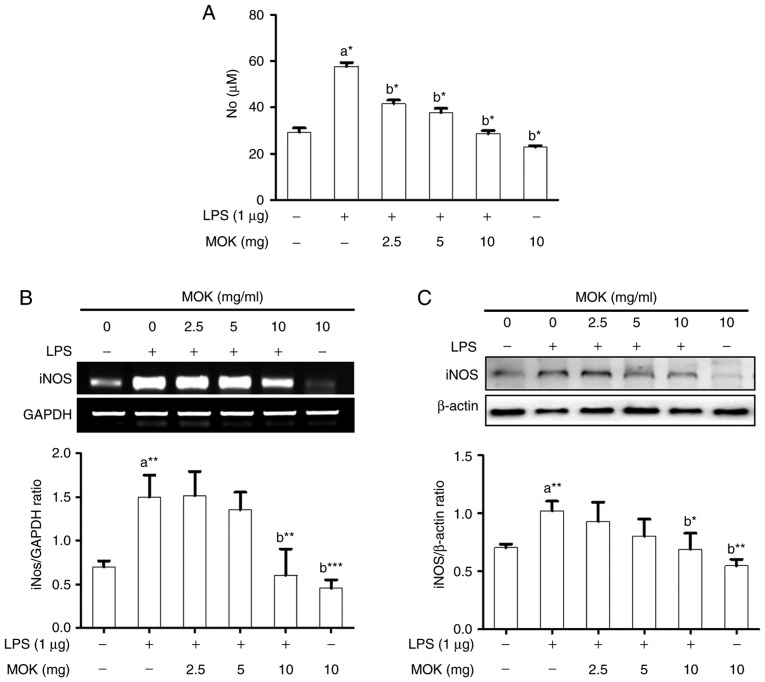
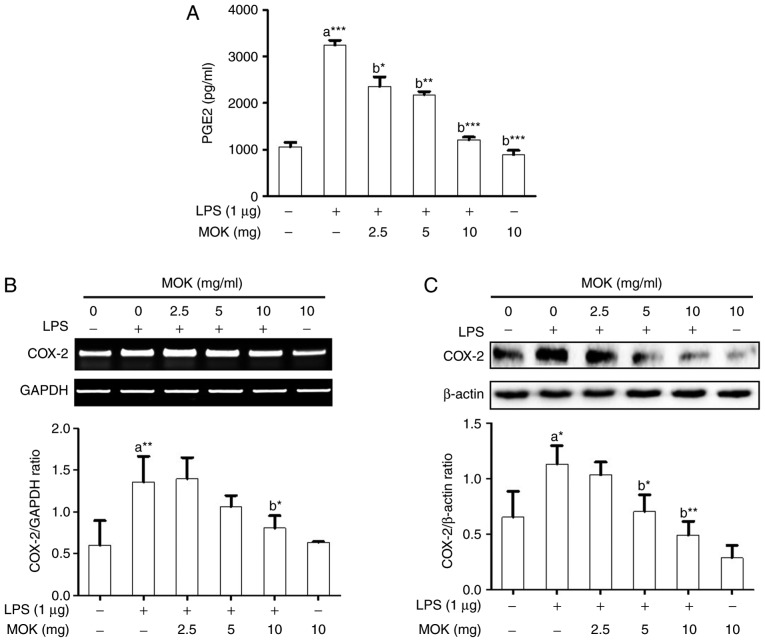
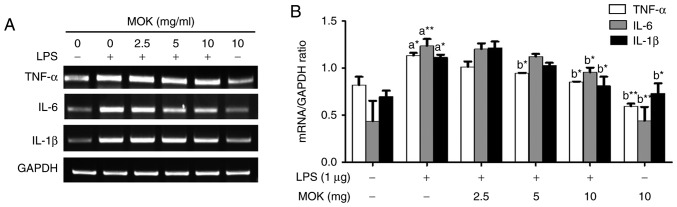
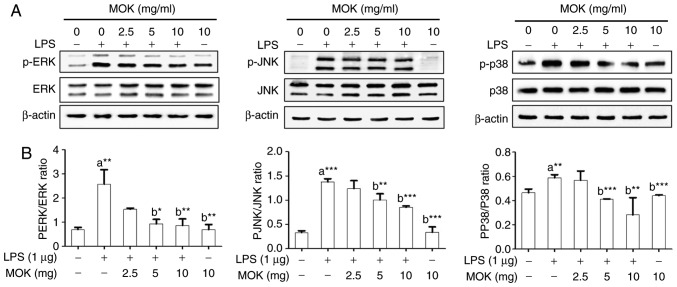
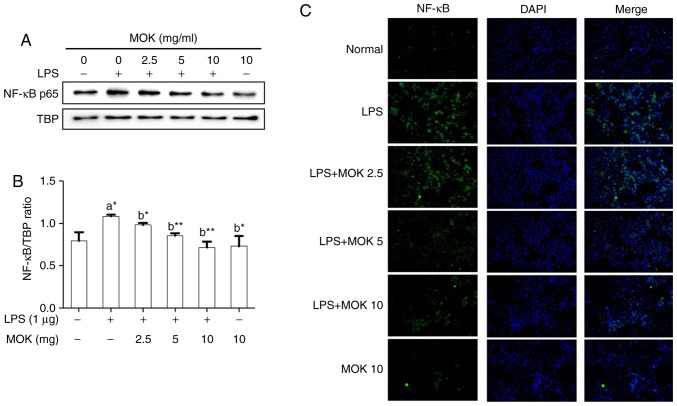
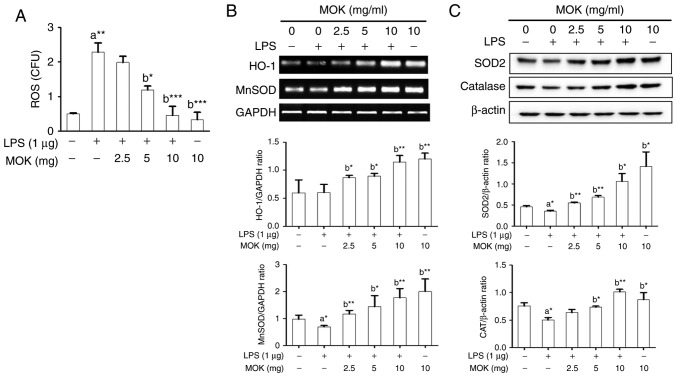
MOK, a pharmacopuncture medicine consisting of 10 herbs, has a long history as treatment for various inflammatory conditions. To investigate the mechanisms of action of MOK, its anti‑inflammatory and antioxidative effects were assessed in RAW 264.7 macrophages stimulated by lipopolysaccharide (LPS). RAW 264.7 cells were treated with different concentrations of MOK extract for 30 min prior to stimulation with or without LPS for the indicated times. Nitric oxide (NO) production was measured using Griess reagent, while the mRNA levels of inflammatory cytokines, tumor necrosis factor (TNF)‑α, interleukin (IL)‑1β, IL‑6 and the antioxidant enzymes Mn superoxide dismutase and heme oxygenase‑1, were determined using reverse transcription‑polymerase chain reaction analysis. Western blotting was used to determine the protein expression of inducible nitric oxide synthase (iNOS), cyclooxygenase (COX)‑2, superoxide dismutase (SOD)2, catalase (CAT) and heme oxygenase‑1 (HO‑1), and the phosphorylation of mitogen‑activated protein kinases (MAPKs), including ERK1/2, JNK and p38. Western blotting and immunocytochemistry were used to observe the nuclear expression of nuclear factor (NF)‑κB p65. Additionally, reactive oxygen species (ROS) and prostaglandin (PG)E2 production were determined using the ROS assay and an enzyme immunoassay. With MOK treatment, there was a notable decrease in NO and PGE2 production induced by LPS in RAW 264.7 cells by downregulation of iNOS and COX‑2 mRNA and protein expression. Furthermore, with MOK treatment, there was a decrease in the mRNA expression levels of TNF‑α, IL‑1β and IL‑6, as well as in the phosphorylation of ERK, JNK and p38 MAPK, by blocking the nuclear translocation of NF‑κB p65 in LPS‑stimulated cells. In addition, MOK treatment led to an increase in the antioxidant enzymes SOD, CAT and HO‑1 in LPS‑stimulated cells, with a concomitant decrease in ROS generation. These results indicate that the inflammatory responses in activated macrophages are inhibited by MOK through downregulation of the transcription levels of inflammatory mediators and inhibition of the MAPK/NF‑κB pathway. Moreover, MOK protects against oxidative damage by upregulating the expression of antioxidant enzymes and generating ROS scavengers.
Figures

Similar articles
-
Anti-oxidant and Anti-inflammatory Effects of Ethanol Extract from Polygala sibirica L. var megalopha Fr. on Lipopolysaccharide-Stimulated RAW264.7 Cells.Chin J Integr Med. 2023 Oct;29(10):905-913. doi: 10.1007/s11655-023-3602-7. Epub 2023 Jul 12. Chin J Integr Med. 2023. PMID: 37434032
-
Xanthii fructus inhibits inflammatory responses in LPS-stimulated RAW 264.7 macrophages through suppressing NF-κB and JNK/p38 MAPK.J Ethnopharmacol. 2015 Dec 24;176:394-401. doi: 10.1016/j.jep.2015.11.020. Epub 2015 Nov 10. J Ethnopharmacol. 2015. PMID: 26560439
-
Ethyl acetate extract from Asparagus cochinchinensis exerts anti‑inflammatory effects in LPS‑stimulated RAW264.7 macrophage cells by regulating COX‑2/iNOS, inflammatory cytokine expression, MAP kinase pathways, the cell cycle and anti-oxidant activity.Mol Med Rep. 2017 Apr;15(4):1613-1623. doi: 10.3892/mmr.2017.6166. Epub 2017 Feb 3. Mol Med Rep. 2017. PMID: 28260011 Free PMC article.
-
Anti-inflammatory and antioxidant activity of high concentrations of hydrogen in the lung diseases: a systematic review and meta-analysis.Front Immunol. 2024 Aug 15;15:1444958. doi: 10.3389/fimmu.2024.1444958. eCollection 2024. Front Immunol. 2024. PMID: 39211045 Free PMC article.
-
Antioxidant and Anti-Inflammatory Properties of Phytochemicals Found in the Yucca Genus.Antioxidants (Basel). 2023 Feb 24;12(3):574. doi: 10.3390/antiox12030574. Antioxidants (Basel). 2023. PMID: 36978823 Free PMC article. Review.
Cited by
-
Anti-inflammatory activity of flavonols via inhibiting MAPK and NF-κB signaling pathways in RAW264.7 macrophages.Curr Res Food Sci. 2022 Jul 20;5:1176-1184. doi: 10.1016/j.crfs.2022.07.007. eCollection 2022. Curr Res Food Sci. 2022. PMID: 35941847 Free PMC article.
-
Chemical Transformation of Astaxanthin from Haematococcus pluvialis Improves Its Antioxidative and Anti-inflammatory Activities.ACS Omega. 2020 Jul 22;5(30):19120-19130. doi: 10.1021/acsomega.0c02479. eCollection 2020 Aug 4. ACS Omega. 2020. PMID: 32775914 Free PMC article.
-
GC-MS based antioxidants characterization in Saussurea heteromalla (D. Don) Hand-Mazz by inhibition of nitric oxide generation in macrophages.Sci Rep. 2024 May 2;14(1):10145. doi: 10.1038/s41598-024-60577-7. Sci Rep. 2024. PMID: 38698070 Free PMC article.
-
Carnosine Protects Macrophages against the Toxicity of Aβ1-42 Oligomers by Decreasing Oxidative Stress.Biomedicines. 2021 Apr 26;9(5):477. doi: 10.3390/biomedicines9050477. Biomedicines. 2021. PMID: 33926064 Free PMC article.
-
Novel pyrrolopyrimidine derivatives: design, synthesis, molecular docking, molecular simulations and biological evaluations as antioxidant and anti-inflammatory agents.J Enzyme Inhib Med Chem. 2022 Dec;37(1):1821-1837. doi: 10.1080/14756366.2022.2090546. J Enzyme Inhib Med Chem. 2022. PMID: 35762086 Free PMC article.
References
-
- Cho SY, Yang SB, Shin HS, Lee SH, Koh JS, Kwon S, Jung WS, Moon SK, Park JM, Ko CN, Park SU. Anti-inflammatory and immune regulatory effects of acupuncture after craniotomy: Study protocol for a parallel-group randomized controlled trial. Trials. 2017;18:481. doi: 10.1186/s13063-017-2230-y. - DOI - PMC - PubMed
MeSH terms
Substances
LinkOut - more resources
Full Text Sources
Medical
Research Materials
Miscellaneous