

Bioinformatics analysis to identify key genes and pathways influencing synovial inflammation in osteoarthritis
- PMID: 30365099
- PMCID: PMC6236257
- DOI: 10.3892/mmr.2018.9575
Bioinformatics analysis to identify key genes and pathways influencing synovial inflammation in osteoarthritis
Abstract
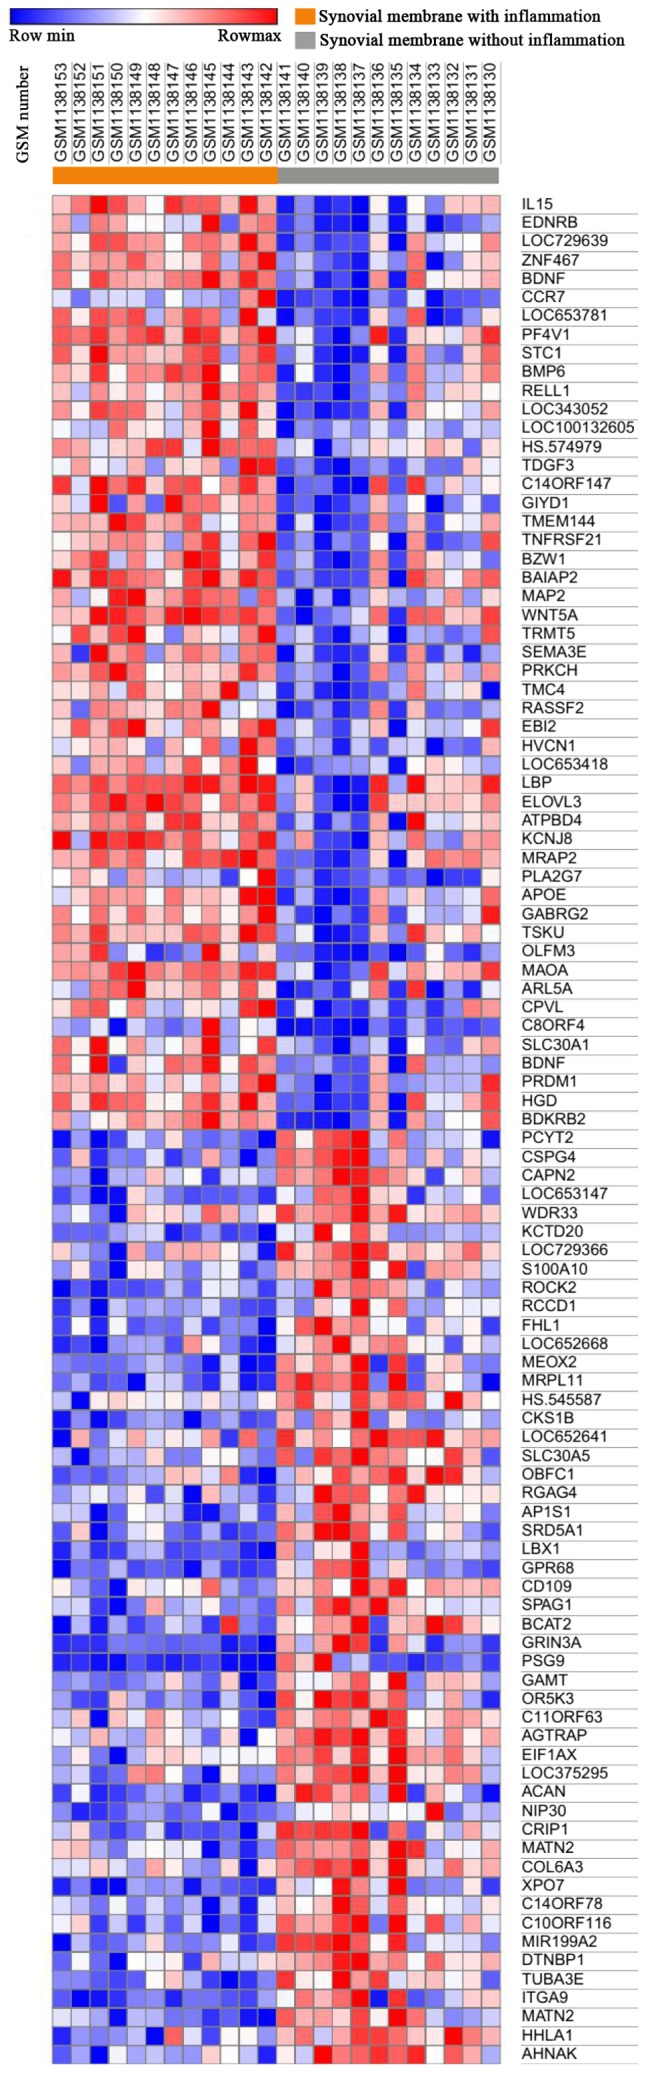
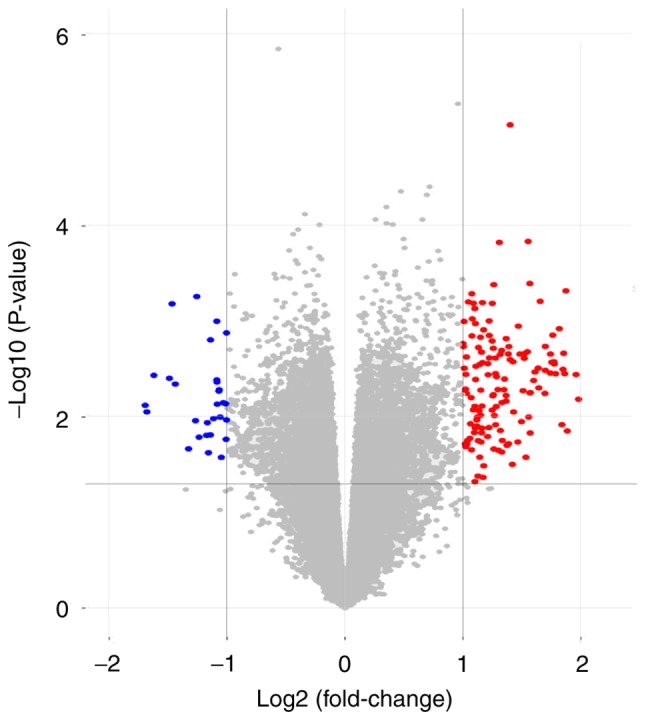
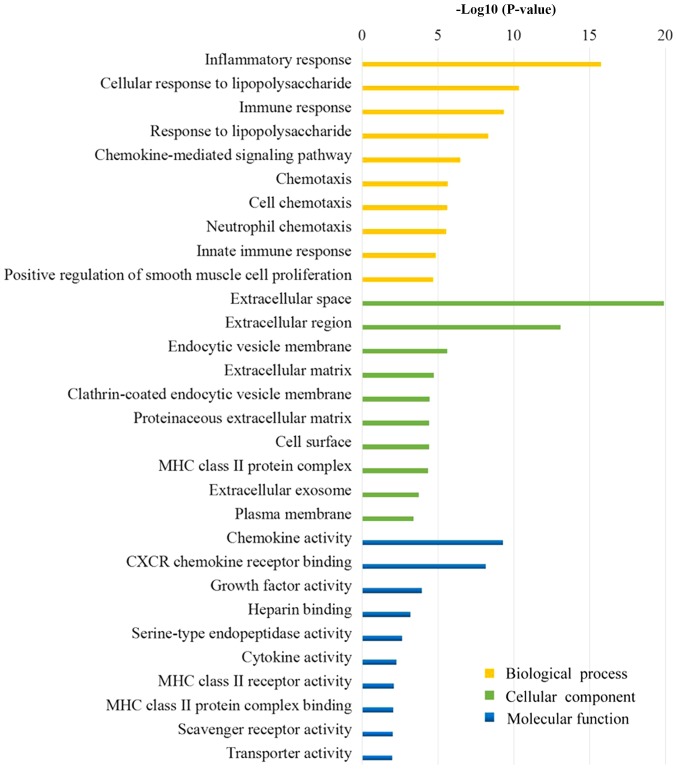
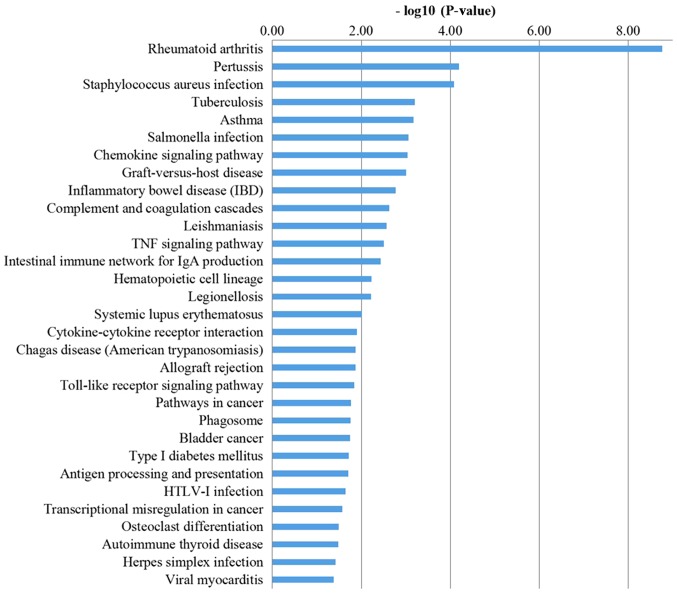
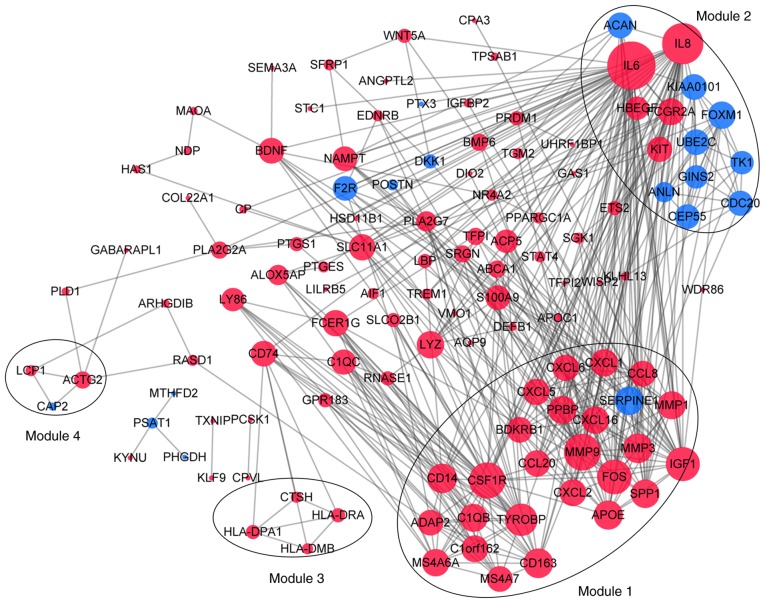
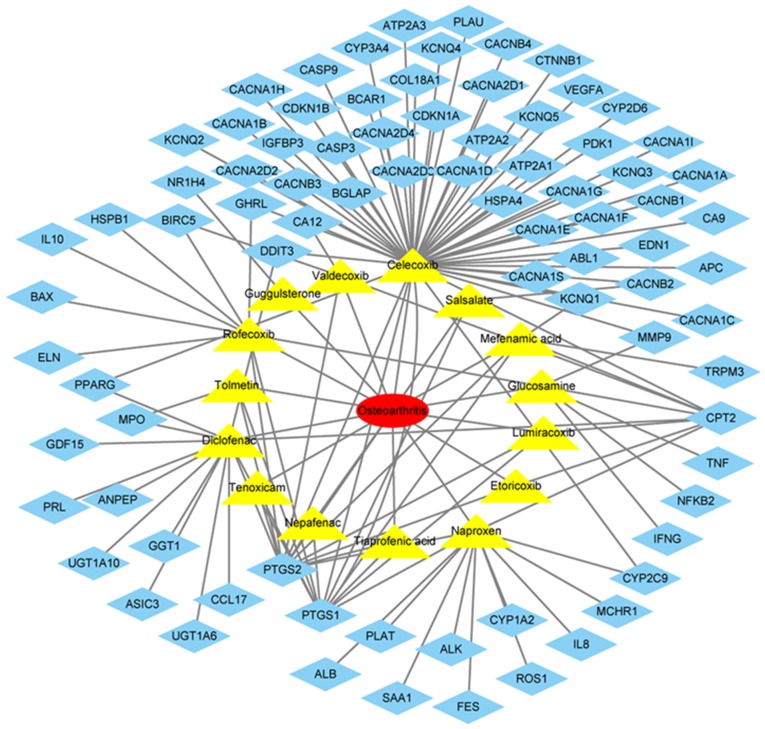
Osteoarthritis (OA) is a chronic arthropathy that occurs in the middle‑aged and elderly population. The present study aimed to identify gene signature differences between synovial cells from OA synovial membrane with and without inflammation, and to explain the potential mechanisms involved. The differentially expressed genes (DEGs) between 12 synovial membrane with inflammation and 12 synovial membrane without inflammation from the dataset GSE46750 were identified using the Gene Expression Omnibus 2R. The DEGs were subjected to enrichment analysis, protein‑protein interaction (PPI) analysis and module analysis. The analysis results were compared with text‑mining results. A total of 174 DEGs were identified. Gene Ontology enrichment results demonstrated that functional molecules encoded by the DEGs primarily had extracellular location, molecular functions predominantly involving 'chemokine activity' and 'cytokine activity', and were associated with biological processes, including 'inflammatory response' and 'immune response'. The Kyoto Encyclopedia of Genes and Genomes results demonstrated that DEGS may function through pathways associated with 'rheumatoid arthritis', 'chemokine signaling pathway', 'complement and coagulation cascades', 'TNF signaling pathway', 'intestinal immune networks for IgA production', 'cytokine‑cytokine receptor interaction', 'allograft rejection', 'Toll‑like receptor signaling pathway' and 'antigen processing and presentation'. The top 10 hub genes [interleukin (IL)6, IL8, matrix metallopeptidase (MMP)9, colony stimulating factor 1 receptor, FOS proto‑oncogene, AP1 transcription factor subunit, insulin‑like growth factor 1, TYRO protein tyrosine kinase binding protein, MMP3, cluster of differentiation (CD)14 and CD163] and four gene modules were identified from the PPI network using Cytoscape. In addition, text‑mining was used to identify the commonly used drugs and their targets for the treatment of OA. It was initially verified whether the results of the present study were useful for the study of OA treatment targets and pathways. The present study provided insight for the molecular mechanisms of OA synovitis. The hub genes and associated pathways derived from analysis may be targets for OA treatment. IL8 and MMP9, which were validated by text‑mining, may be used as molecular targets for the OA treatment, while other hub genes require further validation.
Figures
Similar articles
-
Bioinformatics Analysis and Identification of Genes and Molecular Pathways Involved in Synovial Inflammation in Rheumatoid Arthritis.Med Sci Monit. 2019 Mar 27;25:2246-2256. doi: 10.12659/MSM.915451. Med Sci Monit. 2019. PMID: 30916045 Free PMC article.
-
Identification of genes and pathways in the synovia of women with osteoarthritis by bioinformatics analysis.Mol Med Rep. 2018 Mar;17(3):4467-4473. doi: 10.3892/mmr.2018.8429. Epub 2018 Jan 15. Mol Med Rep. 2018. PMID: 29344651 Free PMC article.
-
Identification of pivotal genes and pathways in the synovial tissue of patients with rheumatoid arthritis and osteoarthritis through integrated bioinformatic analysis.Mol Med Rep. 2020 Oct;22(4):3513-3524. doi: 10.3892/mmr.2020.11406. Epub 2020 Aug 3. Mol Med Rep. 2020. PMID: 32945465
-
Gene Expression Profiling Studies Using Microarray in Osteoarthritis: Genes in Common and Different Conditions.Arch Immunol Ther Exp (Warsz). 2020 Sep 10;68(5):28. doi: 10.1007/s00005-020-00592-4. Arch Immunol Ther Exp (Warsz). 2020. PMID: 32914280 Review.
-
Elucidation of the molecular mechanism of type 2 diabetes mellitus affecting the progression of nonalcoholic steatohepatitis using bioinformatics and network pharmacology: A review.Medicine (Baltimore). 2024 Sep 13;103(37):e39731. doi: 10.1097/MD.0000000000039731. Medicine (Baltimore). 2024. PMID: 39287256 Free PMC article. Review.
Cited by
-
Machine learning-based endoplasmic reticulum-related diagnostic biomarker and immune microenvironment landscape for osteoarthritis.Aging (Albany NY). 2024 Feb 28;16(5):4563-4578. doi: 10.18632/aging.205611. Epub 2024 Feb 28. Aging (Albany NY). 2024. PMID: 38428406 Free PMC article.
-
Identification of key genes and small molecule drugs in osteoarthritis by integrated bioinformatics analysis.Biochem Biophys Rep. 2023 Mar 5;34:101450. doi: 10.1016/j.bbrep.2023.101450. eCollection 2023 Jul. Biochem Biophys Rep. 2023. PMID: 36923006 Free PMC article.
-
VEGFA, MYC, and JUN are abnormally elevated in the synovial tissue of patients with advanced osteoarthritis.Sci Rep. 2025 Jan 15;15(1):2066. doi: 10.1038/s41598-024-80551-7. Sci Rep. 2025. PMID: 39814733 Free PMC article.
-
The relationship between synovial inflammation, structural pathology, and pain in post-traumatic osteoarthritis: differential effect of stem cell and hyaluronan treatment.Arthritis Res Ther. 2020 Feb 14;22(1):29. doi: 10.1186/s13075-020-2117-2. Arthritis Res Ther. 2020. PMID: 32059749 Free PMC article.
-
Identification of the Key Role of NF-κB Signaling Pathway in the Treatment of Osteoarthritis With Bushen Zhuangjin Decoction, a Verification Based on Network Pharmacology Approach.Front Pharmacol. 2021 Apr 12;12:637273. doi: 10.3389/fphar.2021.637273. eCollection 2021. Front Pharmacol. 2021. PMID: 33912052 Free PMC article.
References
-
- Schroeppel JP, Crist JD, Anderson HC, Wang J. Molecular regulation of articular chondrocyte function and its significance in osteoarthritis. Histol Histopathol. 2011;26:377–394. - PubMed
MeSH terms
LinkOut - more resources
Full Text Sources
Medical
Molecular Biology Databases
Research Materials
Miscellaneous
