. 2019 Jan;54(1):348-360.
doi: 10.3892/ijo.2018.4603. Epub 2018 Oct 24.

Expression and epigenetic regulatory mechanism of BNIP3 in clear cell renal cell carcinoma

Affiliations

Expression and epigenetic regulatory mechanism of BNIP3 in clear cell renal cell carcinoma

Yanxiang Shao et al. Int J Oncol. 2019 Jan.

Abstract

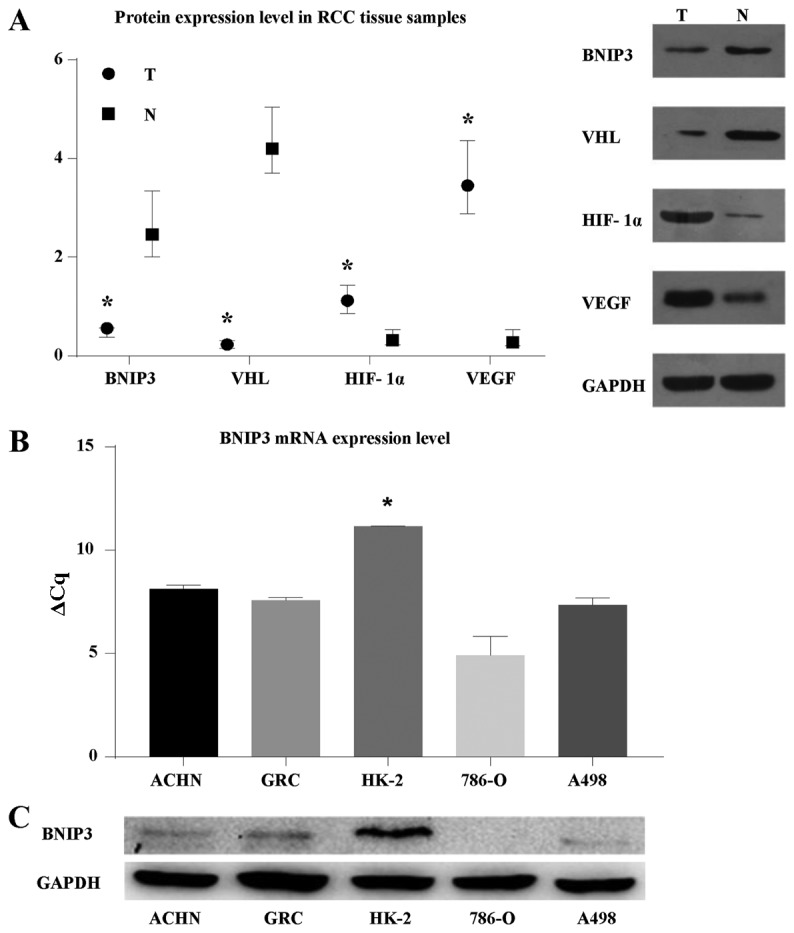
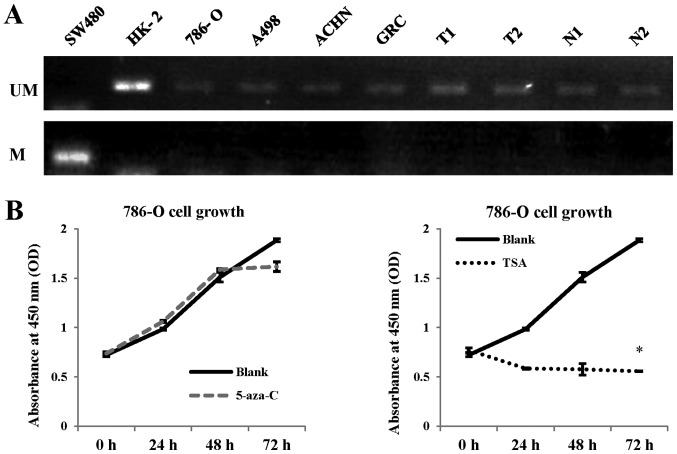
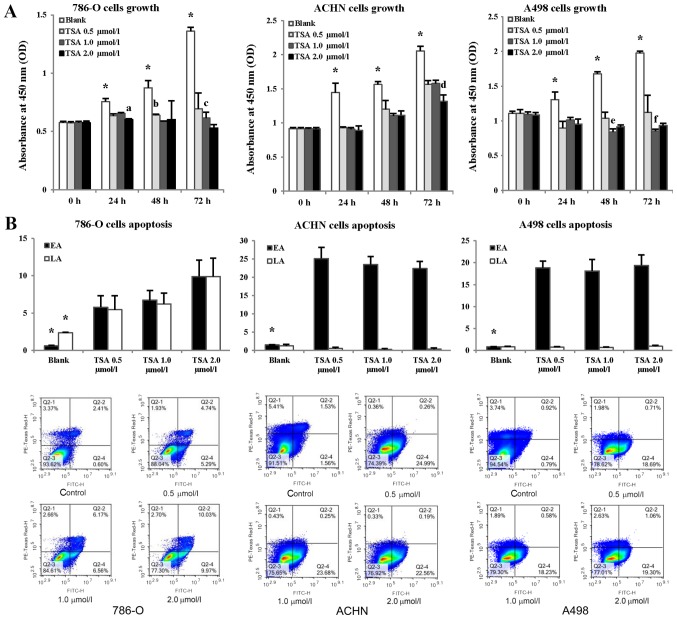
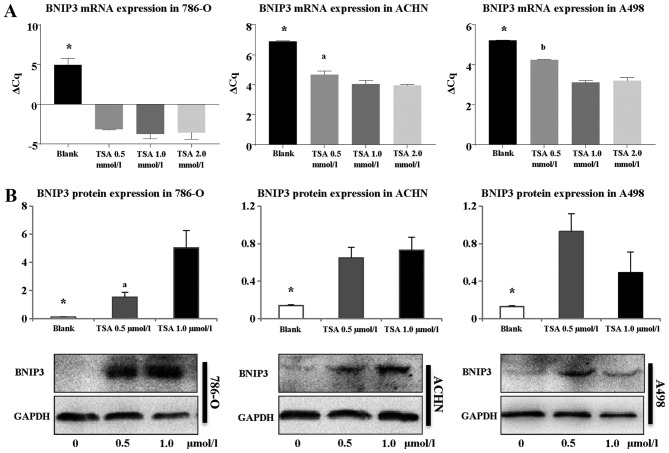
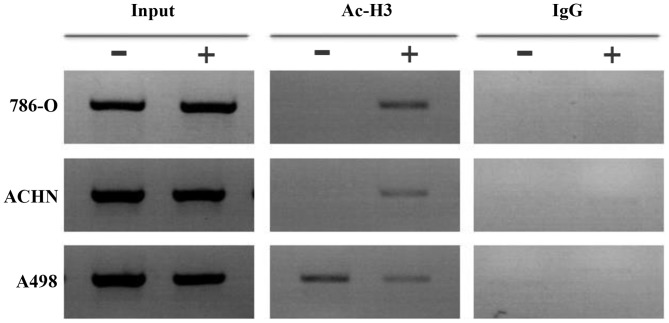
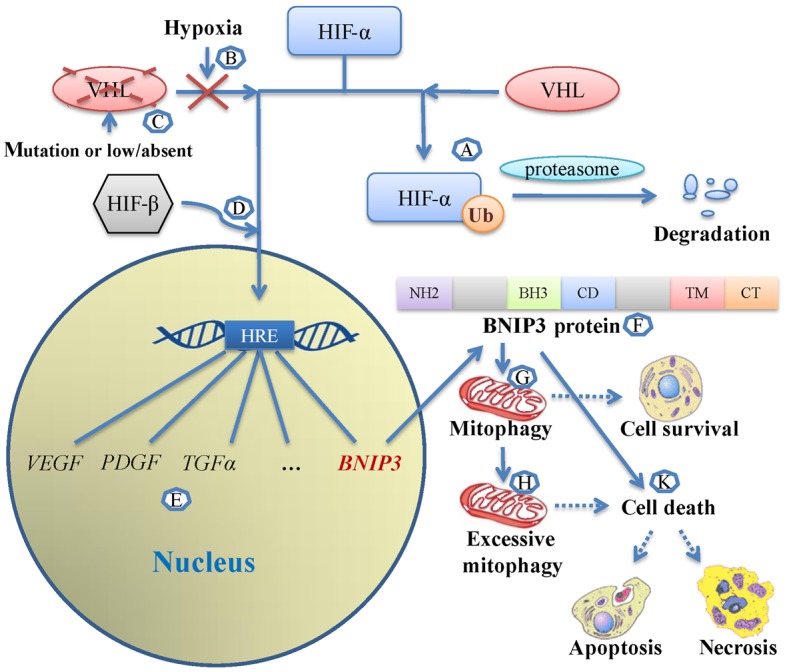
The majority of clear cell renal cell carcinomas (ccRCCs) are caused by an accumulation of hypoxia‑inducible factor (HIF) and the overexpression of downstream genes in response to the von Hippel‑Lindau (VHL) gene becoming inactivated. In the present study, our hypothesis was that BNIP3, a gene positioned downstream of HIF, would be expressed at a higher level in ccRCC; however, instead, lower levels of BNIP3 expression were identified in RCC tumor tissues compared with adjacent non‑tumor tissues. These changes were associated with lower levels of VHL, and higher levels of HIF and vascular endothelial growth factor. BNIP3 was also undetectable in three investigated RCC cell lines (786‑O, ACHN, A498) and GRC‑1‑1 cells. Methylation of the BNIP3 promoter was not detected, and neither did treatment with a methylation inhibitor cause cell proliferation. However, treatment with a histone deacetylation inhibitor, trichostatin A (TSA), inhibited cultured RCC cell proliferation, promoted apoptosis and restored BNIP3 expression. Furthermore, histone deacetylation of the BNIP3 promoter was identified in ACHN and 786‑O cells, and the acetylation status was restored following TSA treatment. Taken together, the results of the present study suggest that histone deacetylation, but not methylation, is most likely to cause BNIP3 inactivation in RCC. The data also indicated that restoration of BNIP3 expression by a histone deacetylation inhibitor led to growth inhibition and apoptotic promotion in RCC.

Keywords: carcinoma; renal cell; hypoxia-inducible factor; Bcl-2/adenovirus E1B 19 kDa interacting protein 3; BNIP3; DNA methylation; histone deacetylation; epigenetic regulation.


Figures

Figure 1
Figure 1
BNIP3 expression in ccRCC tumor tissue samples, adjacent non-tumor tissue samples, and cell lines. (A) Relative protein expression levels of BNIP3, VHL, HIF-1α, and VEGF in tumor and adjacent non-tumor tissue samples from 30 cases of ccRCC were determined by WB using the levels of GAPDH as an internal control. Data are presented as the median and interquartile range. T, tumor tissues; N, adjacent non-tumor tissues. *P<0.05 compared with adjacent non-tumor tissues. Representative examples are shown. (B) RT-qPCR, demonstrating that BNIP3 mRNA expression was significantly lower in 786-O, ACHN, A498 and GRC-1-1 RCC cells (particularly 786-O cells) compared with normal renal HK-2 cells. BNIP3 mRNA expression levels were measured as percentages of that of HK-2. *P<0.05 compared with ACHN, GRC-1-1, 786-O, A498 cells. (C) BNIP3 protein levels in 786-O, ACHN, A498, GRC-1-1, and HK-2 cells were evaluated by WB, with GAPDH as a control. A representative example is shown. WB, western blotting; VHL, Hippel Lindau; HIF-1α, hypoxia-inducible factor-1α; VEGF, vascular endothelial growth factor; ccRCC, clear cell renal cell carcinoma; RT-qPCR, reverse transcription-quantitative polymerase chain reaction.
Figure 2
Figure 2
Methylation status of the BNIP3 promoter in RCC cells. (A) Methylation-specific PCR analysis of the colorectal cancer cell line, SW480, the normal renal cell line, HK-2, the RCC cell lines, 786-O, A498, ACHN, and GRC-1-1, and RCC tumor tissues (T) and adjacent non-tumor tissues (N) from 30 cases with RCC. The BNIP3 promoter was methylated in SW480 cells, which was set as a positive control. No methylation was observed in the HK-2 cells or in the 30 samples of RCC adjacent non-tumor tissues; this was also the case for the 786-O, A498, ACHN, and GRC-1-1 cell lines, and 30 samples of RCC tumor tissues (two representative cases are presented here). M, methylated; UM, unmethylated. (B) 786-O cells, which showed the lowest expression levels of BNIP3 among the four RCC cell lines investigated, were cultured with or without 5-aza-C or TSA for 72 h. Cells treated with no drugs were set as a blank control. Tumor cell proliferation was examined using the Cell Counting Kit-8. No significant differences were found between the 5-aza-C group and the untreated group; however, TSA significantly inhibited RCC cell growth compared with the blank group. *P<0.05 compared with the blank group. 5-aza-C, 5-aza-cytidine; TSA, trichostatin A; RCC, renal cell carcinoma; PCR, polymerase chain reaction.
Figure 3
Figure 3
Evaluation of RCC cell proliferation and apoptosis following treatment with TSA. (A) 786-O, ACHN, and A498 cells were treated with different concentrations of TSA (0.5, 1.0, and 2.0 µmol/l). Untreated cells were used as the control group (blank), and cell proliferation was evaluated using Cell Counting Kit-8 assay every 24 h for 72 h. *P<0.05 compared with each TSA-treated group; aP<0.05 compared with TSA 0.5 and 1.0 µmol/l treatment groups for 786-O after 24 h treatment; bP<0.05 compared with the TSA 1.0 µmol/l treatment group for 786-O after 48 h treatment; cP<0.05 compared with the TSA 2.0 µmol/l treatment group for 786-O after 72 h treatment; dP<0.05 compared with the TSA 0.5 and 1.0 µmol/l treatment groups for ACHN after 72 h treatment; eP<0.05 compared with the TSA 0.5 and 2.0 µmol/l treatment groups for A498 after 48 h treatment; fP<0.05 compared with the TSA 2.0 µmol/l treatment group for A498 after 72 h treatment. (B) Three cells lines were treated with TSA at different concentrations, and untreated cells were used as controls (blank). Apoptosis was evaluated using Annexin V-FITC flow cytometric analysis, with concentration of cells for flow cytometry was 2×10⁵/ml. FITC-H binds to Annexin V, an increase of which indicates elevated EA, whereas PE-Texas Red H binds propidium iodide, an increase of which indicates elevated LA. Histograms show the apoptotic status of RCC cells. *P<0.05 compared with each TSA treatment group. Representative flow cytometric scatter plots are presented under the histograms. Each quarter in the coordinate system represents a different cell status, and the proportional change in each quarter reflects the effect of TSA treatment on cells. Q2-1, cells that have sustained mechanical injury; Q2-2, late apoptotic and necrotic cells; Q2-3, normal cells; Q2-4, early apoptotic cells. EA, early apoptosis; LA, late apoptosis; RCC, renal cell carcinoma; TSA, trichostatin A; FITC, fluorescein isothiocyanate.
Figure 4
Figure 4
BNIP3 expression in 786-O, A498, and ACHN cells following treatment with TSA. (A) Expression of BNIP3 mRNA in 786-O, ACHN and A498 cells was quantified by RT-qPCR after treatment with TSA for 24 h. The untreated controls (blank) for each of the three cell lines were assigned a relative value of 1. *P<0.05 compared with treatment groups (aP<0.05 compared with TSA 1.0 and 2.0 µmol/l treatment groups for ACHN cells; bP<0.05 compared with TSA 1.0 and 2.0 µmol/l treatment groups for A498 cells). (B) BNIP3 protein levels in 786-O, ACHN, and A498 cells following TSA treatment for 48 h were examined by western blotting. GAPDH was used as an internal control, and cells cultured without TSA were considered as untreated controls (Blank). *P<0.05 compared with treatment groups (aP<0.05 compared with the TSA 1.0 µmol/l treatment group). Representative bands are presented under the histograms. TSA, trichostatin A; RT-qPCR, reverse transcription-quantitative polymerase chain reaction.
Figure 5
Figure 5
Deacetylation status of the BNIP3 promoter in 786-O, A498 and ACHN cells before and after TSA treatment. Chromatin immunoprecipitation was used to evaluate the deacetylation status of the BNIP3 promoter. The treatment group was treated with 1.0 µmol/l TSA for 48 h. Input DNA was used as a positive control, and extracts were incubated with IgG as a negative control. Ac-H3, polyclonal antibody against acetylated histone H3; -, non-TSA-treatment group; +, TSA-treatment group; TSA, trichostatin A; IgG, immunoglobulin G.
Figure 6
Figure 6
Mechanistic aspects of the VHL-HIF-BNIP3 signaling pathway. Step A: The binding of HIF-α to VHL and to the E3 ligase complex causes HIF-α to be ubiquitinated and marked for degradation by the cell’s proteasomal complex. Step B: In a hypoxic environment, HIF-α cannot bind the VHL protein, and consequently cannot be degraded. Step C: Aberrant functioning of VHL also leads to an accumulation of HIFα. Step D: HIF-α levels rise in the cell, allowing the protein to bind with HIFβ. The HIF-α/β heterocomplex may be translocated to the nucleus and bind to specific HREs. Step E: HREs activates downstream genes, including VEGF, PDGF, TGFα, and several others, which have important roles in tumor growth and progression. BNIP3 can also be activated by HREs. Step F: Structure of the BNIP3 protein: NH2, N-terminal domain; BH3, Bcl-2 homology domain 3; CD, conserved domain; TM, transmembrane domain; CT, COOH-terminal domain; Step G: BNIP3 can induce mitochondrial autophagy in response to environmental changes to promote cell survival. Step H: Under seriously detrimental environmental conditions, excessive mitochondrial autophagy is induced, leading to apoptosis. Step K: BNIP3-induced cell death is also activated under conditions of extreme hypoxia, acidosis and NO. Ub, ubiquitin; HRE, hypoxia-response element; VHL, Hippel-Lindau; HIF-1(α/β), hypoxia-inducible factor-1(α/β); VEGF, vascular endothelial growth factor; PDGF, platelet-derived growth factor; TGFα, transforming growth factor α.

References

    1. Subramanian VS, Stephenson AJ, Goldfarb DA, Fergany AF, Novick AC, Krishnamurthi V. Utility of preoperative renal artery embolization for management of renal tumors with inferior vena caval thrombi. Urology. 2009;74:154–159. doi: 10.1016/j.urology.2008.12.084. - DOI - PubMed
    1. Clark PE. The role of VHL in clear-cell renal cell carcinoma and its relation to targeted therapy. Kidney Int. 2009;76:939–945. doi: 10.1038/ki.2009.296. - DOI - PMC - PubMed
    1. Motzer RJ, Hutson TE, Tomczak P, Michaelson MD, Bukowski RM, Rixe O, Oudard S, Negrier S, Szczylik C, Kim ST, et al. Sunitinib versus interferon alfa in metastatic renal-cell carcinoma. N Engl J Med. 2007;356:115–124. doi: 10.1056/NEJMoa065044. - DOI - PubMed
    1. Bultitude MF. Campbell-Walsh Urology. 10th edition. BJU International; New York, NY: 2012.
    1. Guo K, Searfoss G, Krolikowski D, Pagnoni M, Franks C, Clark K, Yu KT, Jaye M, Ivashchenko Y. Hypoxia induces the expression of the pro-apoptotic gene BNIP3. Cell Death Differ. 2001;8:367–376. doi: 10.1038/sj.cdd.4400810. - DOI - PubMed

MeSH terms