. 2018 Oct 26;14(10):e1007676.
doi: 10.1371/journal.pgen.1007676. eCollection 2018 Oct.

3 minutes to precisely measure morphogen concentration

Affiliations

3 minutes to precisely measure morphogen concentration

Tanguy Lucas et al. PLoS Genet. .

Abstract

Morphogen gradients provide concentration-dependent positional information along polarity axes. Although the dynamics of the establishment of these gradients is well described, precision and noise in the downstream activation processes remain elusive. A simple paradigm to address these questions is the Bicoid morphogen gradient that elicits a rapid step-like transcriptional response in young fruit fly embryos. Focusing on the expression of the major Bicoid target, hunchback (hb), at the onset of zygotic transcription, we used the MS2-MCP approach which combines fluorescent labeling of nascent mRNA with live imaging at high spatial and temporal resolution. Removing 36 putative Zelda binding sites unexpectedly present in the original MS2 reporter, we show that the 750 bp of the hb promoter are sufficient to recapitulate endogenous expression at the onset of zygotic transcription. After each mitosis, in the anterior, expression is turned on to rapidly reach a plateau with all nuclei expressing the reporter. Consistent with a Bicoid dose-dependent activation process, the time period required to reach the plateau increases with the distance to the anterior pole. Despite the challenge imposed by frequent mitoses and high nuclei-to-nuclei variability in transcription kinetics, it only takes 3 minutes at each interphase for the MS2 reporter loci to distinguish subtle differences in Bicoid concentration and establish a steadily positioned and steep (Hill coefficient ~ 7) expression boundary. Modeling based on the cooperativity between the 6 known Bicoid binding sites in the hb promoter region, assuming rate limiting concentrations of the Bicoid transcription factor at the boundary, is able to capture the observed dynamics of pattern establishment but not the steepness of the boundary. This suggests that a simple model based only on the cooperative binding of Bicoid is not sufficient to describe the spatiotemporal dynamics of early hb expression.


Conflict of interest statement

The authors have declared that no competing interests exist.

Figures

Fig 1
Fig 1. The Bicoid system transforms the gradual information contained in the Bicoid concentration gradient into a step-like response in 30 min.
A) At nc 8 (T = 1 hr), the Bicoid exponential gradient (red) is steadily established [5, 6] with its highest concentration at the anterior pole (A) and its lowest concentration at the posterior pole (P). The first hints of zygotic transcription are detected by RNA FISH marking the onset of zygotic transcription [15]. B) At nc 11 (T = 1 hr 30 min), the main Bicoid target gene, hunchback (hb), is expressed within a large anterior expression domain. hb expression is schematized here from RNA FISH data [15]: nuclei where ongoing transcription at the hb loci is detected are shown in green and nuclei silent for hb are shown in white.
Fig 2
Fig 2. Posterior expression of the hb-MS2 reporters is Zelda dependent.
A) Dual RNA FISH using a hb probe (green) and an MS2 (orange) probe on wild-type embryos carrying one copy of the hb-MS2 reporter, placing the MS2-CFP-SKL-K10 cassette under the control of the 750 bp canonical promoter of hb [26]. B-D) Embryos are wild-type (B), from heterozygous mutant females for Zelda (C) or germline mutant clones for Zelda (D). Top panels: Expression map of cycle 11 embryos after segmentation of nuclei and automated processing of FISH staining. Nuclei expressing only hb are labelled in green, nuclei expressing only the hb-MS2 reporter are labelled in orange and nuclei expressing both hb and the hb-MS2 reporter are labelled in yellow. Bottom panels: On the left, density of active nuclei for either hb (green) or the hb-MS2 reporter (orange) along the AP axis with the anterior pole on the left (0) and the posterior pole on the right (100). On the right, density of active nuclei for the hb-MS2 reporter (orange) and hb (green) in the posterior domain. For each embryo, the position of the expression boundary is calculated as the position of the maximal derivative of the active nuclei density curve. Mean values were calculated for n embryos and error bars correspond to standard deviation.
Fig 3
Fig 3. Posterior expression of the hb-MS2 reporters is mediated in cis by the MS2 cassette.
A) Structures of the hb expressing loci and relative positioning of the hb probe (green) or the MS2 probe (orange) hybridizing to the transcripts. The hb-18kb BAC encompasses 18 kb of chromosome III spanning the hb locus. The 1.3kb MS2 cassette is inserted in the hb-18kb BAC within the intron of hb, 0.7kb downstream the transcription start site (5’MS2-hb-18kb BAC, top right) or within the 3’UTR of hb, ~ 3 kb downstream of the transcription start site (3’MS2-hb-18kb BAC, bottom right). All the BACs are inserted at the same position (VK18, chromosome II) within the fly genome. B) Top: Expression map of a typical nc11 embryo heterozygous for the hb-18kb BAC insertion. As highlighted on one example (bottom), nuclei in the anterior exhibit three sites of ongoing transcription detected with the hb probe: two of these sites correspond to expression at the endogenous hb loci and one of them corresponds to expression at the hb-18kb BAC locus. No expression is detected in the posterior. (C-D) Embryos are homozygous for the 5’MS2-hb-18kb BAC insertion (C) or heterozygous for the 3’MS2-hb-18kb BAC insertion (D). Top: Expression map of a typical nc11 embryo detected with the hb probe (green) and with the MS2 probe (orange). Bottom: close-up of single nuclei in the anterior (left) and the posterior (right). E) Mean density of active nuclei in the posterior detected by the hb probe (green) or by the MS2 probe (orange) on nc11 embryos carrying the hb-18kb BAC (hb-18kb), the 5’MS2-hb-18kb BAC (5’MS2) or the 3’MS2-hb-18kb BAC (3’MS2) insertion. Mean values are calculated for n embryos and error bars correspond to standard deviation.
Fig 4
Fig 4. Zelda putative binding sites in the MS2 cassette.
A) Position weight matrix of the Zelda binding site [34]. The critical positions in the canonical Zelda site CAGGTAG are highlighted in bold. B) The 24 MS2 stem loop repeat corresponds to 12 tandem repetitions of the two MS2 repeats shown. In this sequence, the MS2 loops (red) are separated by either a short (purple) or a long (green) linker. The short linker contains one CAGGTCG sequence which harbors a single but critical mismatch with the canonical Zelda site. The long linker contains one TAGGTAC and one TAGGCAA which harbor respectively two or three permissive (not critical) mismatches with the canonical Zelda site.
Fig 5
Fig 5. The hb canonical promoter expresses the MS2ΔZelda cassette in an anterior domain with a steep posterior boundary.
(A) A 2D maximum projection snapshot from Movie3 (SI) was taken at ~7 minutes after the onset of nc12 interphase. In the green channel, MCP-GFP proteins recruited by the nascent MS2-containing mRNA can be seen accumulating at the hb-MS2ΔZelda loci (bright spots). In the red channel, the mRFP-Nup proteins localized at the nuclear envelope delineate nuclei. (B-D) Probability of active hb-MS2ΔZelda loci along the AP axis (dashed blue lines with error bars), extracted from snapshots of 6 movies near the end of each nuclear cycle: 360 s after the onset of nc11 interphase (B), 420 s after the onset of nc12 interphase (C) and 500 s after the onset of nc13 interphase (D). In each panel the probability of active endogenous hb loci (black dashed lines with error bars) extracted from the FISH data from [3] is also shown. Hill coefficients (H) are indicated in blue (hb-MS2 reporter) or in black (endogenous hb from FISH data). In B, the difference between the FISH signal and the probability of active hb-MS2ΔZelda loci is due to small number of nuclei and large variability distance between them at nc11 which limit statistics.
Fig 6
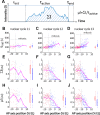
Fig 6. Distribution of time trace features along AP axis.
(A) Description of the time trace features. Initiation time (tinit, B-D), normalized integral spot intensity (ΣI, E-G) and production rate (μl, H-J) are indicated as a function of position along the AP axis with the origin fixed for each embryo at the position of the expression boundary at nc12. Embryos were at nc11 (B, E and H), nc12 (C, F and I) and nc13 (D, G and J). The vertical dashed line indicates when the significant change in the feature distribution from the anterior pole is first detected in nc13, using the Kolmogorov-Smirnoff test (p-value 0.05). This line separates the hb expression domain into 2 zones: the anterior zone which exhibits a saturating process (red box) and the boundary zone which exhibit a more stochastic activity characterized by more variability (blue box). On the right of each panel (B-J), the distribution of the two populations is shown (median ± 25% and min/max). Example of MS2-MCP time traces are given in S1 Fig, S2 Fig and S3 Fig. Data were obtained from 5 (nc11), 8 (nc12) and 4 (nc13) embryos. All nc11 and nc12 traces were recorded for the whole duration of the cycle. Embryos were aligned spatially fixing the origin of the axis at the boundary position (PON = 0.5) at nc12 and the origin of time was calculated for each nuclei as the origin of the respective nuclear cycle (see S2 Text and S4 Fig). For tinit, the data points are for expressing nuclei only, whereas for ΣI and μl both expressing and non-expressing nuclei were taken into account.
Fig 7
Fig 7. The dynamics of hb-MS2ΔZelda expression pattern.
A-C: The probability for a given locus to be ON (PSPOT(t)) is indicated by a heat map (color scale on the right where PSPOT(t) = 0 is black and PSPOT(t) = 1 is white) horizontally as a function of position along the AP axis (0% EL positioned where PON = 0.5 at nc12) and vertically as a function of time (s) fixing the origin at the onset of interphase for each nucleus (see details in S2 Text and S4 Fig). The top panel shows the endogenous hb expression pattern as measured from RNA FISH (15). For each cycle (A: nc11; B: nc12; C: nc13), the end of interphase (onset of the next mitosis) is indicated by a dashed line (white). The green dashed line indicates the position of the expression boundary (PSPOT(t) = 0.5) over time. D-F: PSPOT(t) as a function of position along the AP axis for different times during the interphase of nc11 (D), nc12 (E) and nc13 (F). G: PSPOT(t) as a function of time (s) at the mid-boundary position (where PSPOT(t) reaches a steady value of 0.5). The first hints of transcription are observed at the mid-boundary position ~ 150 s after the onset of the interphase (lower limit of the light blue zone) and steady state is reached at ~ 330 s (higher limit of the light blue zone). The boundary formation reaches steady state in ~ 180 s. Data were obtained from 5 (nc11), 8 (nc12) and 4 (nc13) embryos. Embryos were aligned spatially by fixing the origin of the axis (0% EL) at the boundary position (PON = 0.5) at nc12 and the origin of time was calculated for each nuclei as the origin of the respective nuclear cycle (see S2 Text and S4 Fig).
Fig 8
Fig 8. Modeling transcriptional regulation by the Bicoid transcription factor through interactions with the hb promoter operator sites.
A) A model of regulation by Bicoid transcription factor (TF) binding to multiple binding sites on the hb promoter coupled with stochastic transcription initiation. Transcription initiation is allowed only when the binding sites are fully bound. During this window, RNAP can randomly bind to the promoter and initiate transcription to produce mRNA. B or D) The model prediction for the probability of an active transcription locus (PSPOT(t), colorbar) as a function of time in the nuclear cycle and position along the AP axis for a model with 6 (B) or 9 (D) Bicoid binding sites. C or E) The simulated pattern evolution of PSPOT(t) along the AP axis over time (colored line), shown with the pattern predicted at steady state (solid black line) and the stable pattern extracted from the data in nc13 (dashed black line, as in Fig 7F). Panels C and E represent cuts in time of panels B and D, respectively. The kinetic parameters were chosen so as to match the observed hb pattern steepness and formation time at the boundary (PSPOT(t) = 0.5) (see S2 Table). The value of PSPOT(t) is calculated from 200 trajectories per AP position.

Similar articles

Cited by

References

    1. Rogers KW, Schier AF. Morphogen gradients: from generation to interpretation. Annu Rev Cell Dev Biol. 2011;27:377–407. 10.1146/annurev-cellbio-092910-154148 - DOI - PubMed
    1. Stathopoulos A, Iber D. Studies of morphogens: keep calm and carry on. Development. 2013;140(20):4119–24. 10.1242/dev.095141 - DOI - PMC - PubMed
    1. Porcher A, Dostatni N. The Bicoid morphogen system. Current Biology 2010;20(5):R249–R54. 10.1016/j.cub.2010.01.026 - DOI - PubMed
    1. Driever W, Nusslein-Volhard C. A gradient of bicoid protein in Drosophila embryos. Cell. 1988;54(1):83–93. - PubMed
    1. Abu-Arish A, Porcher A, Czerwonka A, Dostatni N, Fradin C. Fast mobility of Bicoid captured by flourescent correlation spectroscopy: implication for the rapid establishment of its gradient Biophysical Journal. 2010;99:L33–L5. 10.1016/j.bpj.2010.05.031 - DOI - PMC - PubMed

Publication types

MeSH terms