

Immune diversity sheds light on missing variation in worldwide genetic diversity panels
- PMID: 30365549
- PMCID: PMC6203392
- DOI: 10.1371/journal.pone.0206512
Immune diversity sheds light on missing variation in worldwide genetic diversity panels
Abstract
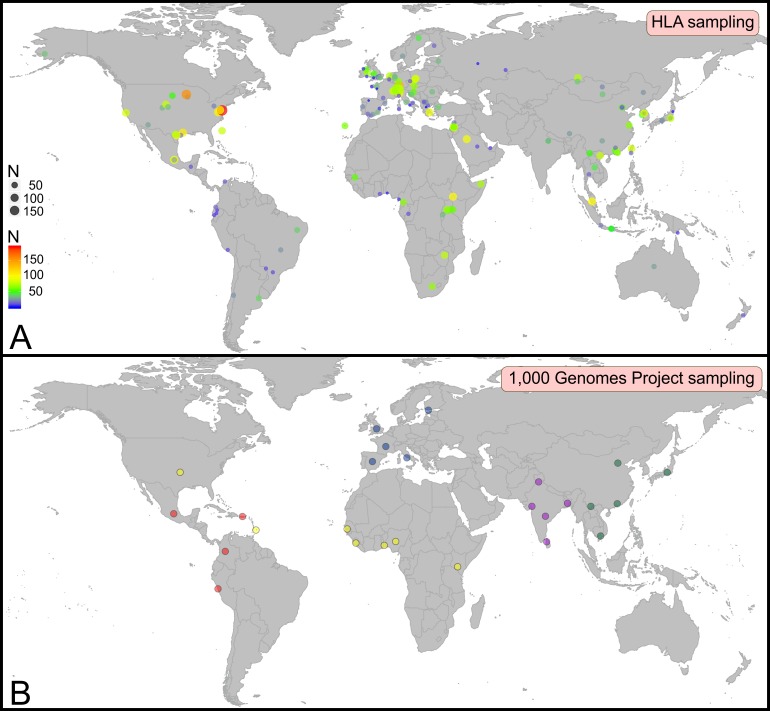
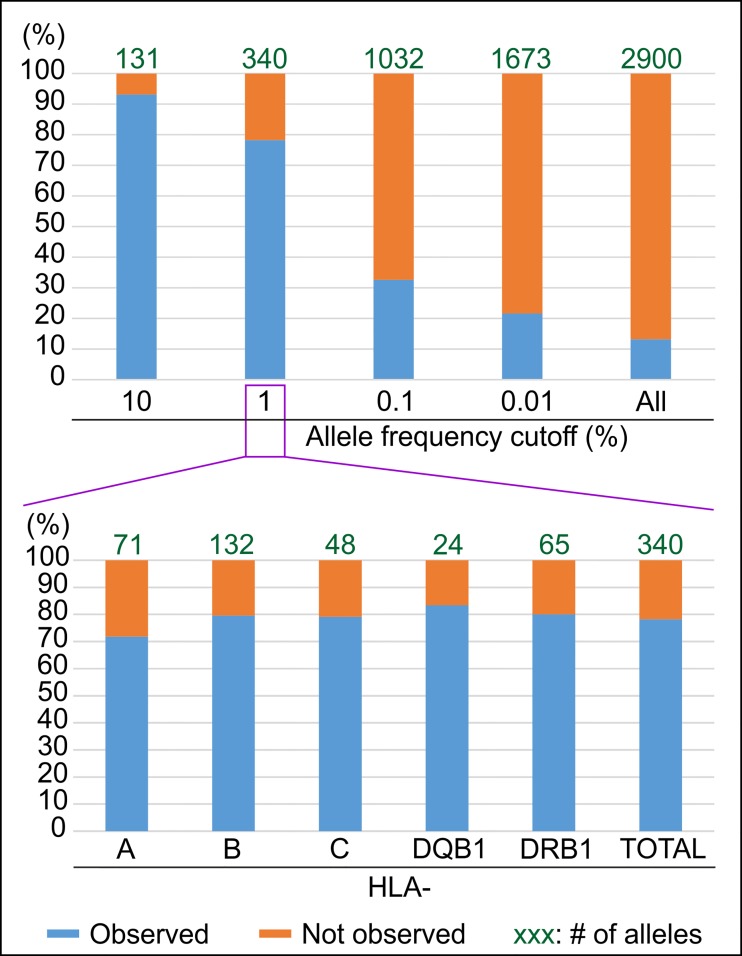
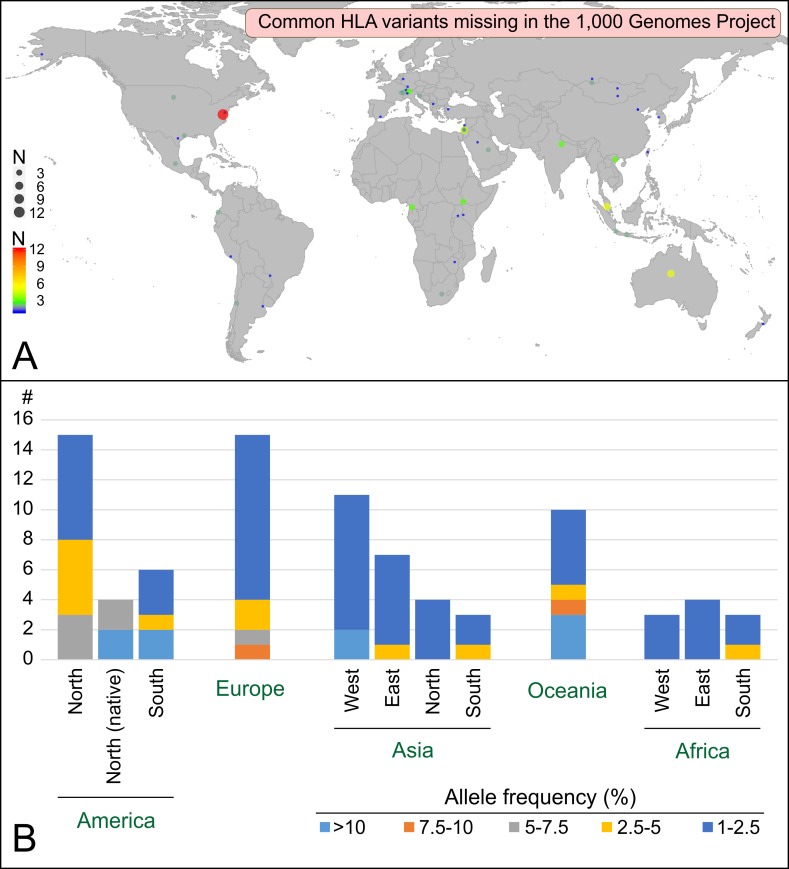
Defining worldwide human genetic variation is a critical step to reveal how genome plasticity contributes to disease. Yet, there is currently no metric to assess the representativeness and completeness of current and widely used data on genetic variation. We show here that Human Leukocyte Antigen (HLA) genes can serve as such metric as they are both the most polymorphic and the most studied genetic system. As a test case, we investigated the 1,000 Genomes Project panel. Using high-accuracy in silico HLA typing, we find that over 20% of the common HLA variants and over 70% of the rare HLA variants are missing in this reference panel for worldwide genetic variation, due to undersampling and incomplete geographical coverage, in particular in Oceania and West Asia. Because common and rare variants both contribute to disease, this study thus illustrates how HLA diversity can detect and help fix incomplete sampling and hence accelerate efforts to draw a comprehensive overview of the genetic variation that is relevant to health and disease.
Conflict of interest statement
J.P and P.G are employees of Xegen. This does not alter the authors’ adherence to PLOS ONE policies on sharing data and materials.
Figures
Similar articles
-
Overview of registries, HLA typing and diversity, and search algorithms.Tissue Antigens. 2007 Apr;69 Suppl 1:3-5. doi: 10.1111/j.1399-0039.2006.758_2.x. Tissue Antigens. 2007. PMID: 17445151 Review.
-
16(th) IHIW: analysis of HLA population data, with updated results for 1996 to 2012 workshop data (AHPD project report).Int J Immunogenet. 2013 Feb;40(1):21-30. doi: 10.1111/iji.12033. Epub 2012 Dec 22. Int J Immunogenet. 2013. PMID: 23280239
-
[Immune response genes products in human physiology].Ross Fiziol Zh Im I M Sechenova. 2012 Sep;98(9):1041-52. Ross Fiziol Zh Im I M Sechenova. 2012. PMID: 23293809 Review. Russian.
-
[HLA genotyping for molecular epidemiological analysis of humans].Rinsho Byori. 2013 Nov;61(11):1026-34. Rinsho Byori. 2013. PMID: 24450108 Review. Japanese.
-
Excess of Deleterious Mutations around HLA Genes Reveals Evolutionary Cost of Balancing Selection.Mol Biol Evol. 2016 Oct;33(10):2555-64. doi: 10.1093/molbev/msw127. Epub 2016 Jun 28. Mol Biol Evol. 2016. PMID: 27436009 Free PMC article.
Cited by
-
Benchmark of tools for in silico prediction of MHC class I and class II genotypes from NGS data.BMC Genomics. 2023 May 9;24(1):247. doi: 10.1186/s12864-023-09351-z. BMC Genomics. 2023. PMID: 37161318 Free PMC article.
-
MultiCook: A Tool That Improves Accuracy of HLA Imputation by Combining Probabilities From Multiple Reference Panels and Methods.HLA. 2025 May;105(5):e70153. doi: 10.1111/tan.70153. HLA. 2025. PMID: 40326750 Free PMC article.
-
Admixture as a source for HLA variation in Neolithic European farming communities.Genome Biol. 2025 Feb 28;26(1):43. doi: 10.1186/s13059-025-03509-6. Genome Biol. 2025. PMID: 40022192 Free PMC article.
-
HLA-H: Transcriptional Activity and HLA-E Mobilization.Front Immunol. 2020 Jan 17;10:2986. doi: 10.3389/fimmu.2019.02986. eCollection 2019. Front Immunol. 2020. PMID: 32010122 Free PMC article.
-
Blood group typing from whole-genome sequencing data.PLoS One. 2020 Nov 12;15(11):e0242168. doi: 10.1371/journal.pone.0242168. eCollection 2020. PLoS One. 2020. PMID: 33180819 Free PMC article.
References
-
- Wetterstrand K. DNA sequencing costs: data from the NHGRI Genome Sequencing Program (GSP). http://wwwgenomegov/sequencingcostsdata. 2017.
Publication types
MeSH terms
Substances
LinkOut - more resources
Full Text Sources
Other Literature Sources
Research Materials
