. 2019 Feb;597(4):1087-1101.
doi: 10.1113/JP277275. Epub 2018 Nov 24.

Characterization and regulation of wild-type and mutant TASK-1 two pore domain potassium channels indicated in pulmonary arterial hypertension

Affiliations

Characterization and regulation of wild-type and mutant TASK-1 two pore domain potassium channels indicated in pulmonary arterial hypertension

Kevin P Cunningham et al. J Physiol. 2019 Feb.

Abstract

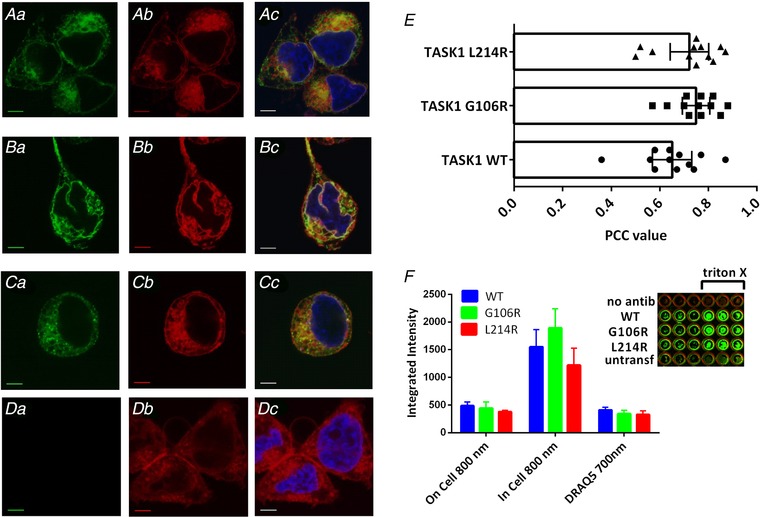
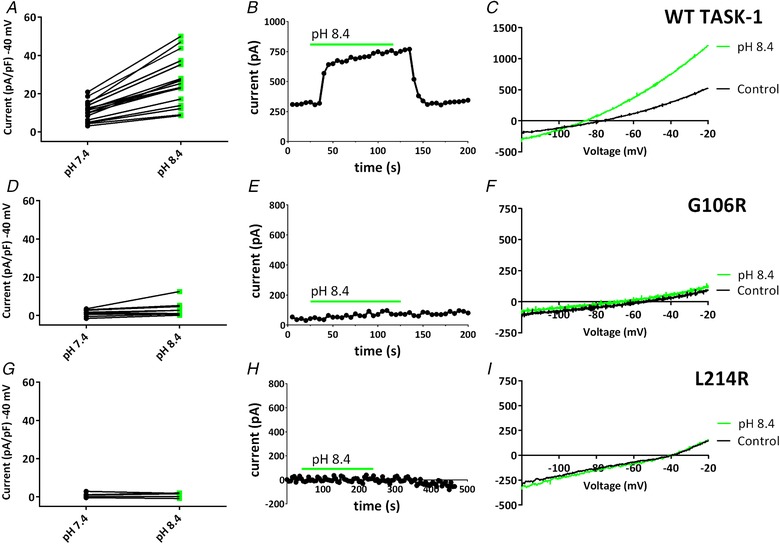
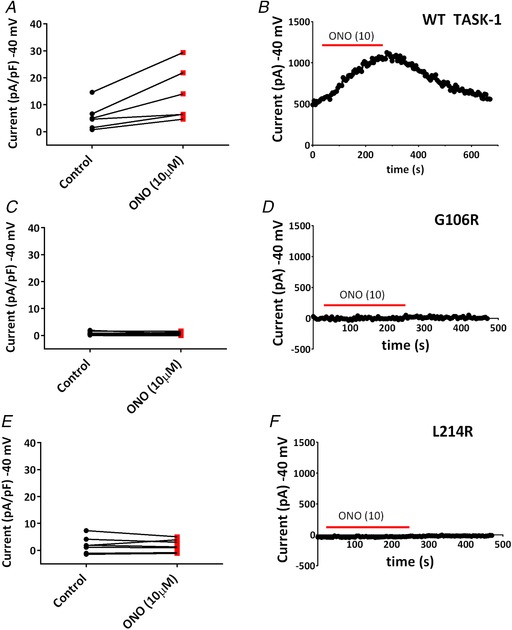
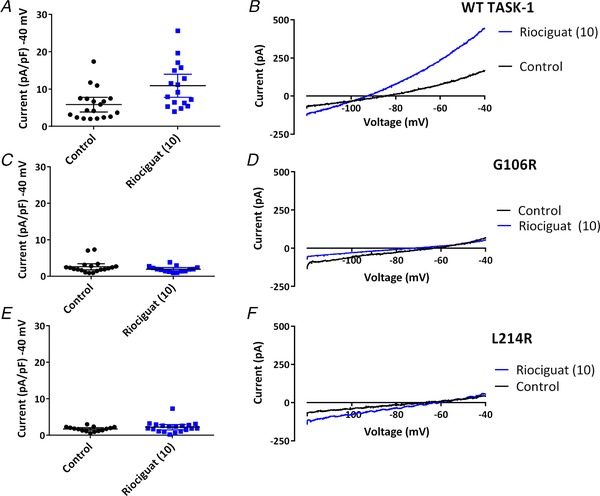
Key points: The TASK-1 channel gene (KCNK3) has been identified as a possible disease-causing gene in heritable pulmonary arterial hypertension (PAH). In the present study, we show that novel mutated TASK-1 channels, seen in PAH patients, have a substantially reduced current compared to wild-type TASK-1 channels. These mutated TASK-1 channels are located at the plasma membrane to the same degree as wild-type TASK-1 channels. ONO-RS-082 and alkaline pH 8.4 both activate TASK-1 channels but do not recover current through mutant TASK-1 channels. We show that the guanylate cyclase activator, riociguat, a novel treatment for PAH, enhances current through TASK-1 channels but does not recover current through mutant TASK-1 channels.

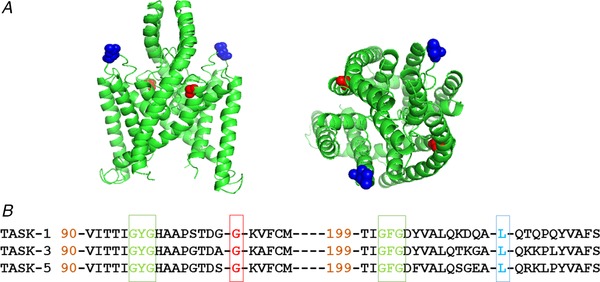
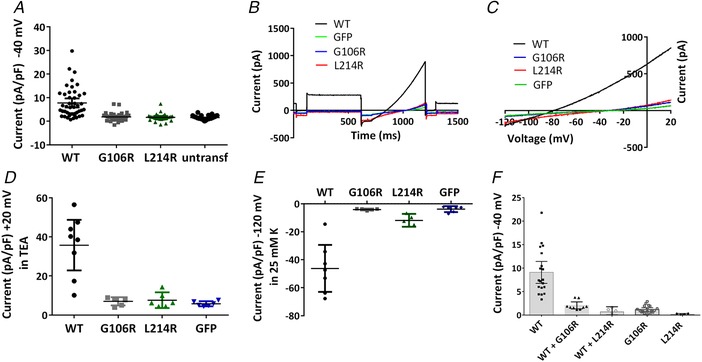
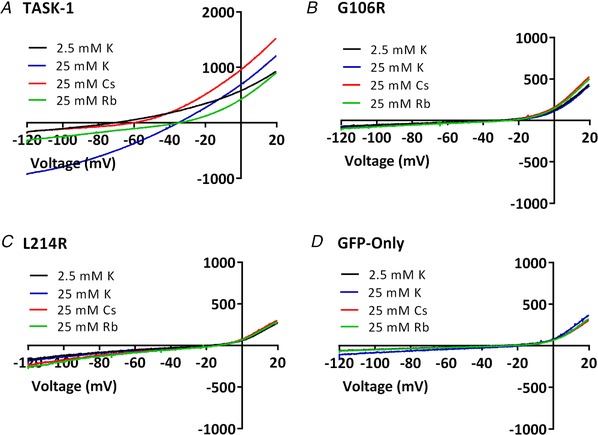
Abstract: Pulmonary arterial hypertension (PAH) affects ∼15-50 people per million. KCNK3, the gene that encodes the two pore domain potassium channel TASK-1 (K2P3.1), has been identified as a possible disease-causing gene in heritable PAH. Recently, two new mutations have been identified in KCNK3 in PAH patients: G106R and L214R. The present study aimed to characterize the functional properties and regulation of wild-type (WT) and mutated TASK-1 channels and determine how these might contribute to PAH and its treatment. Currents through WT and mutated human TASK-1 channels transiently expressed in tsA201 cells were measured using whole-cell patch clamp electrophysiology. Localization of fluorescence-tagged channels was visualized using confocal microscopy and quantified with in-cell and on-cell westerns. G106R or L214R mutated channels were located at the plasma membrane to the same degree as WT channels; however, their current was markedly reduced compared to WT TASK-1 channels. Functional current through these mutated channels could not be restored using activators of WT TASK-1 channels (pH 8.4, ONO-RS-082). The guanylate cyclase activator, riociguat, enhanced current through WT TASK-1 channels; however, similar to the other activators investigated, riociguat did not have any effect on current through mutated TASK-1 channels. Thus, novel mutations in TASK-1 seen in PAH substantially alter the functional properties of these channels. Current through these channels could not be restored by activators of TASK-1 channels. Riociguat enhancement of current through TASK-1 channels could contribute to its therapeutic benefit in the treatment of PAH.

Keywords: KCNK3 (TASK-1) potassium channel; Pulmonary arterial hypertension; riociguat.


Figures

Figure 1
Figure 1. Homology model of TASK‐1 variants
A, homology model of TASK channels based on TRAAK crystal structure (PDB ID: 3UM7; Brohawn et al. 2012) depicting the location of the two PAH TASK‐1 mutations: G106R and L214R. TASK‐1_G106 amino acids are shown in red and TASK‐1_L214 are shown in blue. Left: side view of the channel. Right: view from above the channel. B, amino acid sequence alignment of TASK‐1 with the two other members of the TASK subfamily: TASK‐3 and TASK‐5. Gaps are indicated by dashes and numbers indicate where sequence begins relative to the full length channel. The amino acids mutated in PAH patients, glycine (G) 106 and leucine (L) 214 are in red and blue, respectively. The selectivity filter regions are shown in green. [Color figure can be viewed at wileyonlinelibrary.com]
Figure 2
Figure 2. Electrophysiological profiling of currents through WT TASK‐1 and TASK‐1 mutant channels
A, current density (pA pF–1) measured at –40 mV from individual cells transiently expressing WT TASK‐1, TASK‐1_G106R, TASK‐1_L214R channels or untransfected cells. Error bars represent the 95% CI. B, raw data trace from exemplar human TASK‐1, TASK‐1_G106R, TASK‐1_L214R channels and GFP alone transfected cells in 10 mm TEA using a step‐ramp voltage protocol as detailed in the Methods. C, current–voltage relationship for the cells in (B) evoked by ramp changes in voltage from –120 to –20 mV. D, current density (pA pF–1) measured at +20 mV in the presence of 10 mm TEA for cells expressing WT TASK‐1, TASK‐1_G106R, TASK‐1_L214R channels or GFP alone. E, current density (pA pF–1) measured at –120 mV in 25 mm K external for cells expressing WT TASK‐1, TASK‐1_G106R, TASK‐1_L214R channels or GFP alone. F, current density (pA pF–1) measured at –40 mV for cells expressing WT TASK‐1, TASK‐1_G106R, TASK‐1_L214R channels or co‐expression of WT TASK_1 and TASK‐1_G106R or WT TASK_1 and TASK‐1_L214R. [Color figure can be viewed at wileyonlinelibrary.com]
Figure 3
Figure 3. Ion permeability of TASK‐1 and mutated TASK‐1 channels
AD, current–voltage relationships from exemplar human TASK‐1, TASK‐1_G106R, TASK‐1_L214R channels and GFP alone transfected cells in 2.5 mm K, 25 mm K, 25 mm Rb or 25 mm Cs. [Color figure can be viewed at wileyonlinelibrary.com]
Figure 4
Figure 4. Evaluation of cellular localization of labelled TASK‐1 variants
Aa and Ab, photomicrograph taken using confocal microscopy showing cellular localization of WT TASK‐1 channels C terminally fused with GFP, relative to the location of the plasma membrane stained with CellMask Deep Red. Ac, overlay of (Aa) and (Ab) indicating co‐localization of TASK‐1‐GFP with the plasma membrane in yellow. Nuclei were stained with the blue fluorescent dye Hoechst 33258. Ba, cellular localization of TASK‐1_G106R fused with GFP, relative to the location of the membrane (Bb). Bc, co‐localization of the G106R variant at the membrane in yellow. Ca, localization of TASK‐1_L214R in relation to the plasma membrane (Cb). Cc, overlap of the GFP‐fused variant with the plasma membrane, stained red. Da, cells untransfected with TASK‐1; (Db) and (Dc) as above. All scale bars are 5 μm. E, quantification of the co‐localization observed in experiments, as shown in (Ac), (Bc) and (Cc), using Pearson's correlation coefficient. A correlation coefficient of 1 represents 100% correlation. F, integrated fluorescence intensity for HA‐tagged WT and mutant TASK‐1 channels in non‐permeabilized (membrane) and permeabilized (whole‐cell) cells detected at 800 nm and for DRAQ5 (whole cell) detected at 700 nm using a Li‐Cor Odyssey SA fluorescence imager. Each column represents the mean ± SEM from three independent experiments performed in triplicate. The mean integrated intensity obtained from untransfected cells on the same plate, treated in the same way, was subtracted from each value. Inset: exemplar coverslips from a single plate, for ‘no antib’ (WT TASK‐1 with no primary antibody), WT TASK‐1, TASK‐1_G106R, TASK‐1_L214 transfected cells and untransfected cells ‘untransf’. Each row has three unpermeabilized coverslips and three permeabilized (with Triton X‐100) coverslips. [Color figure can be viewed at wileyonlinelibrary.com]
Figure 5
Figure 5. Effect of extracellular alkalosis on WT TASK‐1 and TASK‐1 variants
A, plot of currents (pA pF–1) measured at –40 mV, recorded through WT TASK‐1 channels in either pH 7.4 (black dots) or pH 8.4 (green squares). A black line links the same cell in each condition. B, time course plot showing the effect of pH 8.4 on WT TASK‐1 currents. Each point is a 5 s average of the current at –40 mV. Application of pH 8.4 is indicated by the green bar. Current prior to and after the green bar is measured at pH 7.4. C, representative currents recorded through WT TASK‐1 in a single cell, evoked by ramp changes in voltage from –120 to –20 mV in pH 7.4 (black line) or pH 8.4 (green line). DF, as shown for (A) to (C), but for TASK‐1_G106R channels. GI, as shown for (A) to (C), but for TASK‐1_L214R channels. [Color figure can be viewed at wileyonlinelibrary.com]
Figure 6
Figure 6. Effect of ONO‐RS‐082 (10 μM) on WT TASK‐1 and TASK‐1 variants
A, a plot of currents (pA pF–1) measured at –40 mV, recorded through WT TASK‐1 channels in either extracellular recording solution (control) (black dots) or control solution containing 10 μm ONO‐RS‐082 (red squares). A black line links the same cell in each condition. B, time course plot showing the acute application of ONO‐RS‐082 (10 μm) on WT TASK‐1 currents. Each point is a 5 s average of the current at –40 mV. Application of ONO‐RS‐082 is indicated by the red bar. Current prior to and after the red bar is measured in control solution. C and D, as shown for (A) and (B), but for TASK‐1_G106R channels. E and F, as shown for (A) and (B), but for TASK‐1_L214R channels. [Color figure can be viewed at wileyonlinelibrary.com]
Figure 7
Figure 7. Effect of Riociguat (10 μm) on WT TASK‐1 and TASK‐1 variants
A, plot of current (pA pF–1) measured at –40 mV from individual cells transiently expressing WT TASK‐1 either incubated in extracellular solution minus riociguat (control: black dots) or incubated in extracellular solution containing 10 μm riociguat (blue squares). Error bars represent the 95% CI. B, representative currents recorded through WT TASK‐1, evoked by ramp changes in voltage from –120 mV to –40 mV under control conditions (2.5 mm [K+]o), (black line) and after incubation in 10 μm riociguat (blue line). C and D, as shown for (A) and (B), but for TASK‐1_G106R channels. E and F, as shown for (A) and (B), but for TASK‐1_L214R channels. [Color figure can be viewed at wileyonlinelibrary.com]

References

    1. Aller MI, Veale EL, Linden AM, Sandu C, Schwaninger M, Evans LJ, Korpi ER, Mathie A, Wisden W & Brickley SG (2005). Modifying the subunit composition of TASK channels alters the modulation of a leak conductance in cerebellar granule neurons. J Neurosci 25, 11455–11467. - PMC - PubMed
    1. Antigny F, Hautefort A, Meloche J, Belacel‐Ouari M, Manoury B, Rucker‐Martin C, Péchoux C, Potus F, Nadeau V, Tremblay E, Ruffenach G, Bourgeois A, Dorfmüller P, Breuils‐Bonnet S, Fadel E, Ranchoux B, Jourdon P, Girerd B, Montani D, Provencher S, Bonnet S, Simonneau G, Humbert M & Perros F (2016). Potassium channel subfamily K member 3 (KCNK3) contributes to the development of pulmonary arterial hypertension. Circulation 133, 1371–1385. - PubMed
    1. Berg AP, Talley EM, Manger JP & Bayliss DA (2004). Motoneurons express heteromeric TWIK‐related acid‐sensitive K+ (TASK) channels containing TASK‐1 (KCNK3) and TASK‐3 (KCNK9) subunits. J Neurosci 24, 6693–6702. - PMC - PubMed
    1. Bohnen MS, Roman‐Campos D, Terrenoire C, Jnani J, Sampson KJ, Chung WK & Kass RS (2017). The impact of heterozygous KCNK3 mutations associated with pulmonary arterial hypertension on channel function and pharmacological recovery. J Am Heart Assoc 6, e006465. - PMC - PubMed
    1. Boucherat O, Chabot S, Antigny F, Perros F, Provencher S & Bonnet S (2015). Potassium channels in pulmonary arterial hypertension. Eur Respir J 46, 1167–1177. - PubMed

Publication types

MeSH terms