. 2018 Dec:370:113-119.
doi: 10.1016/j.heares.2018.10.006. Epub 2018 Oct 13.

Use of non-invasive measures to predict cochlear synapse counts

Affiliations

Use of non-invasive measures to predict cochlear synapse counts

Naomi F Bramhall et al. Hear Res. 2018 Dec.

Abstract

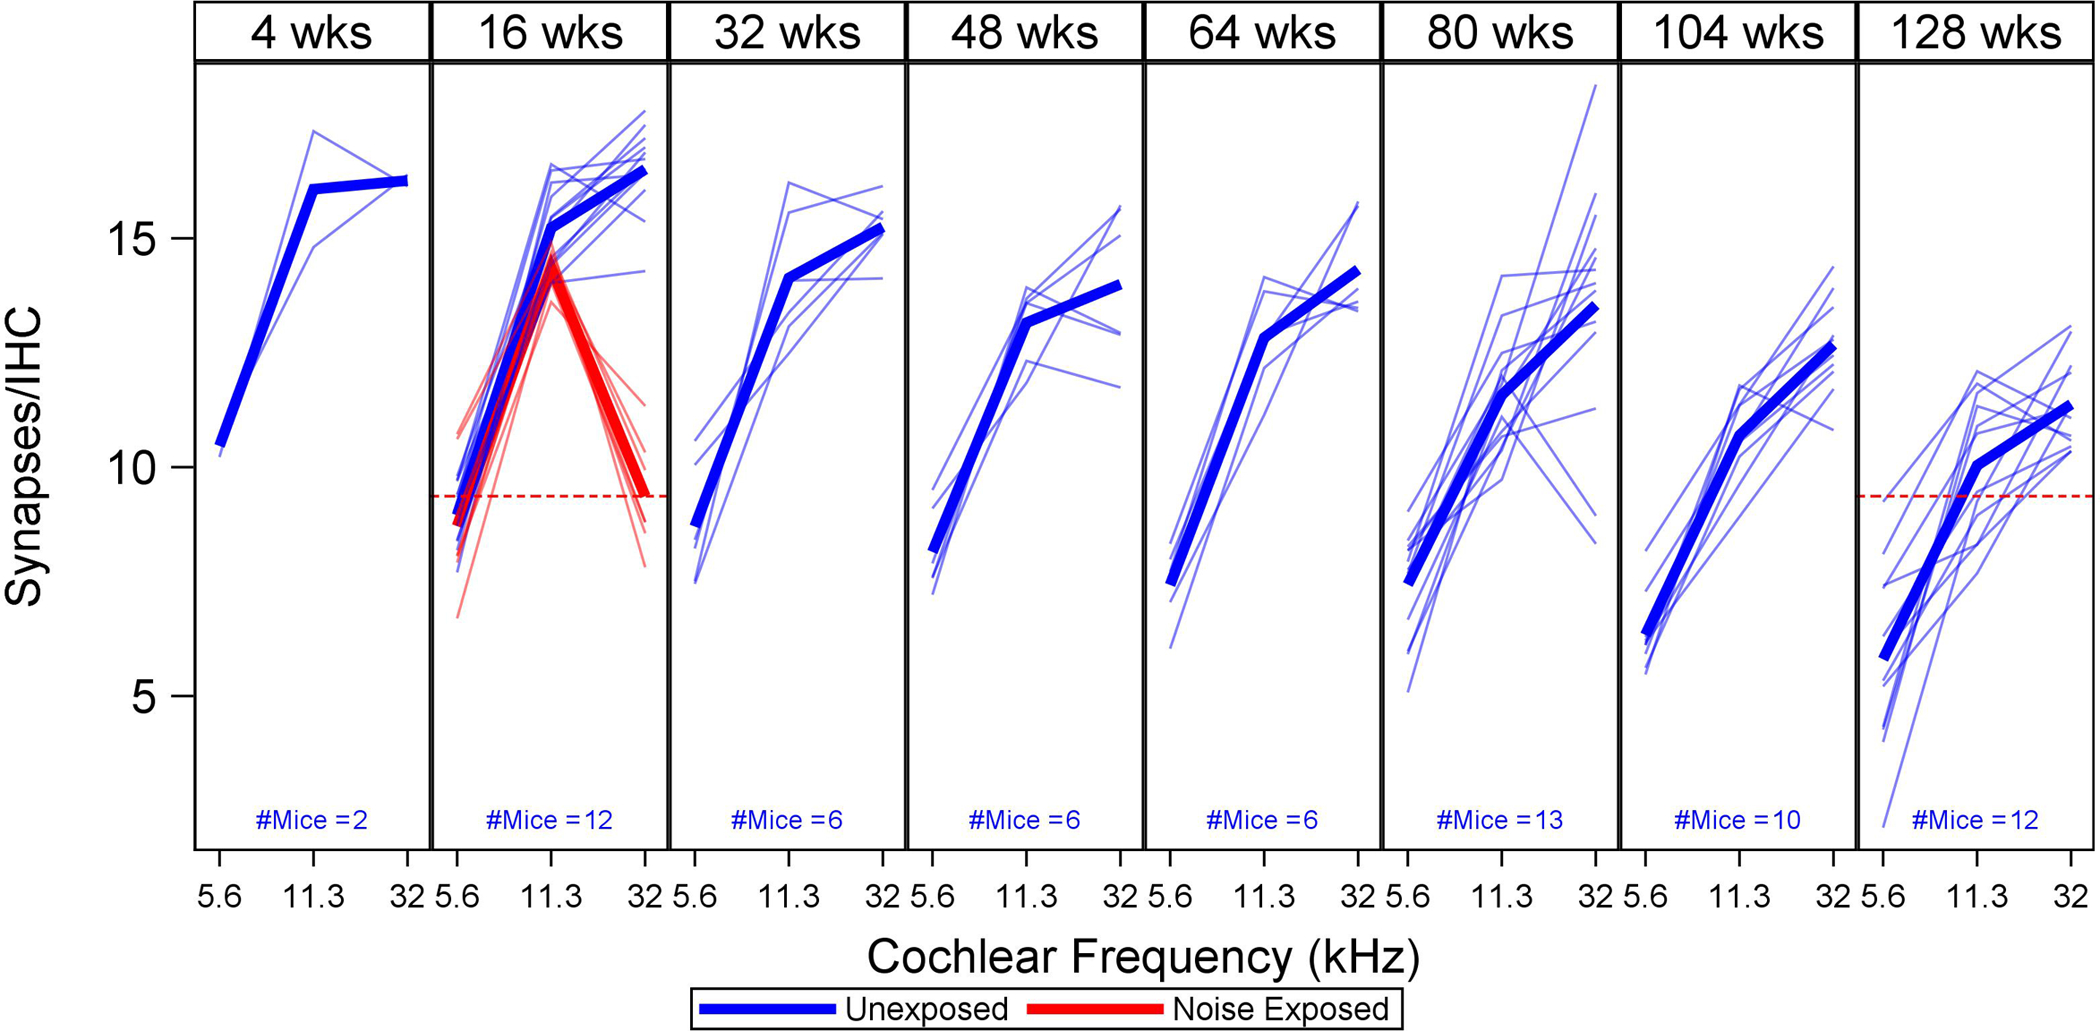
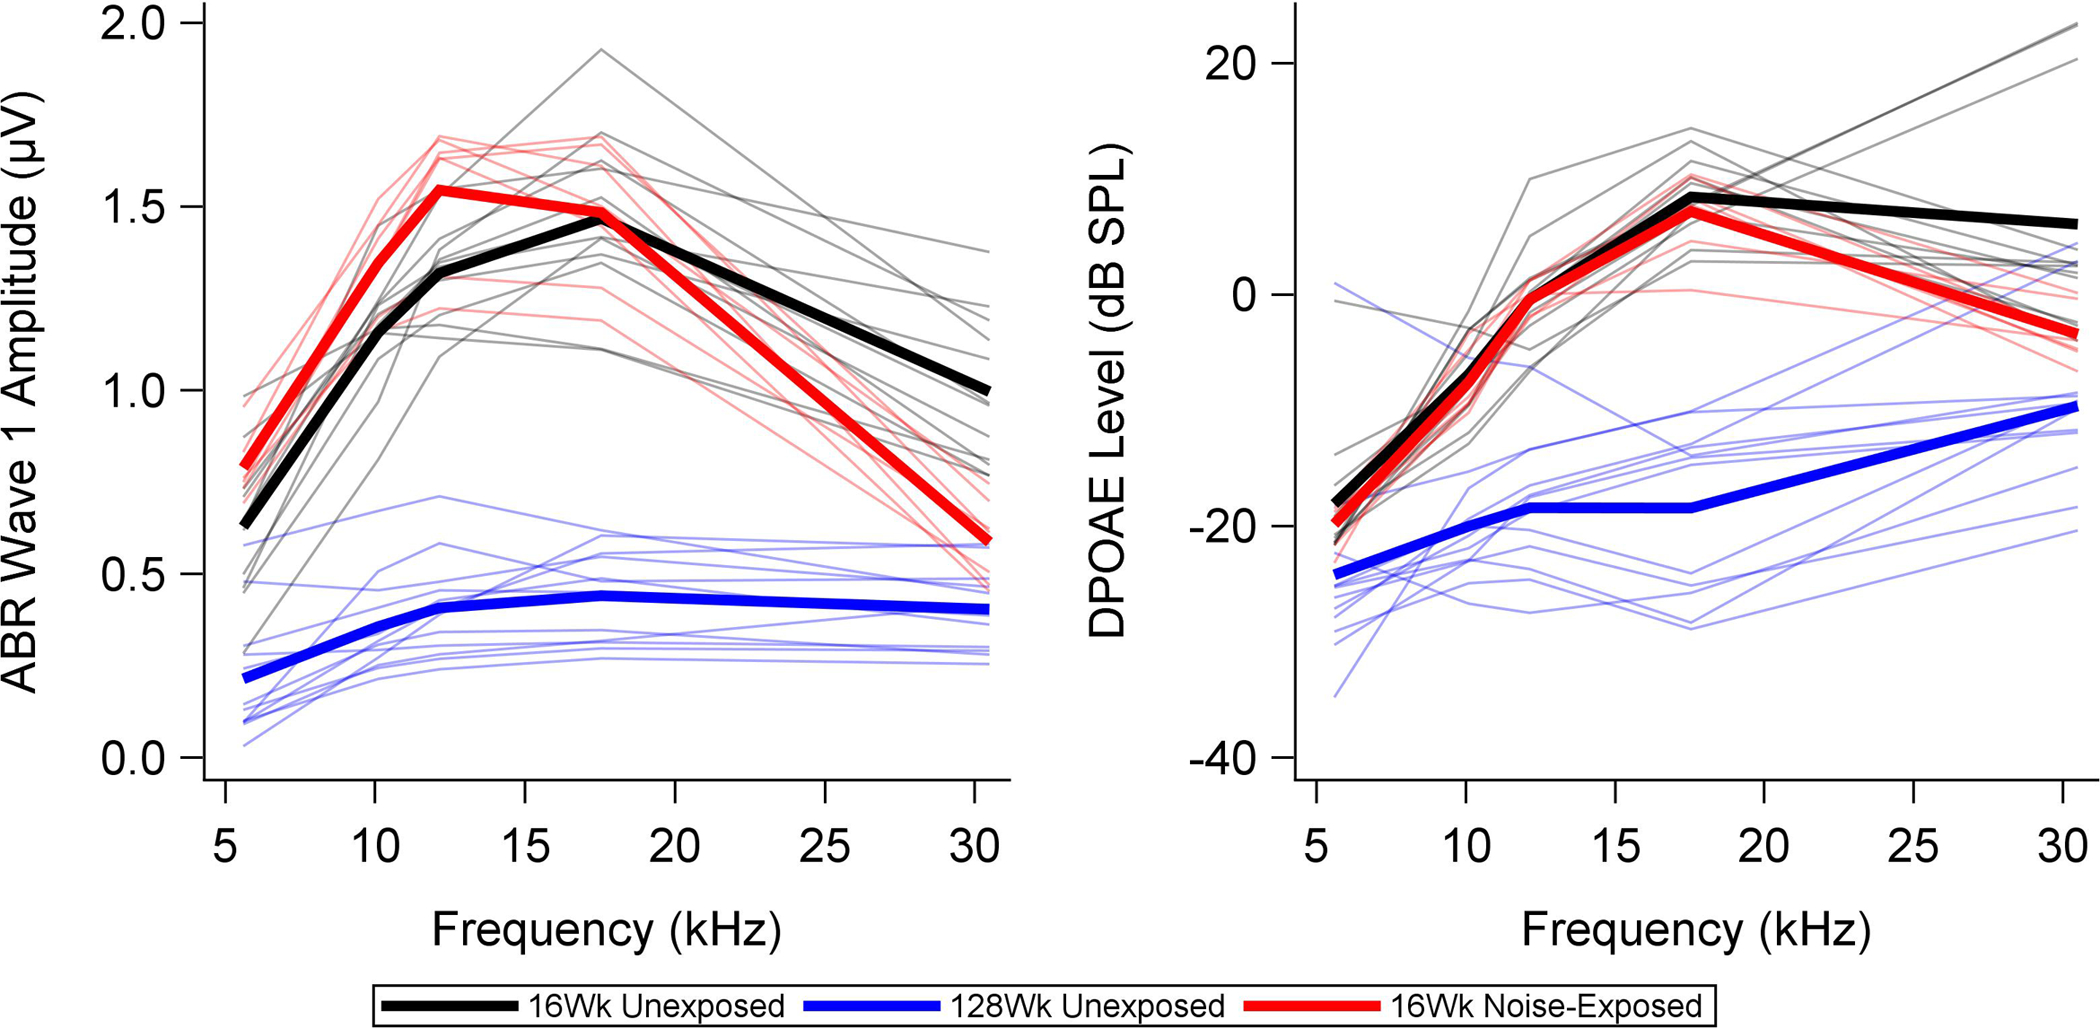
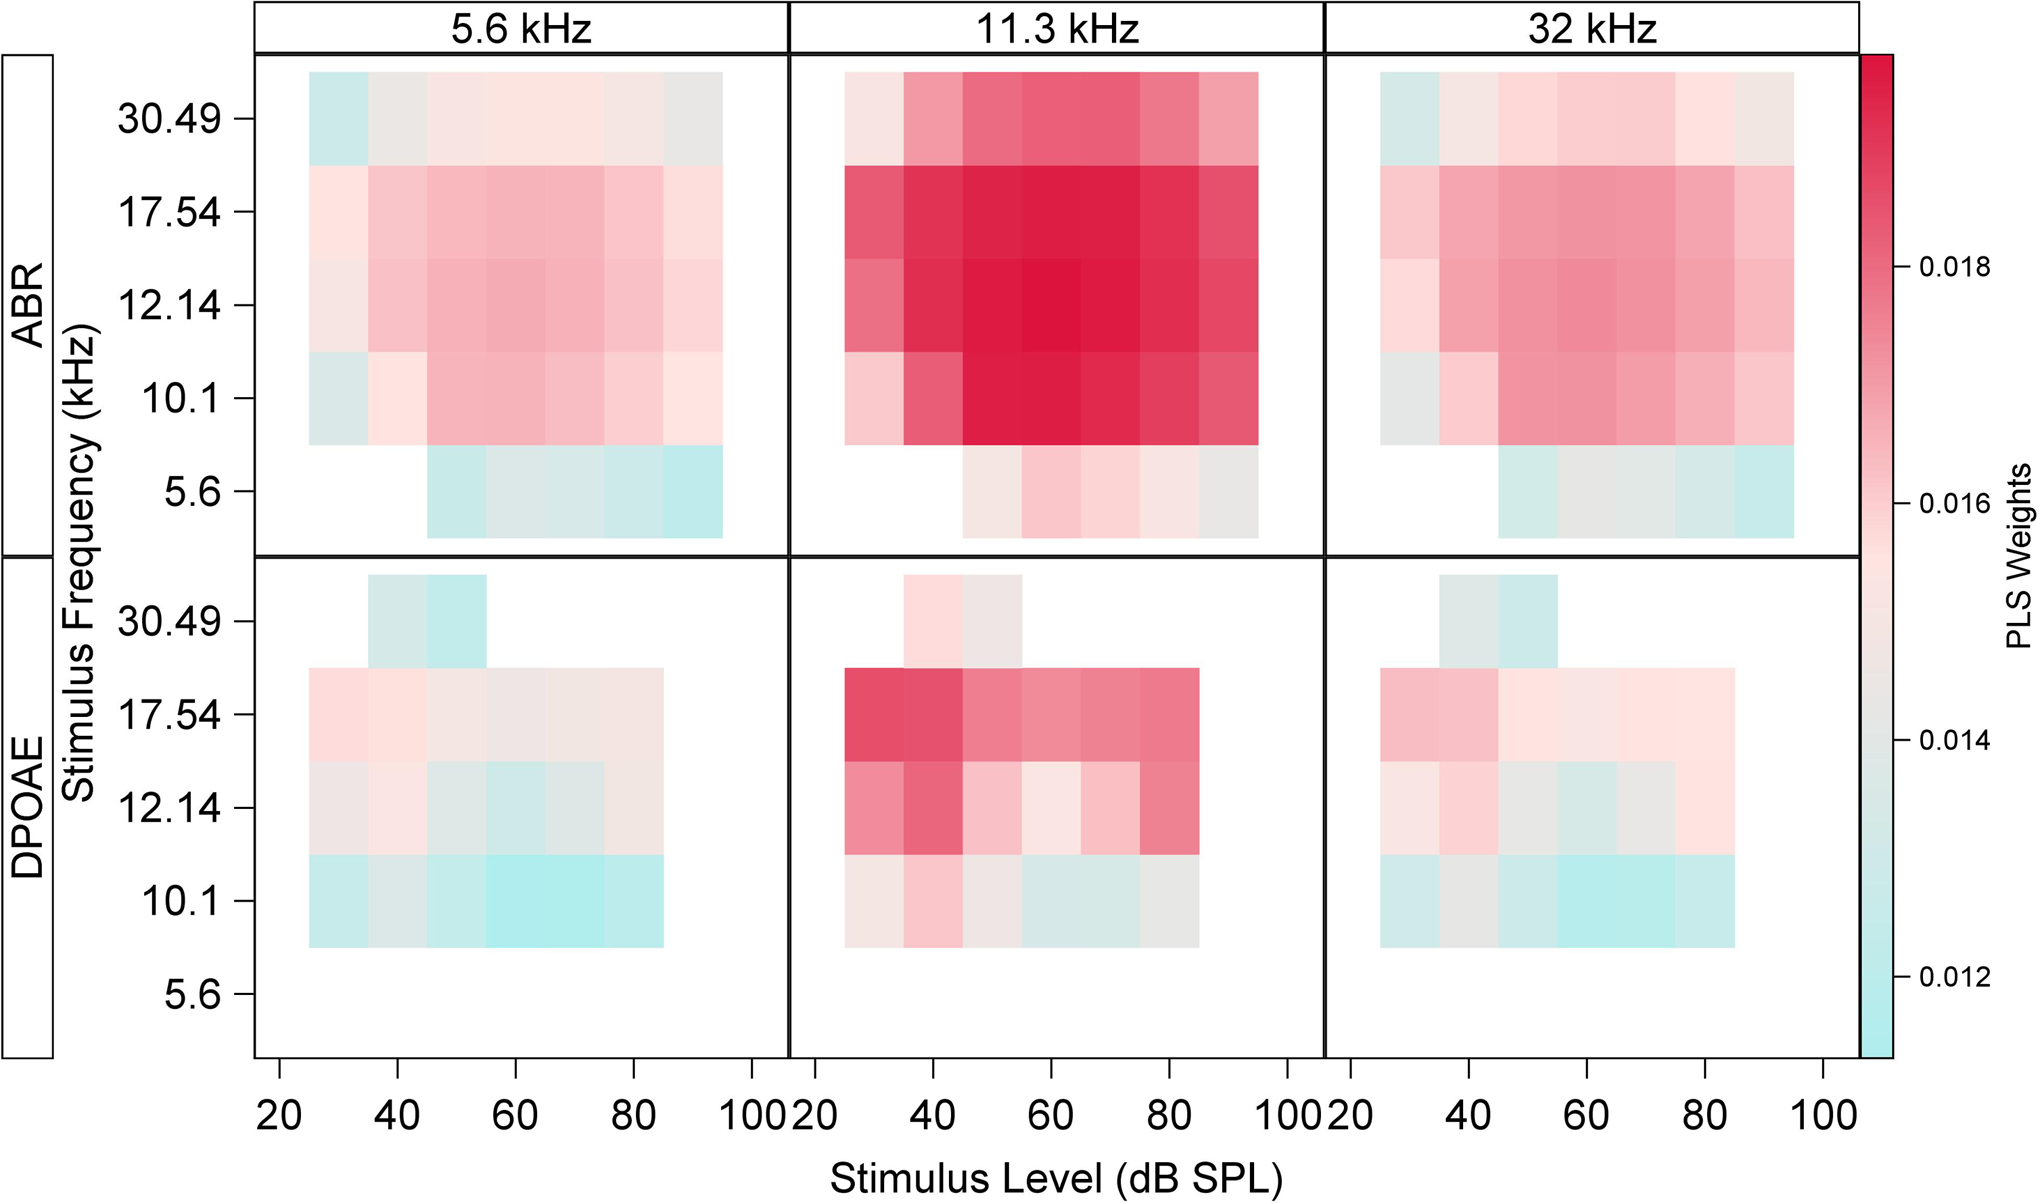
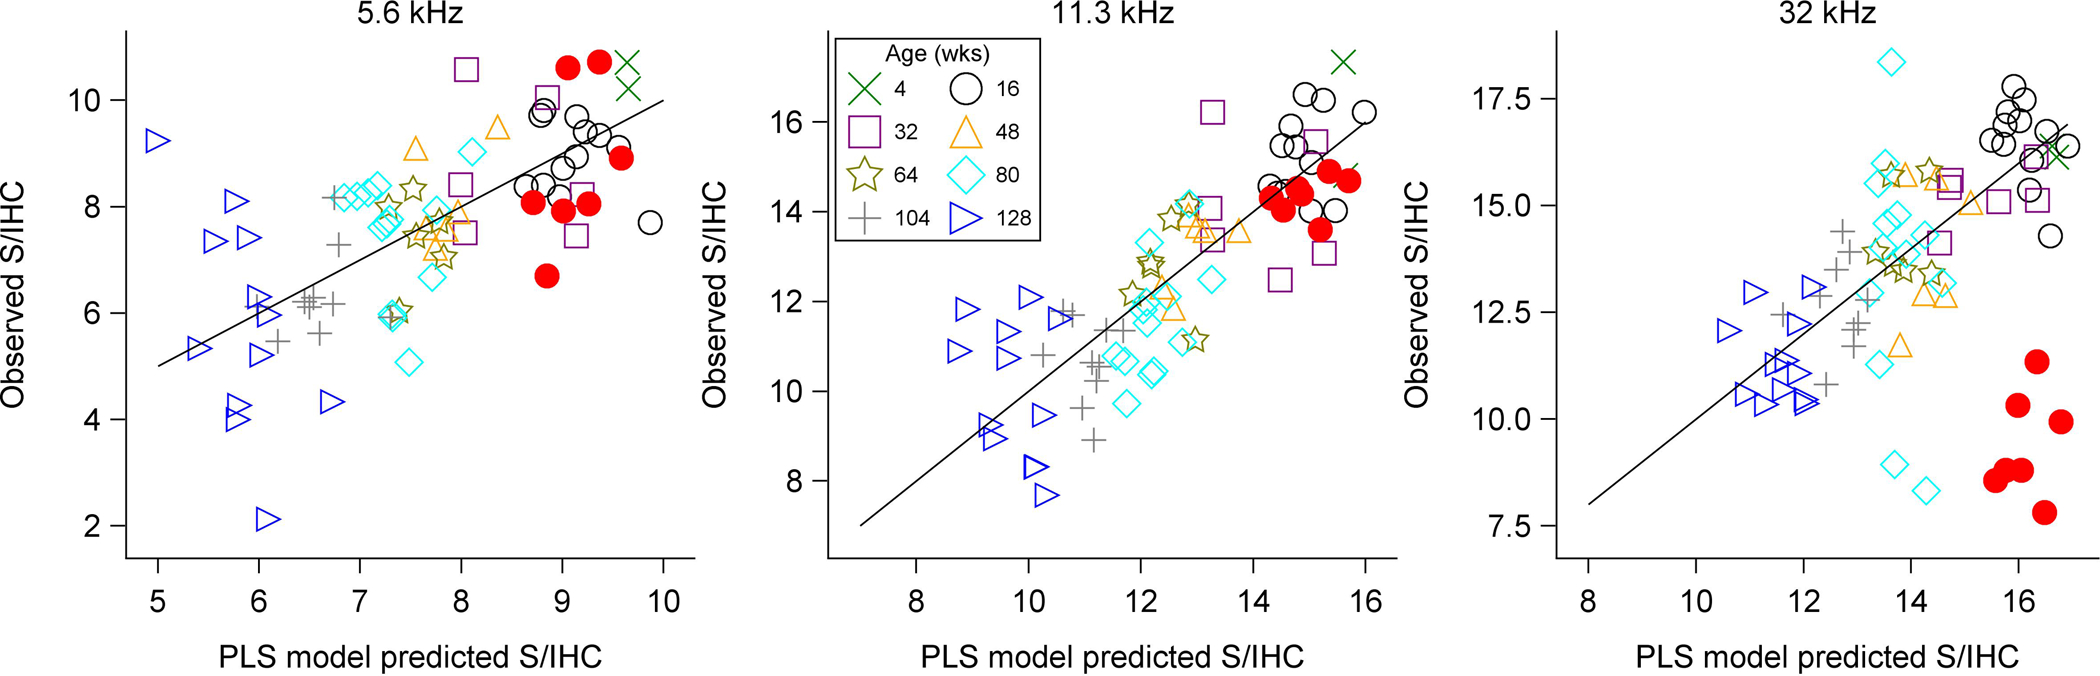
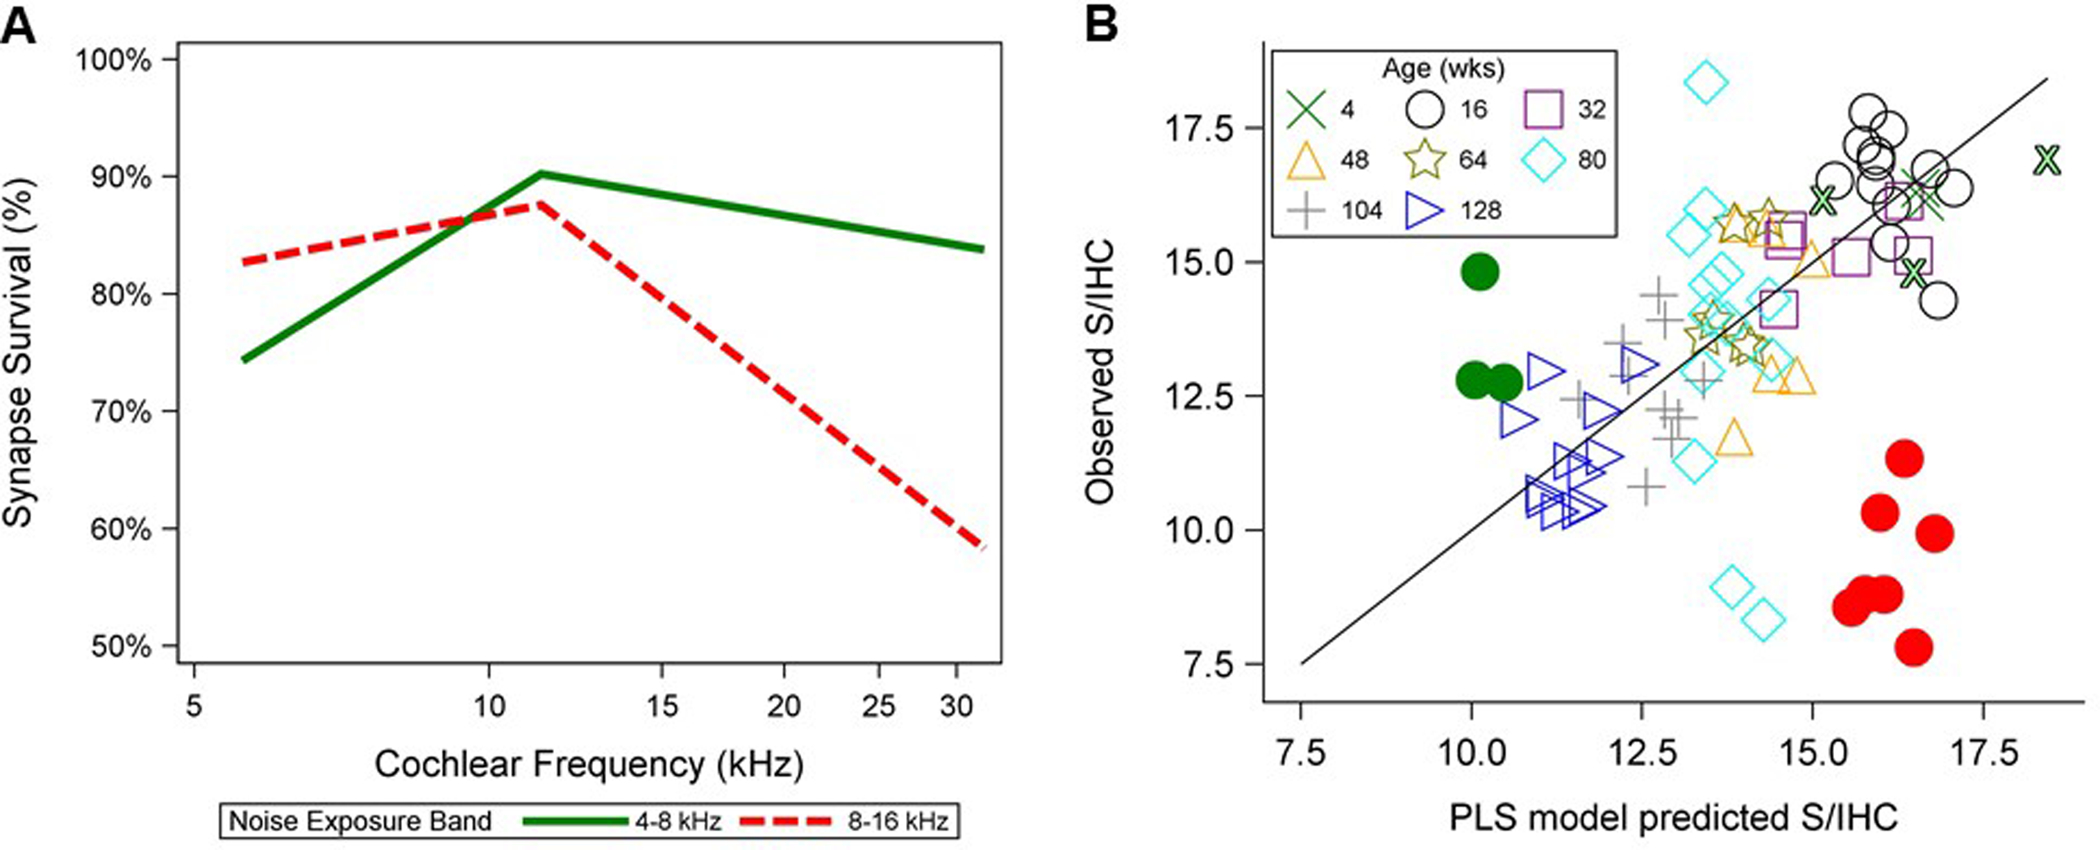
Cochlear synaptopathy, the loss of synaptic connections between inner hair cells (IHCs) and auditory nerve fibers, has been documented in animal models of aging, noise, and ototoxic drug exposure, three common causes of acquired sensorineural hearing loss in humans. In each of these models, synaptopathy begins prior to changes in threshold sensitivity or loss of hair cells; thus, this underlying injury can be hidden behind a normal threshold audiogram. Since cochlear synaptic loss cannot be directly confirmed in living humans, non-invasive assays will be required for diagnosis. In animals with normal auditory thresholds, the amplitude of wave 1 of the auditory brainstem response (ABR) is highly correlated with synapse counts. However, synaptopathy can also co-occur with threshold elevation, complicating the use of the ABR alone as a diagnostic measure. Using an age-graded series of mice and a partial least squares regression approach to model structure-function relationships, this study shows that the combination of a small number of ABR and distortion product otoacoustic emission (DPOAE) measurements can predict synaptic ribbon counts at various cochlear frequencies to within 1-2 synapses per IHC of their true value. In contrast, the model, trained using the age-graded series of mice, overpredicted synapse counts in a small sample of young noise-exposed mice, perhaps due to differences in the underlying pattern of damage between aging and noise-exposed mice. These results provide partial validation of a noninvasive approach to identify synaptic/neuronal loss in humans using ABRs and DPOAEs.

Keywords: Auditory brainstem response; Cochlear synaptopathy; Hidden hearing loss; Least-squares analysis; Noise-induced hearing loss; Otoacoustic emissions.


Conflict of interest statement

Declarations of interest

None.

Figures

Figure 1.
Figure 1.. Observed synapse counts per inner hair cell (S/IHC) across age.
For each age group (expressed in weeks), thin lines show S/IHC for three cochlear frequencies (5.6, 11.3, and 32 kHz) in individual mice, with mean values indicated by thick lines. Unexposed mice are shown in blue, noise-exposed mice in red. A red dotted line shows how S/IHC at 32 kHz in 16-week-old noise-exposed mice compares to 128-week-old unexposed mice. S/IHC decrease across cochlear frequency with age and are reduced at 32 kHz in the noise-exposed mice. (For all figures, please see the online version of this article for interpretation of references to color.)
Figure 2.
Figure 2.. ABR wave 1 amplitudes and DPOAE levels across frequency for noise-exposed versus unexposed mice.
Thin lines show ABR and DPOAE measurements for individual 16-week-old unexposed (black) and noise-exposed mice (red). Group means are indicated with thick lines. Data from 128-week-old unexposed mice (blue) are plotted for comparison. Stimulus levels are 90 dB SPL for the ABR (selected to be sensitive to synaptopathy) and 30 dB SPL for the DPOAEs (selected to be sensitive to OHC loss). The young noise-exposed mice show slightly higher ABR wave 1 amplitudes in the lower frequencies and lower ABR wave 1 amplitudes at 30.49 kHz than the young unexposed mice. DPOAE levels are lower for the noise-exposed mice than the unexposed mice at 30.49 kHz, but are otherwise similar. Old unexposed mice show lower ABR wave 1 amplitudes and DPOAE levels than the younger mice across frequency.
Figure 3.
Figure 3.. ABR and DPOAE coefficients from the PLS model developed on data from unexposed mice.
The PLS coefficients (or weights) indicate the relative weighting of each individual ABR or DPOAE measurement that best predict synapse counts. This plot shows ABR wave 1 amplitude (top row) and DPOAE level (bottom row) weights αL,F and δL,F, respectively, identified by the PLS model for cochlear frequencies of 5.6 kHz (left column), 11.3 kHz (middle column), and 32 kHz (right column). Colored squares within each subplot display the magnitude of the PLS coefficient associated with each ABR or DPOAE stimulus frequency (rows) and level (columns) of the ABR or DPOAE. Empty squares denote predictors with Variable Importance for Projection (VIP) less than 0.8. The highest coefficients for ABR wave 1 amplitude are associated with 10.1–17.54 kHz stimuli at levels of 40–80 dB SPL. The largest DPOAE coefficients are at f2 = 17.54 kHz across stimulus levels.
Figure 4.
Figure 4.. PLS model predicted S/IHC versus observed S/IHC.
Cross-validated predicted vs. observed S/IHC are plotted for individual mice at each of the three modeled cochlear frequencies. Perfect correspondence between predicted and observed values is indicated by the diagonal line. The age group of each mouse is indicated by color and symbol. Filled circles indicate noise-exposed mice and open symbols indicate unexposed animals. This plot illustrates the high level of accuracy associated with the PLS model in unexposed mice. However, the model overestimates S/IHC in the noise-exposed mice at 32 kHz.
Figure 5.
Figure 5.. Synaptic survival and model predictions for a less focal noise-induced synaptic loss.
(A) Mean synaptic survival (expressed as a percent and referenced to mean counts for five 4-week-old unexposed mice) is plotted for three 4-week-old mice exposed to a 4–8 kHz band of noise delivered at 112 dB SPL for 6 hours and for nine 16-week-old mice exposed to an 8–16 kHz noise band at 100 dB SPL for 2 hours. Synapse counts were assessed at two weeks post-exposure. The mice exposed to a 4–8 kHz noise band (green line) show a widespread pattern of mild synaptic loss, while the mice with 8–16 kHz exposure (red dashed line) display severe focal loss at 32 kHz. (B) Predicted vs. observed S/IHC, now including three 4–8 kHz-exposed mice (filled green circles) and three additional 4-week-old unexposed mice (outlined green Xs), are plotted for individual mice at 32 kHz as described in Figure 4. The model accurately predicts synapse counts in the mice exposed to a 4–8 kHz exposure band, but overpredicts synapse numbers in the mice exposed from 8–16 kHz.

Similar articles

Cited by

References

    1. Bharadwaj HM, Masud S, Mehraei G, et al. (2015). Individual differences reveal correlates of hidden hearing deficits. J Neurosci, 35, 2161–2172. - PMC - PubMed
    1. Bourien J, Tang Y, Batrel C, et al. (2014). Contribution of auditory nerve fibers to compound action potential of the auditory nerve. J Neurophysiol, 112, 1025–1039. - PubMed
    1. Bramhall NF, Konrad-Martin D, McMillan GP, et al. (2017). Auditory Brainstem Response Altered in Humans With Noise Exposure Despite Normal Outer Hair Cell Function. Ear Hear, 38, e1–e12. - PMC - PubMed
    1. Chen MA, Webster P, Yang E, et al. (2006). Presbycusic neuritic degeneration within the osseous spiral lamina. Otology & Neurotology, 27, 316–322. - PubMed
    1. Crowe SJ, Guild SR, Polvogt LM (1934). Observations on the pathology of high-tone deafness. The Journal of Nervous and Mental Disease, 80, 480.

Publication types

MeSH terms