. 2018 Dec:297:76-85.
doi: 10.1016/j.jmr.2018.10.008. Epub 2018 Oct 12.

Quantitative measurement of T2, T1ρ and T1 relaxation times in articular cartilage and cartilage-bone interface by SE and UTE imaging at microscopic resolution

Affiliations

Quantitative measurement of T2, T1ρ and T1 relaxation times in articular cartilage and cartilage-bone interface by SE and UTE imaging at microscopic resolution

Rohit Mahar et al. J Magn Reson. 2018 Dec.

Abstract

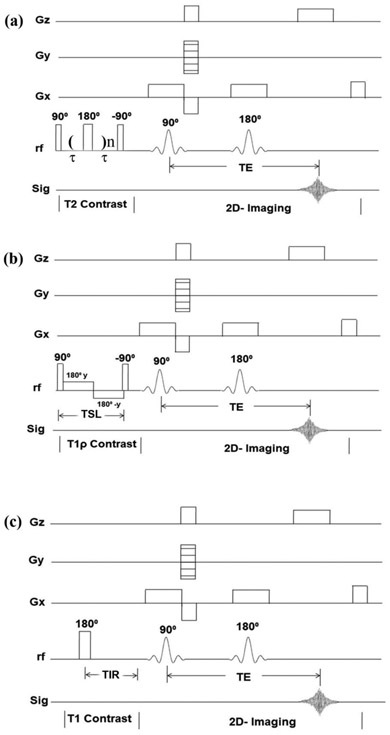
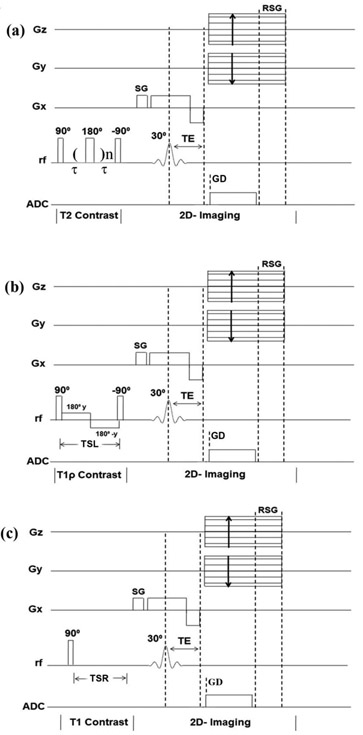
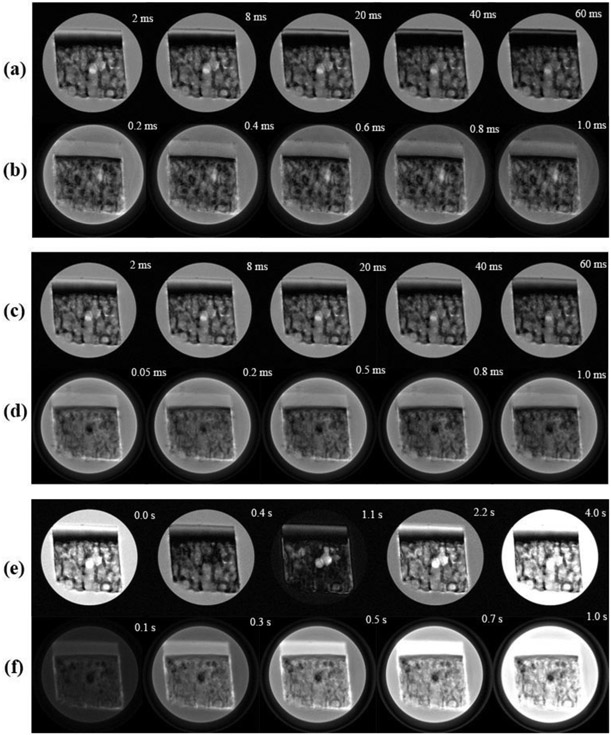
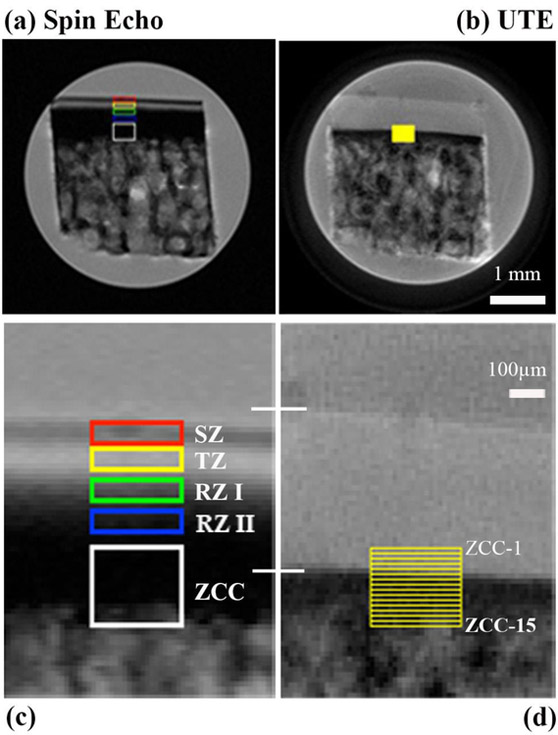
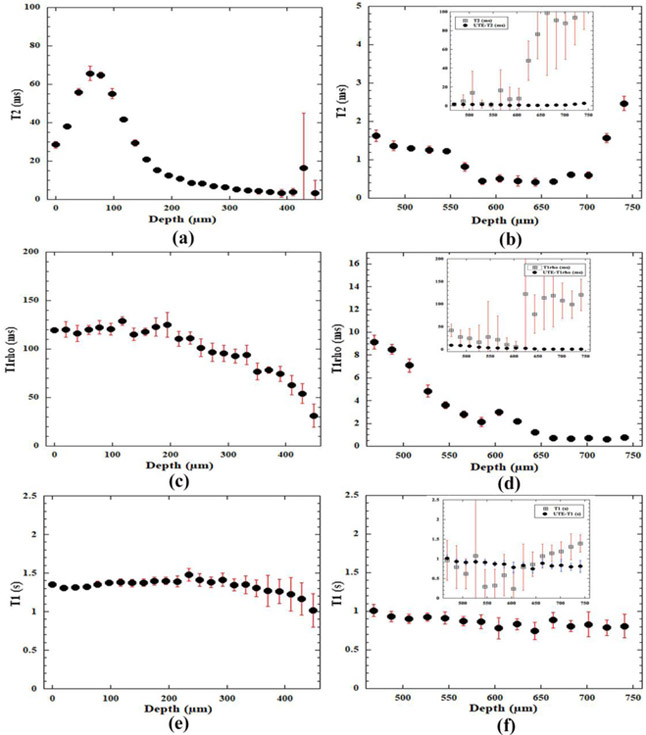
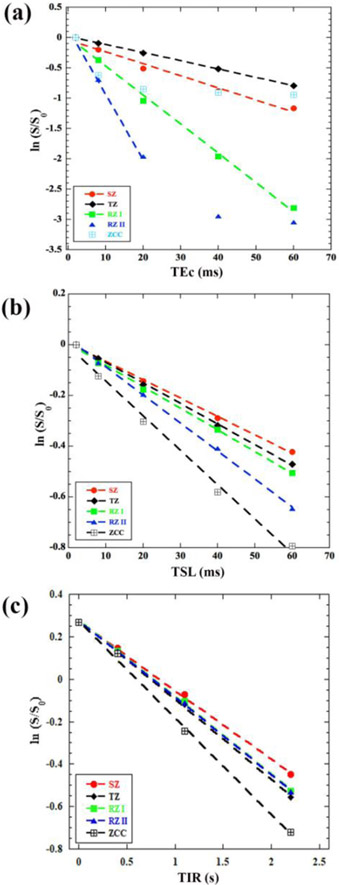
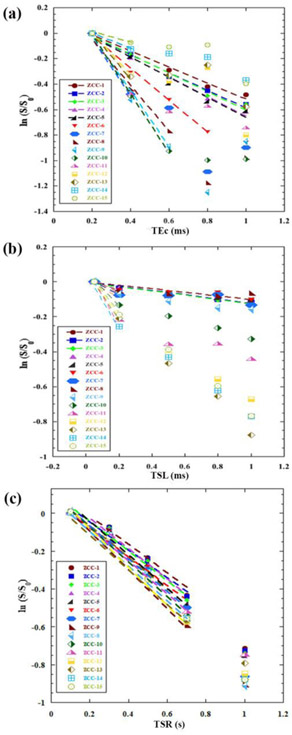
Both spin-echo (SE) and ultra-short echo (UTE) based MRI sequences were used on a 7 T µMRI system to quantify T2, T1ρ and T1 relaxation times from articular cartilage to the cartilage-bone interface on canine humeral specimens at 19.5 µm pixel resolution. A series of five relaxation-weighted images were acquired to calculate one relaxation map (T2, T1ρ or T1), from which the depth-dependent profiles were examined between the SE method and the UTE method, over the entire non-calcified cartilage and within the cartilage-bone interface. SE-based methods enabled the quantification of relaxation profiles over the noncalcified cartilage, from 0 µm (articular surface) to approximately 460 µm in depth (near the end of radial zone). Most of the cartilage-bone interface was imaged by the UTE-based methods, to a tissue depth of about 810 µm. Pixel-by-pixel calculation of the relaxation times between the independent SE and UTE methods correlated well with each other. A better understanding of the tissue properties reliably over the cartilage-bone interface region by a non-invasive MRI approach could contribute to the clinical diagnostics of trauma-induced osteoarthritis.

Keywords: Articular cartilage; Microscopic resolution; Quantitative MRI; T1; T1ρ; T2; UTE; Zone of calcified cartilage.


Figures

Figure 1
Figure 1
The graphical sketches showing the SE-based and magnetization-prepared pulse sequences of (a) quantitative T2, (b) quantitative T1ρ, (c) quantitative T1. (Gx - Slice selection gradient; Gy - Phase encoding gradient; Gz - read out gradient; TSL - spin lock period; TIR - inversion recovery time).
Figure 2
Figure 2
The graphical sketches showing the UTE-based and magnetization-prepared pulse sequences of (a) quantitative T2, (b) quantitative T1ρ, and (c) quantitative T1. (Gx - Slice selection gradient; Gy - Phase encoding gradient; Gz - read out gradient; TSL - spin lock period; TSR - saturation recovery time; SG - spoiler gradient; RSG - read spoiler gradient; GD - gradient delay).
Figure 3
Figure 3
The intensity images of a cartilage-bone specimen acquired from μMRI pulse sequences of (a) magnetization-prepared spin-echo T2, (b) magnetization-prepared UTE-T2, (c) magnetization-prepared spin-echo T1ρ, (d) magnetization-prepared UTE-T1ρ, (e) magnetization-prepared spin-echo T1 and (f) magnetization-prepared UTE-T1, at the 0° orientation with respect to the external magnetic field BO (vertically up). The display thresholds for all images are kept consistent.
Figure 4
Figure 4
Two T2-weighted intensity images, (a) spin-echo image and (b) UTE image, are marked with the region of interest (ROI) from which quantitative T2 relaxation times were calculated. (c) and (d) show the enlarged views of the ROIs in cartilage and cartilage-bone interface region. Two white lines across (c) and (d) mark the total thickness of articular cartilage in the two images. For UTE data, the zone of the calcified cartilage (ZCC) has a height of 15 pixels (each 19.5μm in size), which were calculated individually at each pixel location (ZCC-1 to ZCC-15).
Figure 5
Figure 5
The depth-dependent profiles of relaxation times in articular cartilage and the cartilage-bone interface region by the spin-echo method ((a), (c), and (e)) and the UTE method ((b), (d), and (f)). The error bars indicate the variations of the calculation across the 20-pixel width of the specimen at the same tissue depth. A large error bar implies a significant variation among the values, hence, less reliable relaxation determination. The inserts in (b), (d) and (f) show both SE and UTE relaxation profiles in the calcified zone on the same vertical scale (the solid dots are from the UTE experiments; the open squares are from the SE experiments – the continuation from the profiles in (a), (c) and (e)). It is clear that the spin-echo experiments can only determine the relaxation to a tissue depth of approximately 460μm. The relaxation in deep cartilage can only be determined by the UTE-based sequences, shown by the plots on the right where relaxation profiles remain reliable until approximately to 700μm from the articular surface (0μm). (Note that the UTE plots use different vertical scales, in order to show clearly the trends of these profiles in ZCC.)
Figure 6
Figure 6
The natural logarithm plots of the depth-dependent image intensities from the spin-echo based experiments, from which T2 (a), T1ρ (b) and T1 (c) are calculated, in all histological zones. Each plot contains five sets of data, each from one zone of articular cartilage. Each line showed the fitting of the data, where the fitting stops when the data is no longer linear.
Figure 7
Figure 7
The natural logarithm plots of the depth-dependent image intensities from the UTE based experiments, from T2 (a), T1ρ (b) and T1 (c) are calculated, in the deep and calcified cartilage (ZCC) pixel by pixel (ZCC-1 to ZCC-15) at an increment of 19.5μm depth. Each plot contains 15 sets of data, each from one-pixel depth of the specimen. Each line shows the fitting of the data, where the fitting stops when the data is no longer linear.

Similar articles

Cited by

References

    1. Maroudas A, Physicochemical properties of articular cartilage, in: Freeman MAR (Ed.) Adult articular cartilage, 2nd ed, Pitman Medical, Kent, England, 1979, pp. 215–290.
    1. Buckwalter J, Mankin H, Articular Cartilage Repair and transplantation, Arthritis & Rheumatism, 41 (1998) 1331–1341. - PubMed
    1. Bullough PG, Yawitz PS, Tafra L, Boskey AL, Topographical variations in the morphology and biochemistry of adult canine tibial plateau articular cartilage, J Orthop Res, 3 (1985) 1–16. - PubMed
    1. Hoemann CD, Lafantaisie-Favreau CH, Lascau-Coman V, Chen G, Guzman-Morales J, The cartilage-bone interface, The journal of knee surgery, 25 (2012) 85–97. - PubMed
    1. Redler I, Mow VC, Zimny ML, Mansell J, The Ultrastructure and Biomechanical Significance of the Tidemark of Articular Cartilage, Clin. Orthop. and Related Topics, 112 (1975) 357–367. - PubMed

Publication types