The 2β Splice Variation Alters the Structure and Function of the Stromal Interaction Molecule Coiled-Coil Domains
- PMID: 30366379
- PMCID: PMC6274866
- DOI: 10.3390/ijms19113316
The 2β Splice Variation Alters the Structure and Function of the Stromal Interaction Molecule Coiled-Coil Domains
Abstract
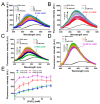
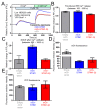
Stromal interaction molecule (STIM)-1 and -2 regulate agonist-induced and basal cytosolic calcium (Ca2+) levels after oligomerization and translocation to endoplasmic reticulum (ER)-plasma membrane (PM) junctions. At these junctions, the STIM cytosolic coiled-coil (CC) domains couple to PM Orai1 proteins and gate these Ca2+ release-activated Ca2+ (CRAC) channels, which facilitate store-operated Ca2+ entry (SOCE). Unlike STIM1 and STIM2, which are SOCE activators, the STIM2β splice variant contains an 8-residue insert located within the conserved CCs which inhibits SOCE. It remains unclear if the 2β insert further depotentiates weak STIM2 coupling to Orai1 or independently causes structural perturbations which prevent SOCE. Here, we use far-UV circular dichroism, light scattering, exposed hydrophobicity analysis, solution small angle X-ray scattering, and a chimeric STIM1/STIM2β functional assessment to provide insights into the molecular mechanism by which the 2β insert precludes SOCE activation. We find that the 2β insert reduces the overall α-helicity and enhances the exposed hydrophobicity of the STIM2 CC domains in the absence of a global conformational change. Remarkably, incorporation of the 2β insert into the STIM1 context not only affects the secondary structure and hydrophobicity as observed for STIM2, but also eliminates the more robust SOCE response mediated by STIM1. Collectively, our data show that the 2β insert directly precludes Orai1 channel activation by inducing structural perturbations in the STIM CC region.
Keywords: Fura-2; alterative splicing; calcium signaling; coiled-coil; store-operated calcium entry (SOCE); stromal interaction molecule-1 (STIM1); stromal interaction molecule-2 (STIM2); structure.
Conflict of interest statement
The authors declare no conflict of interest.
Figures


Similar articles
-
Cross-talk between N-terminal and C-terminal domains in stromal interaction molecule 2 (STIM2) determines enhanced STIM2 sensitivity.J Biol Chem. 2019 Apr 19;294(16):6318-6332. doi: 10.1074/jbc.RA118.006801. Epub 2019 Mar 1. J Biol Chem. 2019. PMID: 30824535 Free PMC article.
-
Interplay between ER Ca2+ Binding Proteins, STIM1 and STIM2, Is Required for Store-Operated Ca2+ Entry.Int J Mol Sci. 2018 May 19;19(5):1522. doi: 10.3390/ijms19051522. Int J Mol Sci. 2018. PMID: 29783744 Free PMC article.
-
Cross-linking of Orai1 channels by STIM proteins.Proc Natl Acad Sci U S A. 2018 Apr 10;115(15):E3398-E3407. doi: 10.1073/pnas.1720810115. Epub 2018 Mar 26. Proc Natl Acad Sci U S A. 2018. PMID: 29581306 Free PMC article.
-
Store-Independent Orai Channels Regulated by STIM.In: Kozak JA, Putney JW Jr, editors. Calcium Entry Channels in Non-Excitable Cells. Boca Raton (FL): CRC Press/Taylor & Francis; 2018. Chapter 11. In: Kozak JA, Putney JW Jr, editors. Calcium Entry Channels in Non-Excitable Cells. Boca Raton (FL): CRC Press/Taylor & Francis; 2018. Chapter 11. PMID: 30299650 Free Books & Documents. Review.
-
Molecular physiology and pathophysiology of stromal interaction molecules.Exp Biol Med (Maywood). 2018 Mar;243(5):451-472. doi: 10.1177/1535370218754524. Epub 2018 Jan 24. Exp Biol Med (Maywood). 2018. PMID: 29363328 Free PMC article. Review.
Cited by
-
STIM1 activation of Orai1.Cell Calcium. 2019 Jan;77:29-38. doi: 10.1016/j.ceca.2018.11.009. Epub 2018 Nov 30. Cell Calcium. 2019. PMID: 30530091 Free PMC article. Review.
-
New insights into the stromal interaction molecule 2 function and its impact on the immunomodulation of tumor microenvironment.Cell Biosci. 2024 Sep 13;14(1):119. doi: 10.1186/s13578-024-01292-8. Cell Biosci. 2024. PMID: 39272139 Free PMC article. Review.
-
Advances in Intracellular Calcium Signaling Reveal Untapped Targets for Cancer Therapy.Biomedicines. 2021 Aug 24;9(9):1077. doi: 10.3390/biomedicines9091077. Biomedicines. 2021. PMID: 34572262 Free PMC article. Review.
-
Orai1 inhibitor STIM2β regulates myogenesis by controlling SOCE dependent transcriptional factors.Sci Rep. 2019 Jul 25;9(1):10794. doi: 10.1038/s41598-019-47259-5. Sci Rep. 2019. PMID: 31346235 Free PMC article.
-
Structural features of STIM and Orai underlying store-operated calcium entry.Curr Opin Cell Biol. 2019 Apr;57:90-98. doi: 10.1016/j.ceb.2018.12.012. Epub 2019 Feb 1. Curr Opin Cell Biol. 2019. PMID: 30716649 Free PMC article. Review.
References
MeSH terms
Substances
Grants and funding
LinkOut - more resources
Full Text Sources
Miscellaneous

