

Multi-Sip Time⁻Intensity Evaluation of Retronasal Aroma after Swallowing Oolong Tea Beverage
- PMID: 30366388
- PMCID: PMC6262627
- DOI: 10.3390/foods7110177
Multi-Sip Time⁻Intensity Evaluation of Retronasal Aroma after Swallowing Oolong Tea Beverage
Abstract
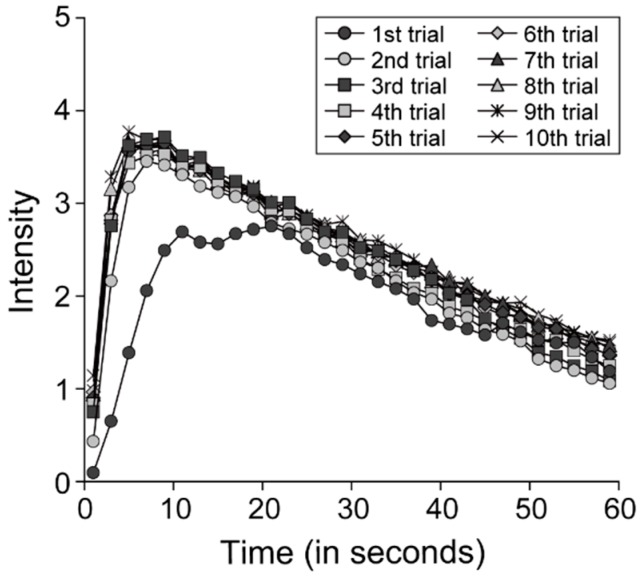
In most cases, a meal cannot be finished with a single bite and sip. During eating and drinking, consumers receive dynamic food perceptions from sensory attributes in foods. Thus, we performed multi-sip time⁻intensity (TI) evaluation of sensory attribute. In each of ten trials, the participant evaluated continuously the intensity of retronasal aroma for 60 s after swallowing oolong tea. We compared the TI parameters (Imax: maximum intensity, Tmax: time point at which intensity reached the maximum value, AUC: area under the TI curve, Dplateau: duration between the first and last time points with values exceeding 90% of the maximum intensity, Rinc: rate of intensity increase between the first time points with values exceeding 5% and 90% of the maximum intensity, and Rdec: rate of intensity decrease between the last time points with values exceeding 5% and 90% of the maximum intensity) and TI curves among the ten trials, and approximated each TI curve with an exponential model. Some TI parameters (Imax, Tmax, AUC, and Rinc) differed significantly between the first and subsequent trials. The TI curve was significantly lower in the first trial than in the subsequent trials, and TI curve during the time from starting the evaluation to reaching maximum intensity was significantly lower in the second trial than in the subsequent trials. The time constant of the fitted exponential function revealed that the decay of retronasal aroma intensity was slightly faster in the second through fourth trials than in the first and the fifth through tenth trials. These results indicate that olfaction might be more perceptive while consumers sip a cup of the beverage.
Keywords: consumption experience; multi-sip; oolong tea beverage; retronasal aroma; time–intensity; warm-up sample.
Conflict of interest statement
The authors declare no conflict of interest. The founding sponsors had no role in the design of the study; in the collection, analyses, or interpretation of data; in the writing of the manuscript; or in the decision to publish the results.
Figures


References
-
- Sudre J., Pineau N., Loret C., Martin N. Comparison of methods to monitor liking of food during consumption. Food Qual. Prefer. 2012;24:179–189. doi: 10.1016/j.foodqual.2011.10.013. - DOI
-
- Wang Q.J., Mesz B., Spence C. Assessing the impact of music on basic taste perception using time intensity analysis. In: Velasco C., Nijholt A., Obrist M., Okajima K., Schifferstein R., Spence C., editors. MHFI’17 Proceedings of the 2nd ACM SIGCHI International Workshop on Multisensory Approaches to Human-Food Interaction. Association for Computing Machinery; New York, NY, USA: 2017. pp. 18–22.
-
- Lee III W.E. Single-point versus time-intensity sensory measurements: An informational entropy analysis. J. Sens. Stud. 1989;4:19–30. doi: 10.1111/j.1745-459X.1989.tb00455.x. - DOI
-
- Cadena R.S., Bolini H.M.A. Time–intensity analysis and acceptance test for traditional and light vanilla ice cream. Food Res. Int. 2011;44:677–683. doi: 10.1016/j.foodres.2010.12.012. - DOI
Grants and funding
LinkOut - more resources
Full Text Sources
Research Materials
Miscellaneous
