. 2018 Nov 1;32(21-22):1361-1366.
doi: 10.1101/gad.318212.118. Epub 2018 Oct 26.

LMI1 homeodomain protein regulates organ proportions by spatial modulation of endoreduplication

Affiliations

LMI1 homeodomain protein regulates organ proportions by spatial modulation of endoreduplication

Francesco Vuolo et al. Genes Dev. .

Erratum in

Abstract

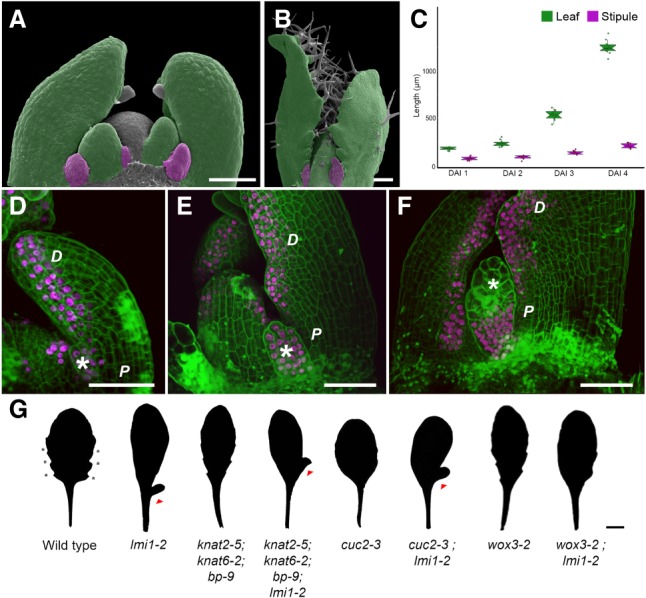
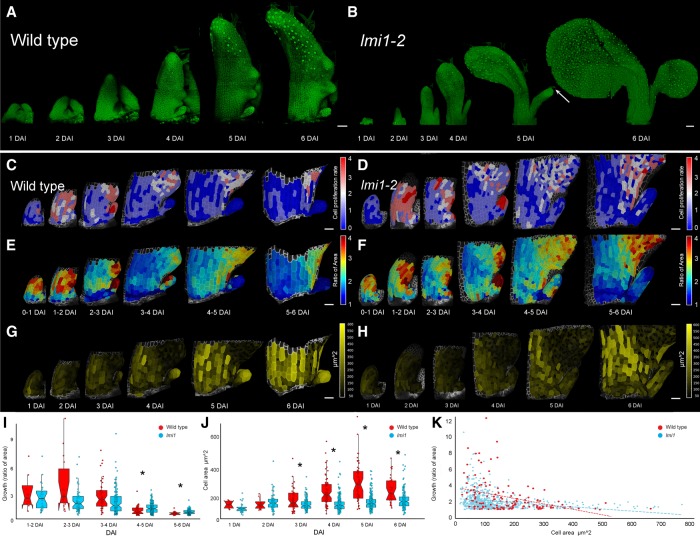
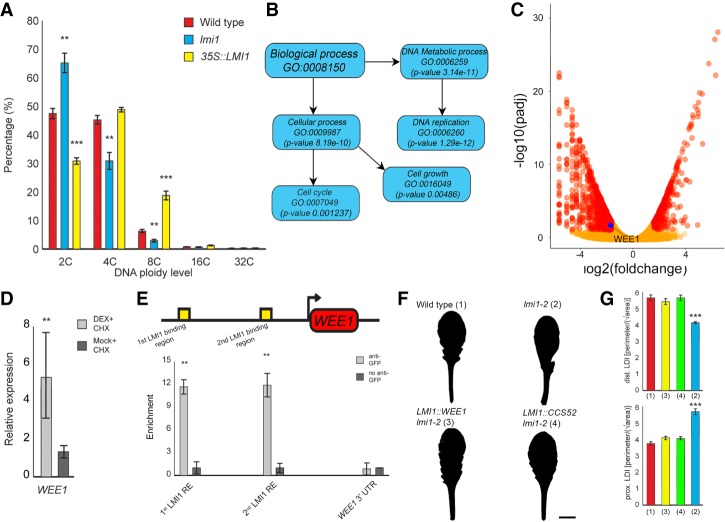
How the interplay between cell- and tissue-level processes produces correctly proportioned organs is a key problem in biology. In plants, the relative size of leaves compared with their lateral appendages, called stipules, varies tremendously throughout development and evolution, yet relevant mechanisms remain unknown. Here we use genetics, live imaging, and modeling to show that in Arabidopsis leaves, the LATE MERISTEM IDENTITY1 (LMI1) homeodomain protein regulates stipule proportions via an endoreduplication-dependent trade-off that limits tissue size despite increasing cell growth. LM1 acts through directly activating the conserved mitosis blocker WEE1, which is sufficient to bypass the LMI1 requirement for leaf proportionality.

Keywords: leaf development; live imaging; organ proportions; plant homeobox.


Figures

Figure 1.
Figure 1.
LATE MERISTEM IDENTITY1 (LMI1) is expressed in the distal leaf domain and stipule. (AC) Wild-type leaves (green) and stipules (purple) in false-colored scanning electron micrographs at 2 d after leaf initiation (DAI) (A) and 8 DAI (B) and length (in micrometers) at successive DAI (C). n = 10 leaves. Mean ± SEM. (DF) Confocal laser scanning microscopy (CLSM) of LMI1::LMI1:VENUS expression (magenta) in propidium iodide (PI)-stained (green) leaf primordia at 3 DAI (D), 5 DAI (E), and 7 DAI (F). n = 5 independent T2 lines. (Asterisks) Stipules; (D) distal leaf domains; (P) proximal leaf domains. Bars: A,B,DF, 50 µm. (G) Silhouettes of adult leaves from wild-type and mutant plants. For penetrance scoring, see Supplemental Table 1. (Triangles) Ectopic lobes; (asterisks) serrations. Bar, 1 cm.
Figure 2.
Figure 2.
LMI1 represses tissue growth and cell proliferation in stipules. (A,B) Time-lapse CLSM of leaf 11 developing over 1–6 DAI in wild type (A) and lmi1-2 (B). Cells are outlined by PM-YFP expression. (Arrow) Trichome. (CH) Cell proliferation rate (number of divisions; C,D), growth (ratio of areas; E,F), and cell area (G,H) quantified in wild-type (C,E,G) and lmi1-2 (D,F,H) leaf 11 time-lapse series. Scales are shown in heat maps. n = 5. (I,J) Quantification of cell growth (ratio of areas; I) and area (square micrometers; J) in wild-type (red) and lmi1-2 (blue) leaf 11. n = 3 time-lapse series; n > 50 cells. Mean ± SD. (*) P < 0.05, KS-test (I) and Student's t-test (J). (K) Cell area and growth values pooled for all DAI in wild-type (red; n = 139 cells) and lmi1-2 (blue; n = 690 cells) leaf 11. Dashed lines represent linear regressions. Bars: AH, 50 µm.
Figure 3.
Figure 3.
LMI1 promotes endoreduplication by activating WEE1 expression. (A) Ploidy analysis by flow cytometry in wild-type (red), lmi1-2 (blue), and 35S::LMI1 (yellow) leaves. n = 5. Mean percentage ± SEM. (**) P < 0.01; (***) P < 0.001, ANOVA. (B) Subgroup of the GO categories enriched among differentially expressed genes (DEGs) between wild type and lmi1-2, derived from RNA-seq analysis. n = 3. (C) Volcano plot showing DEGs (red) and non-DEGs (orange) in lmi1-2 compared with wild-type seedlings, and the WEE1 gene with a putative LMI1-binding site (blue). (D) Quantitative RT–PCR (qRT–PCR) of WEE1 expression in lmi1-2;LMI1::LMI1:GR plants treated with dexamethasone (DEX) + cycloheximide (CHX) (gray) or mock + CHX (dark gray) 3 h after treatment. n = 3. Mean ± SEM. (**) P < 0.01, Student's t-test. (E, top) WEE1 gene model with upstream regions containing putative LMI1-binding sequences marked in yellow. The arrow indicates transcription start. (Bottom) ChIP-qRT–PCR (chromatin immunoprecipitation [ChIP] combined with qRT–PCR) after anti-GFP (gray) or control IgG (dark gray) pull-down in LMI1::LMI1:VENUS shows significant association of LMI1 with chromatin in regions containing the putative binding sites. n = 3. Mean ± SEM. (**) P < 0.0, Student's t-test1. WEE1 3′ untranslated region (UTR) was used as negative control. (F) Silhouettes of leaf 11 in wild-type, lmi1-2, lmi1-2;LMI1::WEE1, and lmi1-2;LMI1::CCS52 plants. n = 15 T2 lines. (G) Dissection indices of the distal domain (top graph) and proximal domain (bottom graph) in the lines in F, with relative numbers matching the ones in F. n = 10, each line. Bar, 1 cm.
Figure 4.
Figure 4.
Modeling the regulation of organ size by endoreduplication and conservation of LMI1 function in Cardamine hirsuta. (A,B) Cell population model incorporating proliferation, endoreduplication, and differentiation. (A) The start time for endoreduplication (yellow line) is varied relative to the window of proliferation (orange line), and both processes are terminated by differentiation (green line). (B) Simulations showing fold increase of organ size as a function of endoreduplication start time relative to the size increase produced by proliferation alone (orange line; i.e., when Re = 0). The color of the curve indicates when windows of proliferation and endoreduplication overlap in time (yellow and orange) or occur sequentially (yellow only). (C–H) Leaves of wild-type (C,E), 35S::amiR-LMI1 (D,F), rco (G), and 35S::amiR-LMI1;rco (H) representative leaf 5 shown for n = 15 independent lines per genotype. Bars: C,D,G,H, 1 cm; E,F (scanning electron micrographs of developing leaves), 100 µm. (Red dots) Stipules; (asterisks) ectopic leaves.

References

    1. Andres RJ, Coneva V, Frank MH, Tuttle JR, Samayoa LF, Han SW, Kaur B, Zhu L, Fang H, Bowman DT, et al. 2017. Modifications to a LATE MERISTEM IDENTITY1 gene are responsible for the major leaf shapes of Upland cotton (Gossypium hirsutum L.). Proc Natl Acad Sci 114: E57–E66. - PMC - PubMed
    1. Bar M, Ori N. 2014. Leaf development and morphogenesis. Development 141: 4219–4230. - PubMed
    1. Barbier de Reuille P, Routier-Kierzkowska AL, Kierzkowski D, Bassel GW, Schupbach T, Tauriello G, Bajpai N, Strauss S, Weber A, Kiss A, et al. 2015. MorphoGraphX: a platform for quantifying morphogenesis in 4D. Elife 4: 05864. - PMC - PubMed
    1. Bilsborough GD, Runions A, Barkoulas M, Jenkins HW, Hasson A, Galinha C, Laufs P, Hay A, Prusinkiewicz P, Tsiantis M. 2011. Model for the regulation of Arabidopsis thaliana leaf margin development. Proc Natl Acad Sci 108: 3424–3429. - PMC - PubMed
    1. Bramsiepe J, Wester K, Weinl C, Roodbarkelari F, Kasili R, Larkin JC, Hulskamp M, Schnittger A. 2010. Endoreplication controls cell fate maintenance. PLoS Genet 6: e1000996. - PMC - PubMed

Publication types

MeSH terms