. 2018 Nov 1;32(21-22):1420-1429.
doi: 10.1101/gad.314286.118. Epub 2018 Oct 26.

Mutant TRP53 exerts a target gene-selective dominant-negative effect to drive tumor development

Affiliations

Mutant TRP53 exerts a target gene-selective dominant-negative effect to drive tumor development

Brandon J Aubrey et al. Genes Dev. .

Abstract

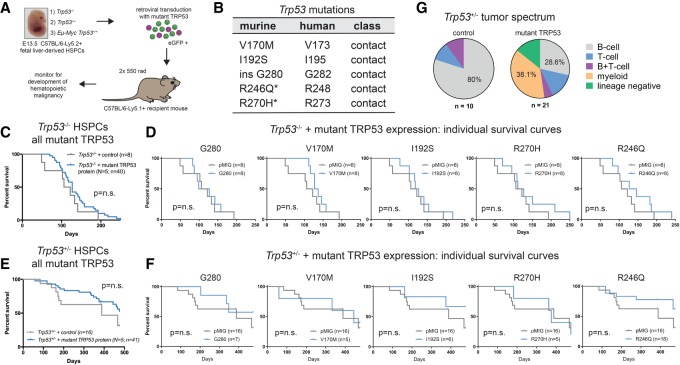
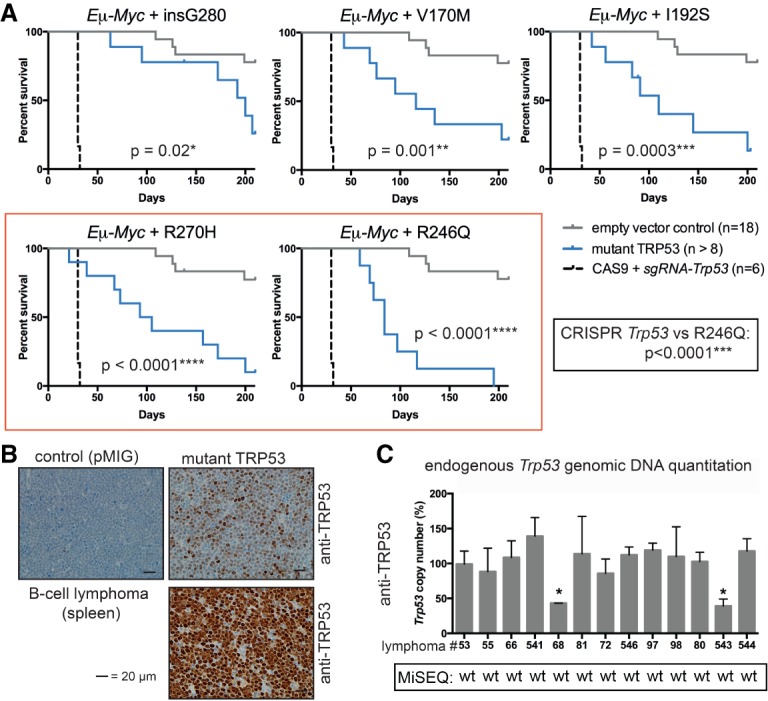
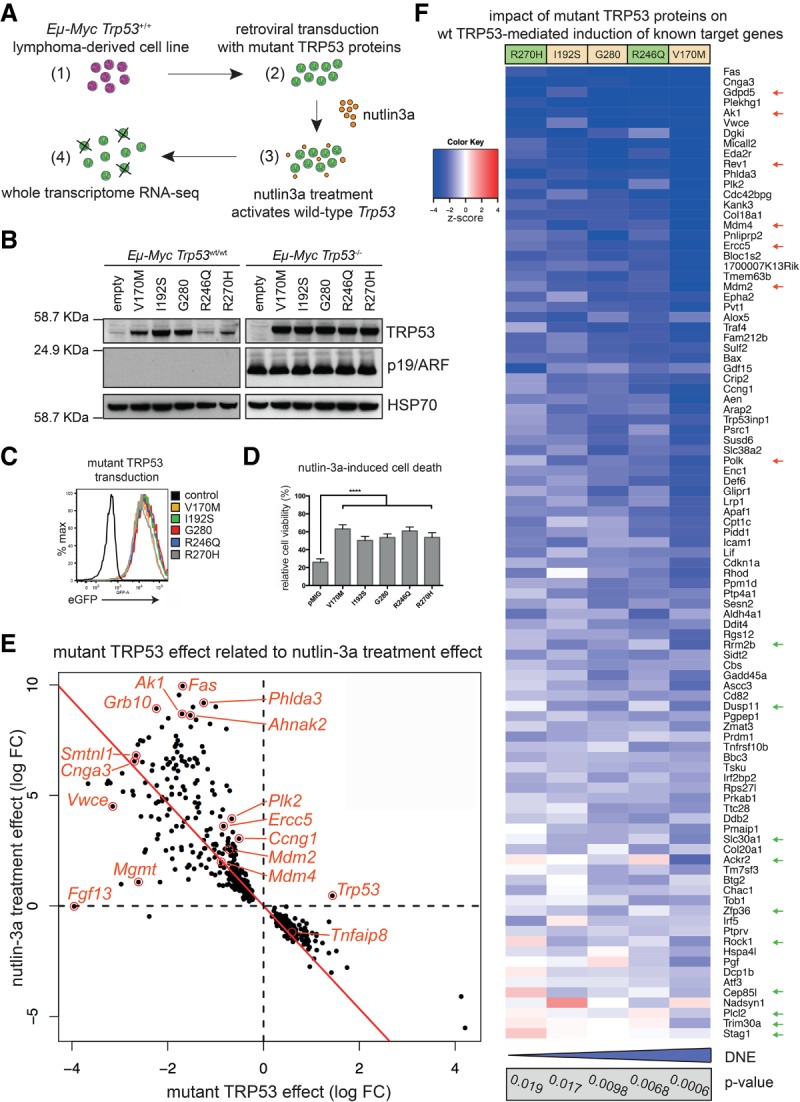
Mutations in Trp53, prevalent in human cancer, are reported to drive tumorigenesis through dominant-negative effects (DNEs) over wild-type TRP53 function as well as neomorphic gain-of-function (GOF) activity. We show that five TRP53 mutants do not accelerate lymphomagenesis on a TRP53-deficient background but strongly synergize with c-MYC overexpression in a manner that distinguishes the hot spot Trp53 mutations. RNA sequencing revealed that the mutant TRP53 DNE does not globally repress wild-type TRP53 function but disproportionately impacts a subset of wild-type TRP53 target genes. Accordingly, TRP53 mutant proteins impair pathways for DNA repair, proliferation, and metabolism in premalignant cells. This reveals that, in our studies of lymphomagenesis, mutant TRP53 drives tumorigenesis primarily through the DNE, which modulates wild-type TRP53 function in a manner advantageous for neoplastic transformation.

Keywords: TRP53; TRP53 target genes; dominant-negative effect; tumorigenesis.


Figures

Figure 1.
Figure 1.
Mutant TRP53 proteins do not accelerate lymphoma development in the Trp53−/− and Trp53+/− genetic backgrounds. (A) HSPC reconstitution model to examine the impact of mutant TRP53 protein expression on tumor development. (B) The mutant TRP53 proteins studied, with the corresponding human amino acid position indicated. (*) Hot spot mutation. (CF) Kaplan-Meier survival curves for mice reconstituted with Trp53−/− (C,D) or Trp53+/− (E,F) HSPCs transduced with empty vector (pMIG) or expression vectors for each of the five mutant TRP53 proteins that were tested. (n) Number of mice. C and E represent composite survival curves of all TRP53 mutants (N = 5) combined. P-values were determined by log rank (Mantel-Cox) test. (G) Tumor phenotype summary for mutant TRP53 transduced Trp53+/− HSPC reconstitution experiments (from E and F). The tumor spectra for the individual TRP53 mutants are shown in Supplemental Figure S1G.
Figure 2.
Figure 2.
Overexpression of mutant TRP53 proteins accelerates lymphoma development in an Eμ-Myc;Trp53+/+ background and relieves selective pressure for mutation of endogenous Trp53 genes. (A) Kaplan-Meier survival curves for mice reconstituted with Eμ-Myc;Trp53+/+ HSPCs comparing empty vector control (pMIG), CRISPR/Cas9 Trp53 knockout, and each mutant TRP53 protein (V170M, I192S, G280, R246Q, and R270H). P-values were determined by log rank (Mantel-Cox) test. (B) Selected TRP53 protein immunohistochemistry in lymphomas from the Eμ-Myc hematopoietic reconstitution experiments (mice #88 and #541 plus control mouse #53). (C) Endogenous Trp53 allele copy number in lymphomas from the Eμ-Myc hematopoietic reconstitution experiments as determined by genomic DNA quantitative PCR (pMIG/control: #53; V170M: #55, #66, and #541; G280: #68 and #81; I192S: #72 and #546; R246Q: #97 and #98; R270H: #80, #543, and #544). Primary cells from Trp53−/− and Trp53+/− mice were used as controls. Data from MiSeq analysis throughout the coding region of the DNA-binding domain (exons 4–10) are indicated. (wt) Wild-type sequence. Data represent mean ± SEM. (*) P < 0.05, comparing lymphoma sample with wild-type control as determined by paired t-test.
Figure 3.
Figure 3.
Mutant TRP53 proteins exert a target gene-selective DNE. (A) Experimental approach to examine the DNE exerted by the mutant TRP53 proteins in Eμ-Myc lymphoma-derived cell lines. (B) Analysis of mutant TRP53 transduced Eμ-Myc;Trp53+/+ and Eμ-Myc;Trp53−/− lymphoma-derived cell lines by Western blot with HSP70 as a loading control. (C) Uniform eGFP expression in the mutant TRP53 transduced cell lines shown in B, assessed by flow cytometry. (D) Mutant TRP53 proteins inhibit nutlin-3a-induced apoptosis. n = 5 different cell lines with two to four independent experiments for each cell line. Data represent mean ± SEM. Paired two-tailed t-test was performed comparing pMIG (empty vector control) with each mutant TRP53 individually. For each mutant, P < 0.0001 (****). (E) Differentially expressed genes in mutant TRP53 transduced Eμ-Myc lymphoma lines after treatment with nutlin-3a. The scatter plot shows log fold changes following nutlin-3a treatment versus mutant TRP53 effect log fold changes. The plot displays the 455 genes that were differentially expressed in the nutlin-3a-treated mutant TRP53 transduced samples (false discovery rate [FDR] < 0.1) versus the nutlin-3a treatment effect in pMIG (control) samples. The red line shows the least squares line with zero intercept. The mutant TRP53 effect shows a strong inverse correlation to the treatment effect. (F) Heat map depicting the impact of each mutant TRP53 protein on the induction of known wild-type TRP53 target genes after nutlin-3a treatment, color-coded by z-score (2: P < 0.05; 3: P < 0.003; 4: P < 0.0001). The P-value for individual mutant TRP53 proteins under the full TRP53 target gene set test is indicated (gray box) with the relative overall strength of the DNE indicated (blue bar). Gene expression distinguishing hot spot TRP53 mutations (green arrows) and relatively strongly repressed genes of interest are indicated (red arrows).
Figure 4.
Figure 4.
The hot spot mutant TRP53 proteins R246Q and R270H selectively deregulate metabolic, cell proliferation, and DNA repair pathways in preleukemic cells. Mice were reconstituted with empty vector (pMIG) control or mutant TRP53 (R246Q and R270H) transduced Eμ-Myc;Tp53+/+ HSPCs, and their preleukemic cells were analyzed at 4 wk. (A) Bone marrow-derived pre-B/pro-B cells calculated from flow cytometry and total femur cell counts. Mutant TRP53 R246Q (n = 6) and R270H (n = 6) are compared with pMIG control (n = 5). P-values were determined by unpaired t-test. (B) Cell death after administration of 5 µM nutlin-3a or 0.5 µg/mL docetaxel or exposure to 2.5 Gy of γ-irradiation. Data represent mean ± SEM. Mutant TRP53 R246Q (n = 3) and R270H (n = 3) are compared with pMIG control (n = 3). P-values were determined by paired Student's t-test. (C) Mitochondria number and activity assessed in bone marrow-derived preleukemic pre-B/pro-B cells. Representative histogram for R246Q mutant TRP53 protein transduced preleukemic B lymphoid cells as compared with empty vector (pMIG) control transduced cells. Median fluorescence intensity summary data represent mean ± SEM. pMIG: n = 3; mutant TRP53: N = 2 mutations; n = 8 replicates. P-value was determined by unpaired t-test. (D) Cell cycle analysis of preleukemic B lymphoid cells using DAPI staining and the Watson pragmatic model for analysis. Data represent mean ± SEM. Mutant TRP53 R246Q (n = 6) and R270H (n = 6) are compared with pMIG control (n = 5). P-values were determined by unpaired t-test. (E) Representative images from confocal microscope. Images shown are deconvoluted maximum projection images using Fiji software. (Blue) DAPI for nucleus; (red) γH2AX foci. (F) Quantitation of γH2AX focus number per cell nucleus and γH2AX focus area per cell nucleus. Data represent mean ± SEM. Control: n = 4; mutant TRP53 (R246Q and R270H): n = 14. P-value was determined by unpaired t-test. (*) P < 0.05; (**) P < 0.01. (G,H) RNA-seq analysis of untreated (directly ex vivo) preleukemic Eµ-Myc B lymphoid cells expressing mutant TRP53 proteins (data for all five TRP53 mutants combined) compared with empty vector (pMIG) transduced control cells. (G) Log2 fold changes with differentially expressed genes highlighted (FDR < 0.05). (H) Barcode enrichment plot depicting down-regulation of the TRP53 gene set test (P-value by FRY test). (I) Model: Mutant TRP53 exerts a selective DNE that modulates wild-type TRP53 function.

References

    1. Adams JM, Harris AW, Pinkert CA, Corcoran LM, Alexander WS, Cory S, Palmiter RD, Brinster RL. 1985. The c-myc oncogene driven by immunoglobulin enhancers induces lymphoid malignancy in transgenic mice. Nature 318: 533–538. - PubMed
    1. Aubrey BJ, Kelly GL, Kueh AJ, Brennan MS, O'Connor L, Milla L, Wilcox S, Tai L, Strasser A, Herold MJ. 2015. An inducible lentiviral guide RNA platform enables the identification of tumor-essential genes and tumor-promoting mutations in vivo. Cell Rep 10: 1422–1432. - PubMed
    1. Basak S, Jacobs SB, Krieg AJ, Pathak N, Zeng Q, Kaldis P, Giaccia AJ, Attardi LD. 2008. The metastasis-associated gene Prl-3 is a p53 target involved in cell-cycle regulation. Mol Cell 30: 303–314. - PMC - PubMed
    1. Baugh EH, Ke H, Levine AJ, Bonneau RA, Chan CS. 2018. Why are there hotspot mutations in the TP53 gene in human cancers? Cell Death Differ 25: 154–160. - PMC - PubMed
    1. Bouaoun L, Sonkin D, Ardin M, Hollstein M, Byrnes G, Zavadil J, Olivier M. 2016. TP53 variations in human cancers: new lessons from the IARC TP53 database and genomics data. Hum Mutat 37: 865–876. - PubMed

Publication types

Substances