. 2019 Feb;9(2):282-301.
doi: 10.1158/2159-8290.CD-18-0710. Epub 2018 Oct 26.

IL1-Induced JAK/STAT Signaling Is Antagonized by TGFβ to Shape CAF Heterogeneity in Pancreatic Ductal Adenocarcinoma

Affiliations

IL1-Induced JAK/STAT Signaling Is Antagonized by TGFβ to Shape CAF Heterogeneity in Pancreatic Ductal Adenocarcinoma

Giulia Biffi et al. Cancer Discov. 2019 Feb.

Abstract

Pancreatic ductal adenocarcinoma (PDAC) is poorly responsive to therapies and histologically contains a paucity of neoplastic cells embedded within a dense desmoplastic stroma. Within the stroma, cancer-associated fibroblasts (CAF) secrete tropic factors and extracellular matrix components, and have been implicated in PDAC progression and chemotherapy resistance. We recently identified two distinct CAF subtypes characterized by either myofibroblastic or inflammatory phenotypes; however, the mechanisms underlying their diversity and their roles in PDAC remain unknown. Here, we use organoid and mouse models to identify TGFβ and IL1 as tumor-secreted ligands that promote CAF heterogeneity. We show that IL1 induces LIF expression and downstream JAK/STAT activation to generate inflammatory CAFs and demonstrate that TGFβ antagonizes this process by downregulating IL1R1 expression and promoting differentiation into myofibroblasts. Our results provide a mechanism through which distinct fibroblast niches are established in the PDAC microenvironment and illuminate strategies to selectively target CAFs that support tumor growth. SIGNIFICANCE: Understanding the mechanisms that determine CAF heterogeneity in PDAC is a prerequisite for the rational development of approaches that selectively target tumor-promoting CAFs. Here, we identify an IL1-induced signaling cascade that leads to JAK/STAT activation and promotes an inflammatory CAF state, suggesting multiple strategies to target these cells in vivo. See related commentary by Ling and Chiao, p. 173. This article is highlighted in the In This Issue feature, p. 151.


Conflict of interest statement

Disclosure of potential conflict of interest: The authors declare no potential conflicts of interest.

Figures

Figure 1:
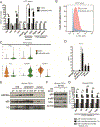
Figure 1:. Active NF-κB signaling is associated with the iCAF phenotype.
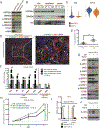
A. qPCR analysis of Il1a, Il1b, Tnf, Il1r1, Tnfrsf1a, and epithelial (Epcam and Cdh1) and fibroblast (Pdgfra, Pdpn and Col1a1) markers in EpCAM+ (epithelial cells) relative to PDPN+ (CAFs) cells sorted from KPC tumors. Results show mean ± SEM (standard error of the mean) of 6 biological replicates. *P<0.05, **P<0.01, ***P<0.001, paired Student’s t test. B. Representative flow cytometric analysis of IL-1R1 in EpCAM+ (epithelial cells) and PDPN+ (CAFs) cells in KPC tumors (n=3). Percentages shown were calculated from the parental gate. C. Violin plots showing single cell RNA-sequencing analysis of Il1a, Il1b, Il1r1, Epcam and Col1a1 of a representative KPC tumor (n=2) in CAFs (orange) and epithelial cells (green). D. ELISA of IL-1α from media of mouse 2D KPC cells (n=2), tumor (T) (n=8) and metastatic (M) (n=8) organoids, and controls that do not induce the iCAF phenotype (n=2 for each control). Results show mean ± SEM. E. Western blot analysis of the nuclear factor NF-κB p65 subunit following nuclear fractionation of quiescent PSCs (qP, PSCs cultured in Matrigel with control media, i.e. 5% FBS DMEM, for 4 days), iCAFs (iC, PSCs cultured in Matrigel with tumor organoid-conditioned media for 4 days) and myCAFs (myC, PSCs cultured in monolayer with 5% FBS DMEM). Loading controls, HSP90α (cytoplasmic fractions) and H3 (nuclear fractions). The same amount of protein lysate was loaded in each lane. F. Western blot analysis of total and phosphorylated p65 (p-p65) and of total IκBα in PSCs cultured in Matrigel in control media or tumor organoid-conditioned media (CM) in the presence or absence of 30 μM IKK-β inhibitor (IKK-βi) ML102B for 30 min. Loading control, ACTIN. G. qPCR analysis of iCAF markers (Il1a, Il6, Lif, Cxcl1 and Csf3) in PSCs cultured in Matrigel with control media or tumor organoid-conditioned media for 1 h in the presence or absence of 30 μM ML102B. Results show mean ± SEM of 3 biological replicates. *P<0.05, **P<0.01, paired Student’s t test.
Figure 2:
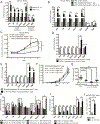
Figure 2:. IL-1 signaling is the main pathway responsible for the induction of an inflammatory phenotype in CAFs.
A. qPCR analysis of iCAF (Il1a, Il6, Lif, Cxcl1 and Csf3) and myCAF (Acta2 and Ctgf) markers in PSCs cultured in Matrigel in control media in the presence or absence of 1 ng/mL mouse IL-1α for 4 days. Results show mean ± SEM of 2 biological replicates. *P<0.05, **P<0.01, ***P<0.001, paired Student’s t test. B. qPCR analysis of Il1a, Il6, Lif, Cxcl1, Csf3, Acta2 and Ctgf in PSCs cultured in Matrigel with control media or tumor organoid-conditioned media in the presence of a neutralizing antibody targeting IL-1α or an IgG control for 4 days. Results show mean ± SEM of 6 biological replicates. *P<0.05, **P<0.01, paired Student’s t test. C. Proliferation curves of PSCs cultured in Matrigel with control media or tumor organoid-conditioned media in the presence of a neutralizing antibody targeting IL-1α or an IgG control. Results show mean ± SEM of 3 biological replicates. **P<0.01, ***P<0.001, unpaired Student’s t test calculated for the last time point. D. qPCR analysis of Il1a, Il6, Lif, Cxcl1, Csf3, Acta2 and Ctgf in PSCs cultured in Matrigel in transwell with Rosa26-targeted controls or IL-1α knockout (KO) tumor organoids for 4 days. Results show mean ± SEM of 9 and 11 biological replicates, respectively. ***P<0.001, paired Student’s t test. E. qPCR analysis of Il1a, Il6, Lif, Cxcl1, Csf3, Acta2 and Ctgf in Rosa26-targeted controls and IL-1R1 knockout PSCs cultured in Matrigel in transwell with tumor organoids for 4 days. Results show mean ± SEM of 7 biological replicates. *P<0.05, ***P<0.001, paired Student’s t test. F. Proliferation curves of Rosa26-targeted controls and IL-1α knockout tumor organoids. Results show mean ± SD (standard deviation) of 5 technical replicates. *P<0.05, **P<0.01, unpaired Student’s t test calculated for the last time point. G. Tumor volume analysis based on ultrasound measurements of orthotopically grafted organoids (OGOs) following ~3 weeks from transplantation of Rosa26-targeted controls and IL-1α knockout tumor organoids in nu/nu mice. Results show mean ± SEM of 14 (control OGOs), 7 (1C or 1D OGOs) and 8 (1E OGOs) biological replicates. **P<0.01, ***P<0.001, unpaired Student’s t test. H. qPCR analysis of Il1a, Il6, Lif, Cxcl1, Csf3, Acta2 and Ctgf in CAFs sorted from OGOs derived from transplantation of Rosa26-targeted controls and IL-1α knockout tumor organoids in nu/nu mice. Results show mean ± SEM of 4 (organoids), 12 (control OGOs) and 19 (IL-1α knockout OGOs) biological replicates. Different symbols identify the 3 knockout lines. *P<0.05, **P<0.01, ***P<0.001, paired Student’s t test. I. qPCR analysis of Il1a, Il6, Lif, Cxcl1, Csf3, Acta2, Ctgf and Il1r1 in CAFs sorted from tumors derived by orthotopic transplantation of 3 tumor organoid lines in IL-1R1 knockout or C57BL/6J controls. Results show mean ± SEM of 9 biological replicates. *P<0.05, **P<0.01, ***P<0.001, paired Student’s t test. J. Quantification of Ly6C- myCAF/Ly6C+ iCAF ratio in tumors derived by orthotopic transplantation of 2 tumor organoid lines in B6J or IL-1R1 knockout hosts, as assessed by flow cytometry. Results show mean ± SEM of 5 biological replicates. **P<0.01, unpaired Student’s t test.
Figure 3:
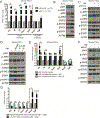
Figure 3:. IL-1-mediated induction of autocrine LIF in PSCs activates JAK/STAT signaling and promotes iCAF formation.
A. qPCR analysis of iCAF (Il1a, Il6, Lif, Cxcl1 and Csf3) and myCAF (Acta2 and Ctgf) markers in PSCs cultured in Matrigel in control media in the presence or absence of 1 ng/mL mouse IL-1α for 1 h. Results show mean ± SEM of 2 biological replicates. *P<0.05, **P<0.01, paired Student’s t test. B. Western blot analysis of p-JAK1, JAK1, p-JAK2, JAK2, p-STAT1, STAT1, p-STAT3 and STAT3 in PSCs cultured in Matrigel with control media in the presence or absence of 1 ng/mL mouse IL-1α for 4 days. Loading control, ACTIN. C. Western blot analysis of p-JAK1, JAK1, p-JAK2, JAK2, p-STAT1, STAT1, p-STAT3 and STAT3 in PSCs cultured in Matrigel with control media or tumor organoid-conditioned media (CM) in the presence of a neutralizing antibody targeting IL-1α or an IgG control for 4 days. Loading control, ACTIN. D. Western blot analysis of p-JAK1, JAK1, p-JAK2, JAK2, p-STAT1, STAT1, p-STAT3 and STAT3 in PSCs cultured in Matrigel with control media or tumor organoid-conditioned media (CM) from Rosa26-targeted controls or IL-1α knockout tumor organoids for 4 days. Loading control, ACTIN. E. qPCR analysis of Il1a, Il6, Lif, Cxcl1, Csf3, Acta2 and Ctgf in PSCs cultured in Matrigel with control media or tumor organoid-conditioned media in the presence of a neutralizing antibody targeting LIF or an IgG control for 4 days. Results show mean ± SEM of 6 biological replicates. *P<0.05, **P<0.01, paired Student’s t test. F. Western blot analysis of p-JAK1, JAK1, p-JAK2, JAK2, p-STAT1, STAT1, p-STAT3 and STAT3 in PSCs cultured in Matrigel with control media or tumor organoid-conditioned media (CM) in the presence of a neutralizing antibody targeting LIF or an IgG control for 4 days. Loading control, ACTIN. G. qPCR analysis of Il1a, Il6, Lif, Cxcl1, Csf3, Acta2 and Ctgf in LIF knockout PSCs compared to Rosa26-targeted controls cultured in Matrigel in transwell with tumor organoids for 4 days. Results show mean ± SEM of 4 biological replicates. *P<0.05, **P<0.01, ***P<0.001, paired Student’s t test.
Figure 4:
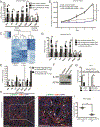
Figure 4:. JAK/STAT signaling mediates the induction of the iCAF phenotype.
A. qPCR analysis of iCAF (Il1a, Il6, Lif, Cxcl1 and Csf3) and myCAF (Acta2 and Ctgf) markers in PSCs cultured in Matrigel with control media or tumor organoid-conditioned media in the presence or absence of 500 nM JAK inhibitor (JAKi) AZD1480 for 4 days. Results show mean ± SEM of 5 biological replicates. *P<0.05, **P<0.01, paired Student’s t test. B. Proliferation curves of PSCs cultured in Matrigel with control media or tumor organoid-conditioned media in the presence or absence of 500 nM JAKi. Results show mean ± SEM of 3 biological replicates. ***P<0.001, unpaired Student’s t test calculated for the last time point. C. RNA-sequencing analysis of quiescent PSCs (n=3), iCAFs (n=3) and iCAFs treated with 500 nM JAKi for 4 days (n=3). Color scheme represents Z-score distribution. D. qPCR analysis of Il1a, Il6, Lif, Cxcl1, Csf3, Acta2 and Ctgf in PSCs cultured in Matrigel with control media or tumor organoid-conditioned media in the presence or absence of 500 nM JAKi for the last 24 h following 4 days in culture with conditioned media. Results show mean ± SEM of 5 biological replicates. *P<0.05, **P<0.01, ***P<0.001, paired Student’s t test. E. qPCR analysis of Il1a, Il6, Lif, Cxcl1, Csf3, Acta2 and Ctgf in Rosa26-targeted controls and STAT3 knockout PSCs cultured in Matrigel in transwell with tumor organoids for 4 days. Results show mean ± SEM of 5 biological replicates. *P<0.05, ***P<0.001, paired Student’s t test. F. Western blot analysis of IL-1R1 in myCAFs, quiescent PSCs and iCAFs. Loading control, ACTIN. G. qPCR analysis of Il1r1 in PSCs cultured in Matrigel with tumor organoid-conditioned media in the presence or absence of 500 nM JAKi (left) and in STAT3 knockout PSCs compared to controls (right). Results show mean ± SEM of 4 and 5 biological replicates, respectively. ***P<0.001, paired Student’s t test. H. Representative immunofluorescence co-stains of p-STAT3 (green) and αSMA (red) in KPC tumor sections (n=4). Counterstain, DAPI (blue). Arrows indicate examples of αSMA+ p-STAT3- myCAFs, arrow-heads indicate examples of αSMA- p-STAT3+ cells, asterisks indicate examples of αSMA+ p-STAT3+ cells. Scale bars, 100 μm. I. Quantification of αSMA+ p-STAT3- cells and αSMA+ p-STAT3+ cells in KPC tumor sections. Results show mean ± SEM of 4 biological replicates. ***P<0.001, unpaired Student’s t test.
Figure 5:
Figure 5:. TGF-β signaling antagonizes IL-1-induced JAK/STAT signaling and inhibits the iCAF phenotype.
A. Western blot analysis of SMAD2, p-SMAD2, p-SMAD3, SMAD3, CTGF and αSMA in myCAFs (myC), quiescent PSCs (qP) and iCAFs (iC). Loading control, HSP90α. B. Western blot analysis of the TGF-β signaling effector SMAD4 following nuclear fractionation of quiescent PSCs (qP), iCAFs (iC) and myCAFs (myC). Loading controls, HSP90α (cytoplasmic fractions) and H3 (nuclear fractions). The same amount of protein lysate was loaded in each lane. C. Violin plots showing single cell RNA-sequencing analysis of Ctgf and Col1a1 of a representative KPC tumor (n=2) in myCAFs (blue) and iCAFs (orange). D. Representative immunofluorescence co-stains of p-SMAD2 (green) and αSMA (red) in KPC tumor sections (n=5). Counterstain, DAPI (blue). Arrow-heads indicate examples of αSMA+ p-SMAD2+ cells. Scale bars, 100 μm. E. Quantification of p-SMAD2+ αSMA- cells and p-SMAD2+ αSMA+ cells in KPC tumor sections. Results show mean ± SEM of 5 biological replicates. **P<0.01, paired Student’s t test. F. qPCR analysis of iCAF (Il1a, Il6, Lif, Cxcl1 and Csf3) and myCAF (Acta2 and Ctgf) markers in PSCs cultured in Matrigel with control media or tumor organoid-conditioned media in the presence or absence of 20 ng/mL mouse TGF-β for 4 days. Results show mean ± SEM of 6 biological replicates. **P<0.01, ***P<0.001, paired Student’s t test. G. Western blot analysis of p-JAK1, JAK1, p-JAK2, JAK2, p-STAT1, STAT1, p-STAT3, STAT3, p-SMAD2, CTGF and αSMA in PSCs cultured in Matrigel with control media or tumor organoid-conditioned media (CM) in the presence or absence of 20 ng/mL mouse TGF-β for 4 days. Loading control, ACTIN. H. Proliferation curves of PSCs cultured in Matrigel with control media or tumor organoid-conditioned media in the presence or absence of 20 ng/mL mouse TGF-β. Results show mean ± SD of 5 technical replicates. *P<0.05, **P<0.01, ***P<0.001, unpaired Student’s t test calculated for the last time point. I. qPCR analysis of Il1r1 in PSCs cultured in Matrigel with control media or tumor organoid-conditioned media in the presence or absence of 20 ng/mL mouse TGF-β for 4 days. ***P<0.001, paired Student’s t test. J. Western blot analysis of IL-1R1 in PSCs cultured in Matrigel with control media or tumor organoid-conditioned media in the presence or absence of 20 ng/mL mouse TGF-β for 4 days. Loading control, ACTIN.
Figure 6:
Figure 6:. Inhibition of TGF-β signaling targets myofibroblasts in vivo.
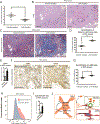
A. Tumor volume analysis based on ultrasound measurements of vehicle- and TGFBR inhibitor (TGFBRi)- treated KPC tumors. Results show mean ± SEM of 5 and 10 tumors, respectively. No statistical difference was found, as calculated by unpaired Student’s t test. B. Representative Hematoxylin and Eosin (H&E) stain of vehicle- and TGFBRi- treated KPC tumor sections (n= 6 and 11, respectively). Scale bar, 200 μm. C. Representative Masson’s trichrome stain of 10-day vehicle- and TGFBRi- treated KPC tumor sections (n= 6 and 11, respectively). Scale bar, 200 μm. D. Quantification of Masson’s trichrome stain in vehicle- and TGFBRi- treated KPC tumors. Results show mean ± SEM of 6 biological replicates. *P<0.05, unpaired Student’s t test. E. Representative immunohistochemistry of αSMA stain of vehicle- and TGFBRi- treated KPC tumor sections (n= 6 and 11, respectively). Scale bar, 200 μm. F. Quantification of αSMA stain in vehicle- and TGFBRi- treated KPC tumors. Results show mean ± SEM of 6 and 11 biological replicates, respectively. *P<0.05, unpaired Student’s t test.
Figure 7:
Figure 7:. JAK inhibition shifts iCAFs to a myofibroblastic phenotype in vivo.
A. Tumor volume analysis based on ultrasound measurements of vehicle- and JAK inhibitor (JAKi)- treated KPC tumors. Results show mean ± SEM of 8 and 7 tumors, respectively. *P<0.05, unpaired Student’s t test. B. Representative Hematoxylin and Eosin (H&E) stain of vehicle- and JAKi- treated KPC tumor sections (n=9 and 7, respectively). Scale bar, 200 μm. C. Representative Masson’s trichrome stain of vehicle- and JAKi- treated KPC tumor sections (n= 9 and 7, respectively). Scale bar, 200 μm. D. Quantification of Masson’s trichrome stain in vehicle- and JAKi- treated KPC tumors. Results show mean ± SEM of 9 and 7 biological replicates, respectiv12`ely. ***P<0.001, unpaired Student’s t test. E. Quantification of CAFs in vehicle- and JAKi- treated KPC tumors, as assessed by flow cytometry. Results show mean ± SEM of 4 biological replicates. *P<0.05, unpaired Student’s t test. F. Representative immunohistochemistry of αSMA stain of vehicle- and JAKi- treated KPC tumor sections (n=7). Scale bar, 200 μm. G. Quantification of αSMA stain in vehicle- and JAKi- treated KPC tumors. Results show mean ± SEM of 7 biological replicates. *P<0.05, unpaired Student’s t test. H. Representative flow cytometric analysis of iCAFs and myCAFs in EdU-treated KPC tumors (n=2). The values shown represent the EdU+ cells in each CAF population. I. Quantification of Ly6C- myCAF/Ly6C+ iCAF ratio in vehicle- and JAKi- treated KPC tumors, as assessed by flow cytometry. Results show mean ± SEM of 3 biological replicates. *P<0.05, unpaired Student’s t test. J. Model explaining the pathway antagonism that determines iCAF and myCAF formation in PDAC. (1) Tumor-secreted TGF-β activates TGF-β signaling in adjacent myCAFs, preventing induction of the iCAF phenotype by suppressing IL-1R1 expression. (2) Conversely, tumor-secreted IL-1 activates IL-1 signaling in CAFs that are located farther away from tumor glands. (3) In these CAFs, IL-1 signaling induces a cytokine cascade that leads to JAK/STAT signaling activation through NF-κB signaling and autocrine LIF. (4) The activated JAK/STAT pathway establishes a positive feedback loop by upregulating IL-1R1 expression.

Comment in

Similar articles

Cited by

References

    1. Siegel RL, Miller KD, Jemal A. Cancer statistics, 2016. CA Cancer J Clin 2016;66(1):7–30 doi 10.3322/caac.21332. - DOI - PubMed
    1. Jacobetz MA, Chan DS, Neesse A, Bapiro TE, Cook N, Frese KK, et al. Hyaluronan impairs vascular function and drug delivery in a mouse model of pancreatic cancer. Gut 2013;62(1):112–20 doi 10.1136/gutjnl-2012-302529. - DOI - PMC - PubMed
    1. Olive KP, Jacobetz MA, Davidson CJ, Gopinathan A, McIntyre D, Honess D, et al. Inhibition of Hedgehog signaling enhances delivery of chemotherapy in a mouse model of pancreatic cancer. Science 2009;324(5933):1457–61 doi 10.1126/science.1171362. - DOI - PMC - PubMed
    1. Provenzano PP, Cuevas C, Chang AE, Goel VK, Von Hoff DD, Hingorani SR. Enzymatic targeting of the stroma ablates physical barriers to treatment of pancreatic ductal adenocarcinoma. Cancer Cell 2012;21(3):418–29 doi 10.1016/j.ccr.2012.01.007. - DOI - PMC - PubMed
    1. Diop-Frimpong B, Chauhan VP, Krane S, Boucher Y, Jain RK. Losartan inhibits collagen I synthesis and improves the distribution and efficacy of nanotherapeutics in tumors. Proc Natl Acad Sci U S A 2011;108(7):2909–14 doi 10.1073/pnas.1018892108. - DOI - PMC - PubMed

Publication types

MeSH terms