. 2018 Oct 26;9(1):4456.
doi: 10.1038/s41467-018-06893-9.

Collagen prolyl 4-hydroxylase 1 is essential for HIF-1α stabilization and TNBC chemoresistance

Affiliations

Collagen prolyl 4-hydroxylase 1 is essential for HIF-1α stabilization and TNBC chemoresistance

Gaofeng Xiong et al. Nat Commun. .

Abstract

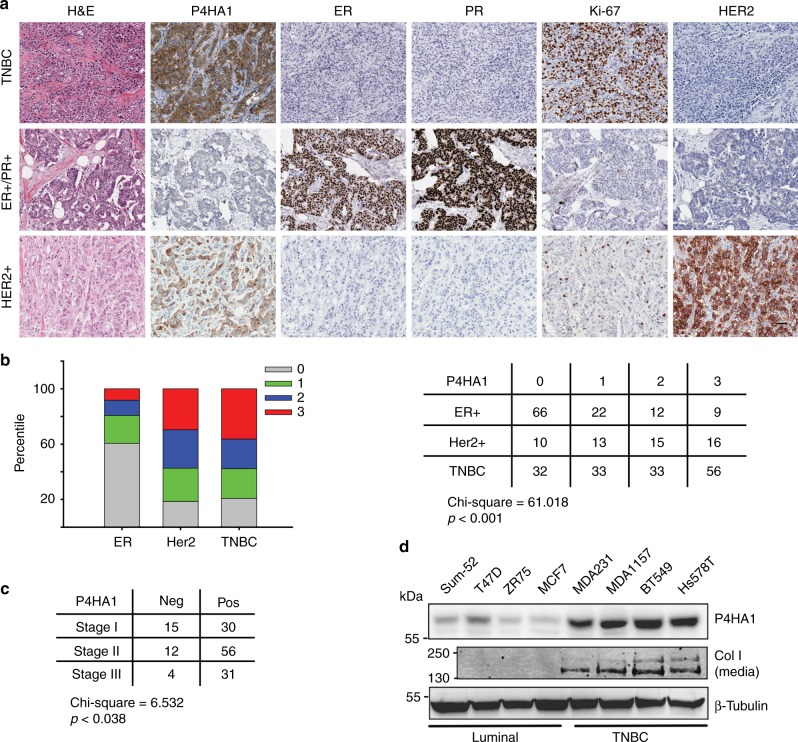
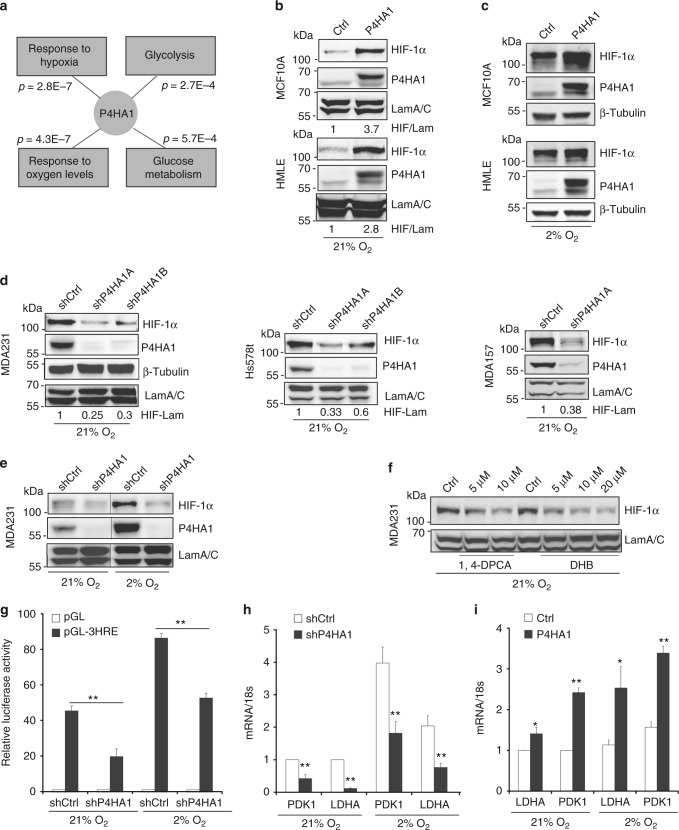
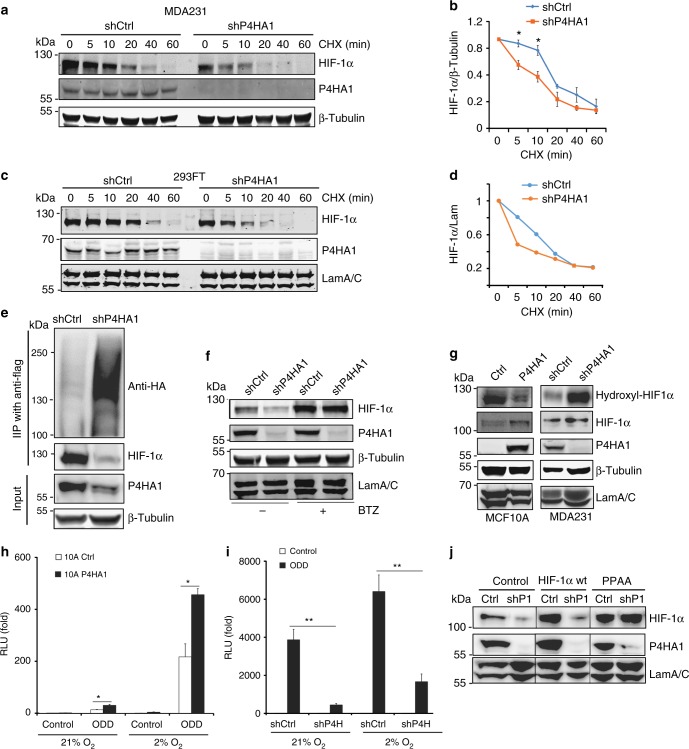
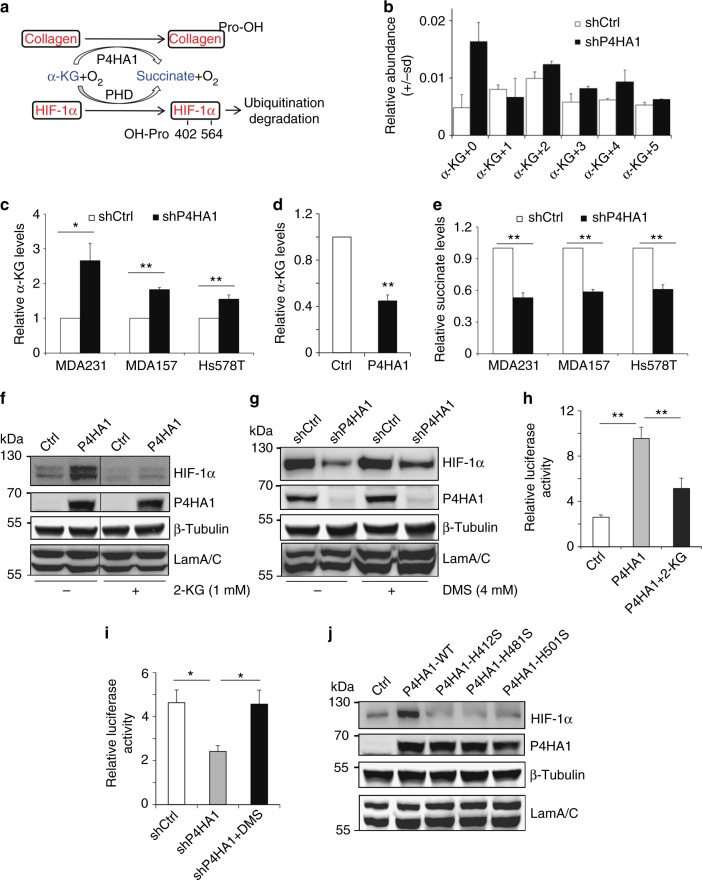
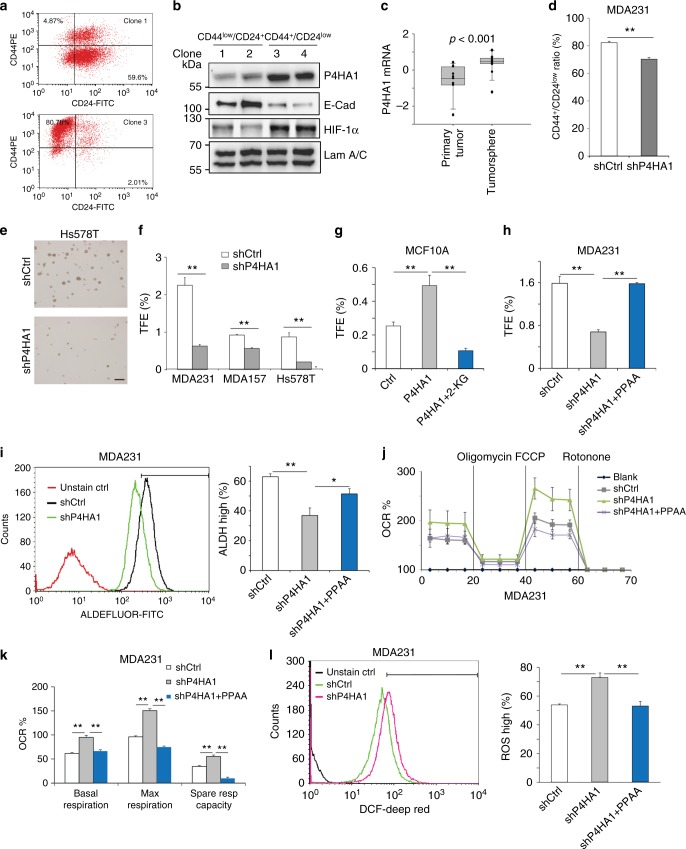
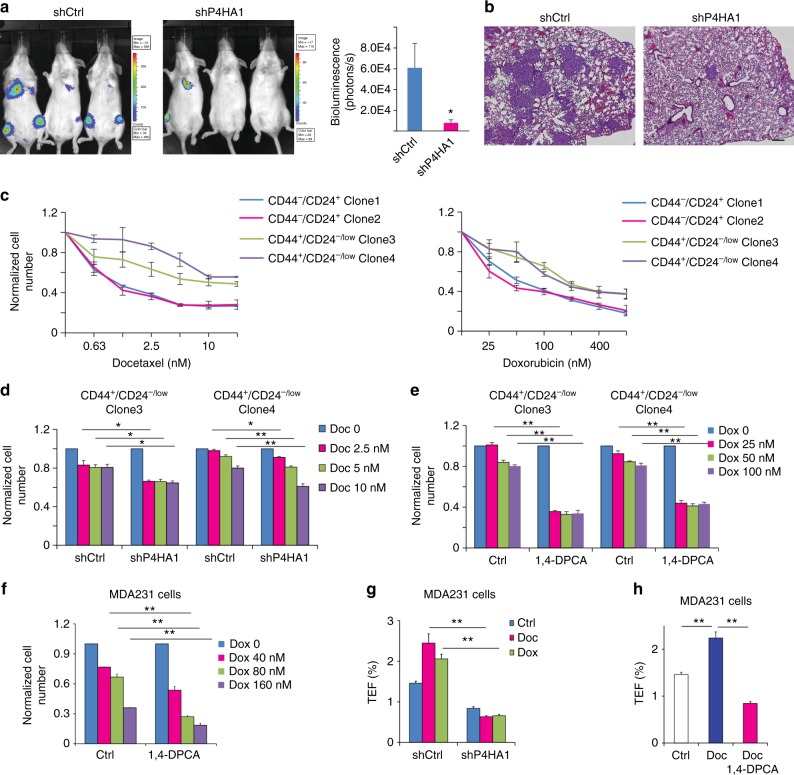
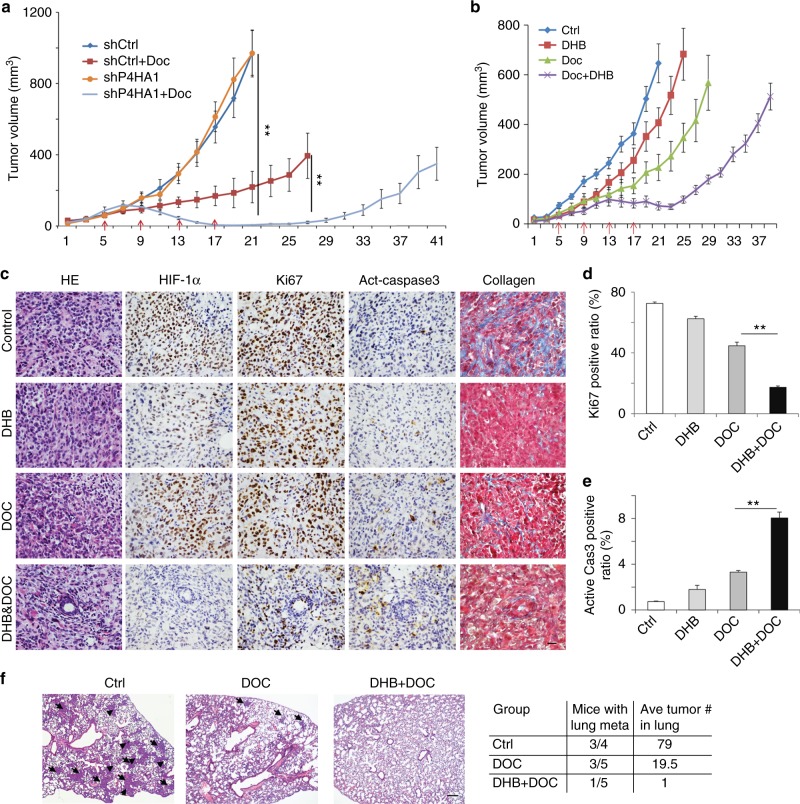
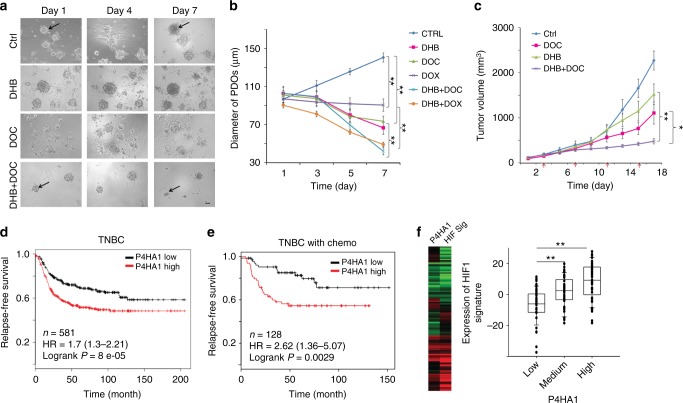
Collagen prolyl 4-hydroxylase (P4H) expression and collagen hydroxylation in cancer cells are necessary for breast cancer progression. Here, we show that P4H alpha 1 subunit (P4HA1) protein expression is induced in triple-negative breast cancer (TNBC) and HER2 positive breast cancer. By modulating alpha ketoglutarate (α-KG) and succinate levels P4HA1 expression reduces proline hydroxylation on hypoxia-inducible factor (HIF) 1α, enhancing its stability in cancer cells. Activation of the P4HA/HIF-1 axis enhances cancer cell stemness, accompanied by decreased oxidative phosphorylation and reactive oxygen species (ROS) levels. Inhibition of P4HA1 sensitizes TNBC to the chemotherapeutic agent docetaxel and doxorubicin in xenografts and patient-derived models. We also show that increased P4HA1 expression correlates with short relapse-free survival in TNBC patients who received chemotherapy. These results suggest that P4HA1 promotes chemoresistance by modulating HIF-1-dependent cancer cell stemness. Targeting collagen P4H is a promising strategy to inhibit tumor progression and sensitize TNBC to chemotherapeutic agents.


Conflict of interest statement

The authors declare no competing interests.

Figures

Fig. 1
Fig. 1
P4HA1 protein levels are significantly increased in TNBC. a Human breast cancer tissue array was stained by H&E and immunohistochemistry for ER, PR, P4HA1, Ki-67, and HER2. Bar: 40 µm. b, c Quantification of P4HA1 staining from a. The data were analyzed by χ2 test. d P4HA1 protein levels and collagen secretion were assessed in a panel of breast cancer cell lines
Fig. 2
Fig. 2
P4HA1 induces the HIF-1 pathway in breast cancer cells. a Gene co-expression and gene ontology analyses of the gene signature associated with P4HA1 expression in human breast cancer tissue. b, c Western blot analyses of HIF-1α expression in P4HA1-expressing MCF10A and HMLE cell lines under normoxia and hypoxia conditions. d, e HIF-1α protein levels were assessed in control and P4HA1-silenced TNBC cell lines under normoxia and hypoxia conditions. f HIF-1α protein levels in MDA-MB-231 cells after P4HA inhibitor 1,4-DPCA or ethyl-3,4-dihydroxybenzoic acid (DHB) treatment. g HRE reporter analysis of the HIF-1 activity in control and P4HA1-silenced 293FT cells under normoxia and hypoxia conditions. Results are presented as mean ± SEM; n = 3; **p < 0.01, one-way ANOVA test. h, i Quantitative RT-PCR measuring mRNA levels of HIF-1 target genes lactate dehydrogenase A (LDHA) and pyruvate dehydrogenase kinase 1 (PDK1) in control, P4HA1-silenced MDA-MB-231 cells, and P4HA1-expressing MCF10A cells under normoxia and hypoxia conditions. Results are presented as mean ± SEM; n = 4; *p < 0.05, **p < 0.01, independent Student’s t test
Fig. 3
Fig. 3
P4HA1 enhances HIF-1α protein stability. a, b Analysis of HIF-1α protein degradation in control and shP4HA1-expressing MDA-MB-231 cells with cycloheximide (CHX, 100 μM) treatment (0, 5, 10, 20, 40, and 60 min). Results are presented as mean ± SEM. n = 3; *p < 0.05, independent Student’s t test. c, d Analysis of HIF-1α protein degradation in control and shP4HA1-transfected 293FT cells with cycloheximide (CHX, 100 μM) treatment (0, 5, 10, 20, 40, and 60 min). e Immunoprecipitation and western blot analysis of HIF-1α ubiquitination in 293FT cells transfected with HIF-1α-Flag and UB-HA construct, plus shCtrl or shP4HA1 plasmids. f Western blot assessing HIF-1α protein levels in control and P4HA1-silenced MDA-MB-231 cells treated with proteasome inhibitor Bortezomib (BTZ) for 12 h. g Analysis of hydroxylated HIF-1α (P402) levels in control and P4HA1-silenced MDA-MB-231 cells, control or P4HA1-expressing MCF10A cells. h, i ODD-luciferase reporter activity in control, P4HA1-expressing MCF10A cells, and P4HA1-silenced MDA-MB-231 cells under normoxia and hypoxia conditions. Results are presented as mean ± SEM; n = 3; **p < 0.01, *p < 0.05, one-way ANOVA test. j HIF-1α protein levels were assessed in control and P4HA1-silenced MDA-MB-231 cells with wild-type HIF-1α or proline hydroxylation-deficient HIF-1α PPAA overexpression.
Fig. 4
Fig. 4
P4HA1 enhances HIF-1α stability by modulating α-KG l and succinate levels. a Scheme showing that HIF-1α hydroxylation is regulated by oxygen tension and metabolites (α-KG and succinate). bd Cytoplasmic α-KG levels were measured in control, P4HA1-silenced MDA-MB-231, and P4HA1-expressing cells. Results are presented as mean ± SEM; n = 3; *p < 0.05, **p < 0.01, independent Student’s t test. e Cytoplasmic succinate levels were measured in control and P4HA1-silenced MDA-MB-231 cells. Results are presented as mean ± SEM; n = 3; **p < 0.01, independent Student’s t test. f, g HIF-1α protein levels were assessed in control, P4HA1-expressing MCF10A, and P4HA1-silenced cells in the presence or absence of octyl-α-ketoglutarate (1 mM) or dimethyl-succinate (4 mM). h, i ODD-luciferase reporter activity was measured in control, P4HA1-silenced, and P4HA1-expressing cells in the presence or absence of octyl-α-ketoglutarate (1 mM) or dimethyl-succinate (4 mM); n = 3, results are presented as mean ± SEM. *n = 3; p < 0.05, one-way ANOVA test. j HIF-1α protein levels were assessed in control, wild-type P4HA1-expressing MCF10A cells, and hydroxylation-deficient P4HA1 mutant-expressing MCF10A cells
Fig. 5
Fig. 5
P4HA regulates cancer cell stemness through the HIF-1 pathway. a, b Expression of HIF-1α, P4HA1, and E-cadherin was assessed in CD44low/CD24+ clones and CD44+/CD24–/low clones. c Quantification of mRNA levels of P4HA1 in primary breast cancer tissue and tumor spheroids derived from those tissues. The gene expression values were derived from published microarray dataset. The data were log 2 transformed and mean centered. Primary tumor, n = 11; tumorsphere, n = 15. The median, 10th, 25th, 75th, and 90th percentiles were plotted as vertical boxes with error bars. The data were analyzed by Mann–Whitney rank-sum test. d FACS analysis of CD44+/CD24–/low population in shCtrl and shP4HA1 MDA-MB-231 cells. Results are presented as mean ± SEM; n = 3; **p < 0.01, independent Student’s t test. e, f Images of tumorspheres and quantification of tumorsphere formation efficiency (TFE) in control or P4HA1-silenced MDA-MB-231 cells, Hs578t cells, and MDA-MB-157 cells. Results are presented as mean ± SEM; n = 3; **p < 0.01, independent Student’s t test. g, h Quantification of tumorsphere formation efficiency (TFE) in control, P4HA1-expressing, and P4HA1-silenced cells in the presence or absence of octyl-α-ketoglutarate or HIF-1α PPAA. Results are presented as mean ± SEM; n = 3, **p < 0.01, one-way ANOVA test. i FACS analysis of aldehyde dehydrogenase (ALDH) activity in control, P4HA1-silenced MDA-MB-231 cells, and P4HA1-silenced MDA-MB-231 cells with HIF-1α PPAA. Results are presented as mean ± SEM; n = 3; *p < 0.05; **p < 0.01, one-way ANOVA test. j Seahorse analysis of oxygen consumption rate (OCR) in control, P4HA1-silenced MDA-MB-231 cells, and P4HA1-silenced MDA-MB-231 cells with HIF-1α PPAA. k Quantification of OCR from j; n = 30; results are presented as mean ± SEM; **p < 0.01, one-way ANOVA test. l FACS quantification of ROS levels in control or P4HA1-silenced MDA-MB-231 cells in the presence or absence of HIF-1α PPAA; n = 3, results are presented as mean ± SEM; **p < 0.01, one-way ANOVA test
Fig. 6
Fig. 6
Inhibition of P4HA1 enhances cell response to chemotherapeutic agents. a, b Colonization of control and P4HA1-silenced MDA-MB-231 cells in the distance organs were assessed by bioluminescence signals and IHC analysis. Bar: 80 µm. Results are presented as mean ± SEM; n = 6; *p < 0.05. ce Quantification of cell number in CD44+/CD24–/low HMLE clones and CD44low/CD24+ HMLE clones after doxorubicin and docetaxel treatment in the presence or absence of P4HA inhibitor (1,4-DPCA) or shP4HA1. Results are presented as mean ± SEM; n = 3 in c; n = 4 in d, e; *p < 0.05; **p < 0.01, one-way ANOVA test. f Quantification of cell number in control and P4HA1-silenced MDA-MB-231 cells after doxorubicin treatment. Results are presented as mean ± SEM; n = 3; **p < 0.01, one-way ANOVA test. g, h Quantification of tumorsphere formation efficiency (TFE) in control or P4HA1-silenced MDA-MB-231 cells. The cells were treated with doxorubicin, docetaxel, and/or the 1,4-DPCA before the tumorsphere formation assay for 4 days. Results are presented as mean ± SEM; n = 3; **p < 0.01, one-way ANOVA test
Fig. 7
Fig. 7
Inhibition of P4HA1 sensitizes TNBC to docetaxel in vivo. a Tumor growth curve of control and P4HA1-silenced MDA-MB-231 cells implanted mice treated with docetaxel. Results are presented as mean ± SEM; n = 10; **p < 0.01. The data were analyzed by one-way ANOVA test. b Tumor growth curve of MDA-MB-231 cells implanted mice treated with P4H inhibitor DHB (40 mg/kg) and/or Doc (docetaxel) (10 mg/kg). The DHB treatment started from day 1 to day 21 in the tumor growth curve. Results are presented as mean ± SEM; n = 8. c HE images, IHC staining images (HIF-1α, Ki-67, active-caspase-3), and Masson’s trichrome staining images of tumor sections from mice treated with DHB and/or Doc. Bar: 20 µm. d, e Quantification of cell proliferation and apoptosis in tumor sections from mice treated with DHB and/or Doc; n = 4; **p < 0.01, one-way ANOVA test. f Representative HE images and quantification data of lung metastasis in mice treated with DHB and/or Doc. Bar: 80 µm
Fig. 8
Fig. 8
P4HA1 expression is associated with chemoresistance and activation of the HIF-1 gene signature. a, b Growth of patient-derived tumor organoids (PDOs) in the 3D laminin-rich ECM gel was assessed after docetaxel (DOC), doxorubicin (DOX), and/or P4HA inhibitor (DHB) treatment; results are presented as mean ± SEM. n = 89; **p < 0.01, one-way ANOVA test. Bar, 40 µm. c Tumor growth curve of PDX treated with DHB (40 mg/kg) and/or DOC (10 mg/kg); n = 5; **p < 0.01; *p < 0.05, one-way ANOVA test. d The association of P4HA1 expression with recurrence-free survival was assessed by analyzing the mRNA levels in basal-like/TNBC tissues, n = 580, Kaplan–Meier survival analysis. e The association of P4HA1 expression with recurrence-free survival was assessed by analyzing the mRNA levels in basal-like/TNBC tissues from patient received adjuvant and neoadjuvant chemotherapy, n = 128, Kaplan–Meier survival analysis. f Heatmap and Box plot showed the association of P4HA1 levels and expression of the HIF-1 gene signature in human breast cancer tissue. The median, 10th, 25th, 75th, and 90th percentiles were plotted as vertical boxes with error bars, n = 39, **p < 0.01, one-way ANOVA test

Comment in

References

    1. Ramshaw JA, Shah NK, Brodsky B. Gly-X-Y tripeptide frequencies in collagen: a context for host–guest triple-helical peptides. J. Struct. Biol. 1998;122:86–91. doi: 10.1006/jsbi.1998.3977. - DOI - PubMed
    1. Gorres KL, Raines RT. Prolyl 4-hydroxylase. Crit. Rev. Biochem. Mol. Biol. 2010;45:106–124. doi: 10.3109/10409231003627991. - DOI - PMC - PubMed
    1. Jaakkola P, et al. Targeting of HIF-alpha to the von Hippel-Lindau ubiquitylation complex by O2-regulated prolyl hydroxylation. Science. 2001;292:468–472. doi: 10.1126/science.1059796. - DOI - PubMed
    1. Annunen P, Autio-Harmainen H, Kivirikko KI. The novel type II prolyl 4-hydroxylase is the main enzyme form in chondrocytes and capillary endothelial cells, whereas the type I enzyme predominates in most cells. J. Biol. Chem. 1998;273:5989–5992. doi: 10.1074/jbc.273.11.5989. - DOI - PubMed
    1. Lu P, Weaver VM, Werb Z. The extracellular matrix: a dynamic niche in cancer progression. J. Cell Biol. 2012;196:395–406. doi: 10.1083/jcb.201102147. - DOI - PMC - PubMed

Publication types

MeSH terms