. 2018 Oct 26;9(1):4463.
doi: 10.1038/s41467-018-07003-5.

Sexual rejection via a vomeronasal receptor-triggered limbic circuit

Affiliations

Sexual rejection via a vomeronasal receptor-triggered limbic circuit

Takuya Osakada et al. Nat Commun. .

Abstract

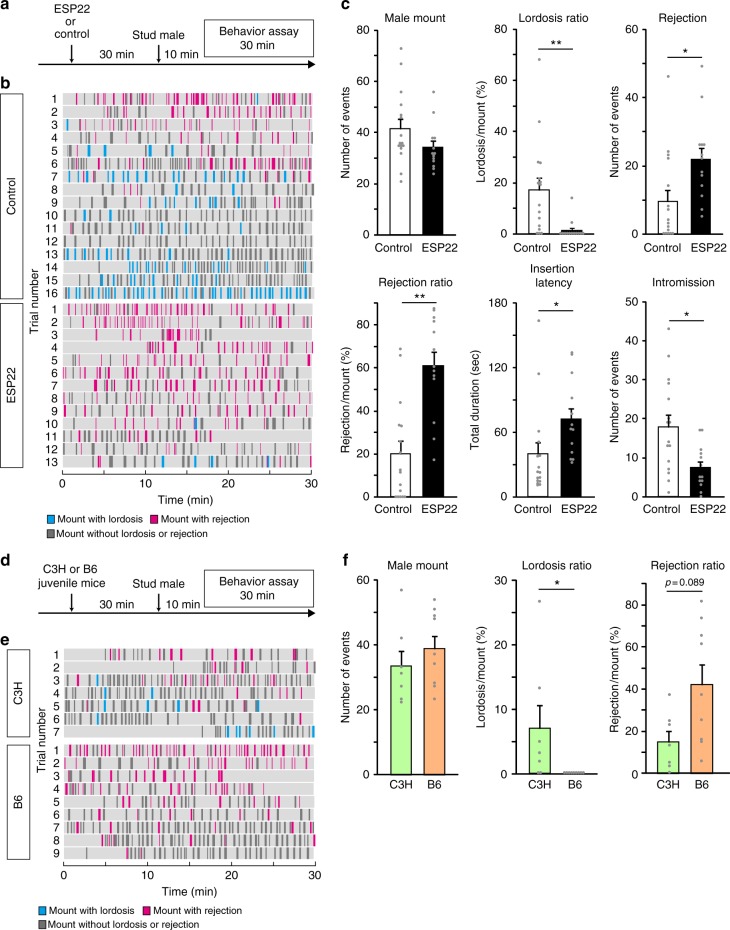
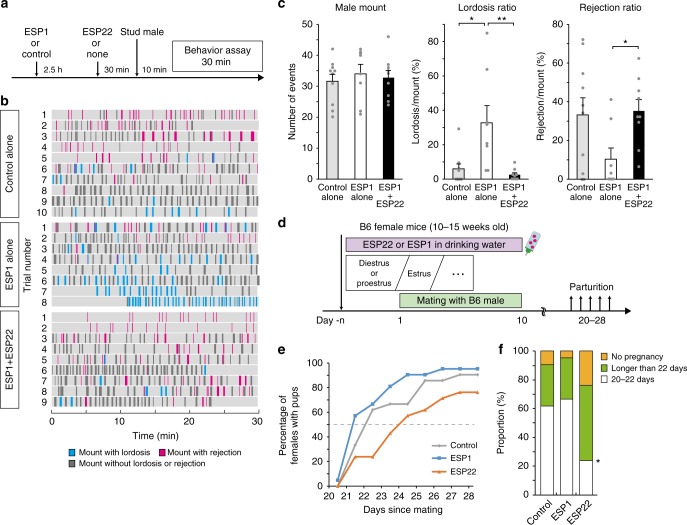
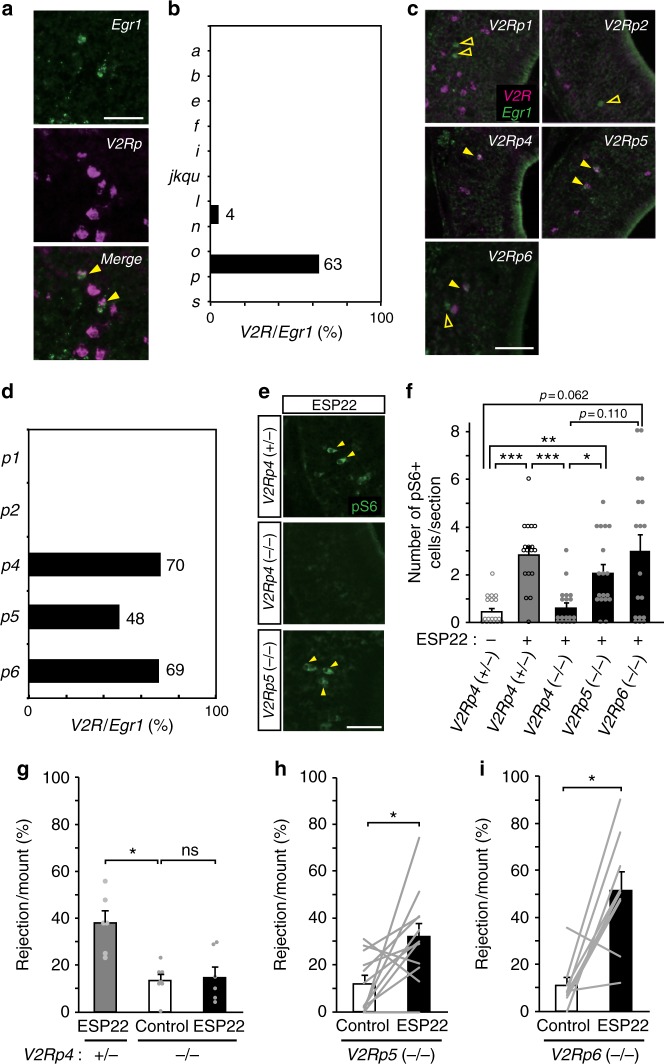
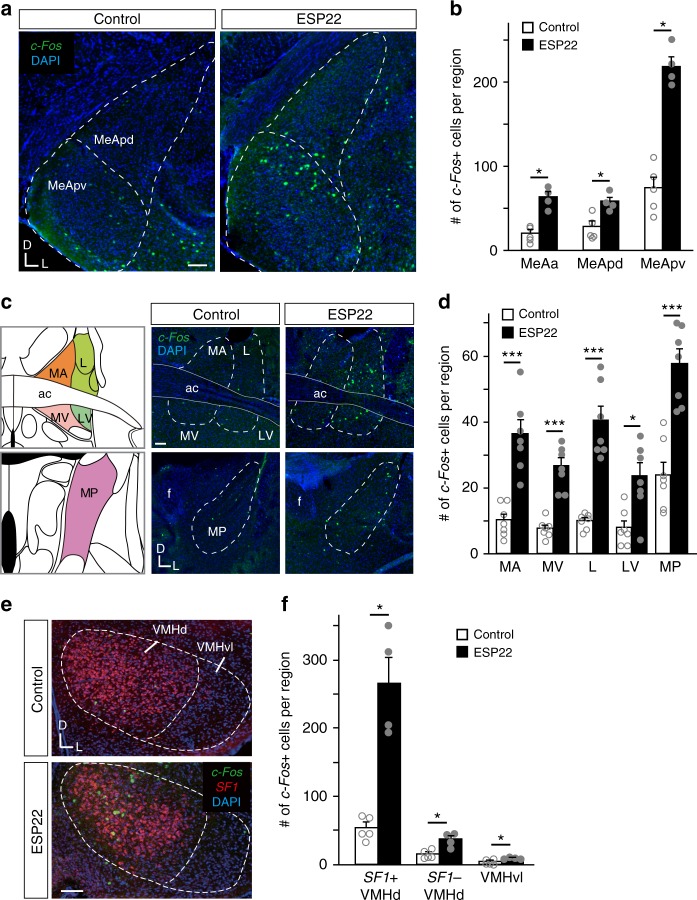
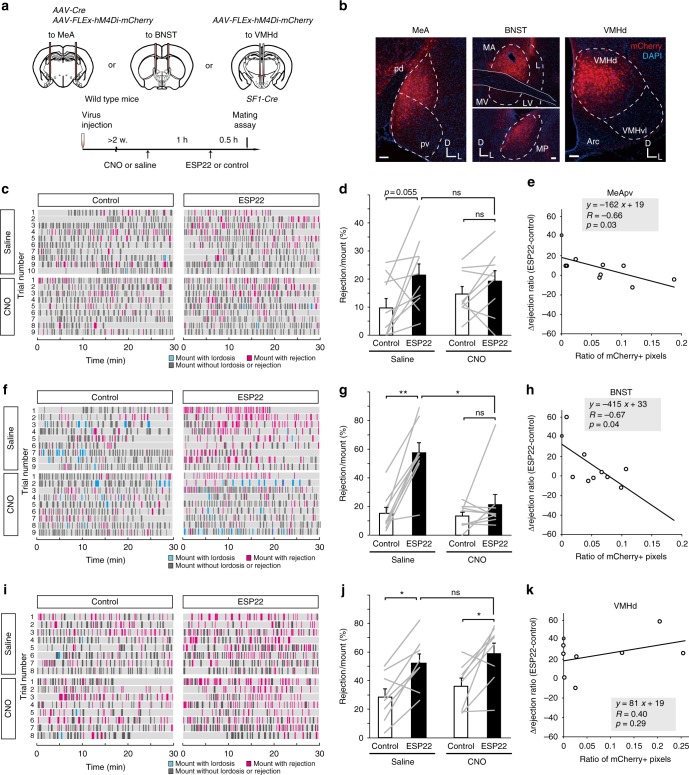
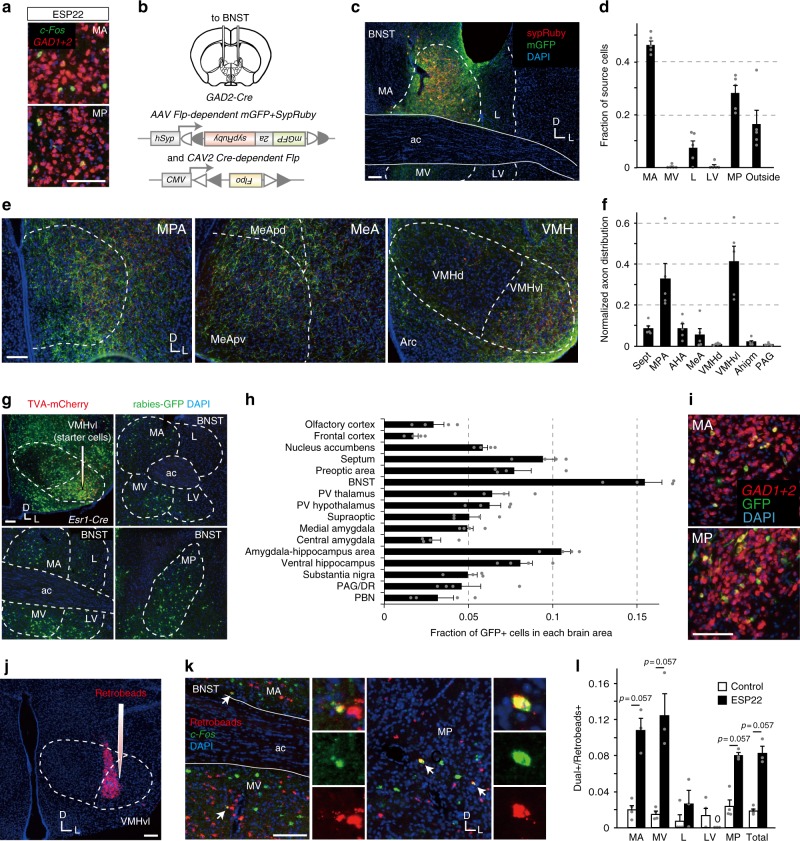
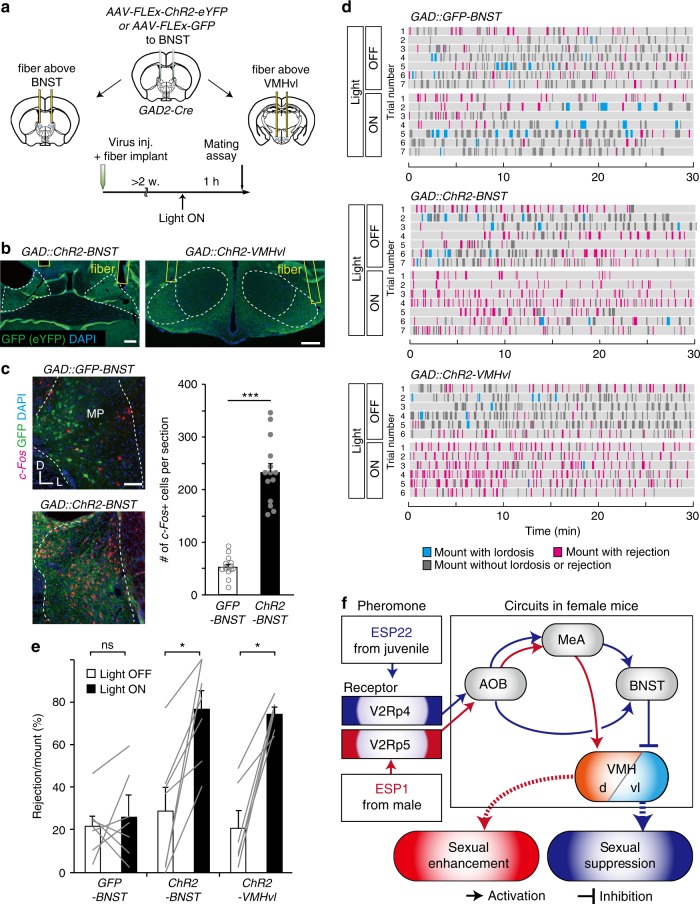
Mating drive is balanced by a need to safeguard resources for offspring, yet the neural basis for negative regulation of mating remains poorly understood. In rodents, pheromones critically regulate sexual behavior. Here, we observe suppression of adult female sexual behavior in mice by exocrine gland-secreting peptide 22 (ESP22), a lacrimal protein from juvenile mice. ESP22 activates a dedicated vomeronasal receptor, V2Rp4, and V2Rp4 knockout eliminates ESP22 effects on sexual behavior. Genetic tracing of ESP22-responsive neural circuits reveals a critical limbic system connection that inhibits reproductive behavior. Furthermore, V2Rp4 counteracts a highly related vomeronasal receptor, V2Rp5, that detects the male sex pheromone ESP1. Interestingly, V2Rp4 and V2Rp5 are encoded by adjacent genes, yet couple to distinct circuits and mediate opposing effects on female sexual behavior. Collectively, our study reveals molecular and neural mechanisms underlying pheromone-mediated sexual rejection, and more generally, how inputs are routed through olfactory circuits to evoke specific behaviors.


Conflict of interest statement

The authors declare no competing interests.

Figures

Fig. 1
Fig. 1
ESP22 suppresses sexual receptivity of virgin female mice. a Timeline for sexual behavior assays using adult female mice pre-exposed to either ESP22 or control buffer. b Raster plot representing mounting episodes made by the male mouse, with cyan and magenta bars representing attempts associated with lordosis or rejection responses, respectively, by C57BL/6J female mice. Mounting attempts without lordosis or rejection are represented with grey bars. Control buffer-exposed female mice, n = 16; ESP22-exposed female mice, n = 13. c Quantification of the sexual behaviors of control buffer- and ESP22-exposed female mice. Each dot represents data of an individual female mouse. d Timeline for the sexual behavior assays using C57BL/6J adult female mice pre-exposed to either C3H/HeJ (C3H, ESP22-) or C57BL/6J (B6, ESP22+) juvenile mice. e, f Raster plots and quantification are the same as detailed in b, c. C3H juvenile-exposed female mice, n = 7; B6 juvenile-exposed female mice, n = 9. Error bars, S.E.M. **p < 0.01 and *p < 0.05 by Wilcoxon rank sum test with Holm correction
Fig. 2
Fig. 2
ESP22 counteracts ESP1-mediated sexual facilitation and elicits reproductive suppression. a Timeline for female sexual behavior assays. b Raster plots as detailed in Fig. 1b. Control, n = 10; ESP1, n = 8; ESP1 + ESP22, n = 9. c Quantification of the number of mounts made by males, lordosis ratio, and rejection ratio, with each gray dot representing data for an individual animal. Error bars, S.E.M. **p < 0.01 and *p < 0.05 by Steel-Dwass test. d Schematic setup and timeline for the reproduction assay. ESP22 or ESP1 was continuously supplied in the drinking water. Female mice at the beginning of estrus were mated for 10 days, with parturition events monitored daily. e A cumulative plot showing the percentage of females with pups (y-axis) with respect to the days since mating (x-axis). f The proportion of females in each parturition day category since mating. *p < 0.05 by relative risk analysis compared with control (female mice in each group, n = 21)
Fig. 3
Fig. 3
V2Rp4 is a functional receptor for ESP22. a Dual-color ISH staining of a VNO section from an ESP22-stimulated female mouse labeled with the Egr1 cRNA probe (green) and V2Rp clade-specific cRNA probe (magenta). Closed arrowheads show double-labeled cells. Scale bar, 50 µm. b Percentage of V2R-positive VSNs among ESP22-induced Egr1-expressing neurons. c Dual-color ISH staining with Egr1 (green) and each V2Rp cRNA probe (magenta). Open arrowheads show Egr1-positive cells; closed arrowheads show double-labeled cells. Scale bar, 50 µm. d Percentage of V2Rp-positive VSNs among the ESP22-induced Egr1-expressing cells. e Representative immunohistochemical images of pS6-expressing VSNs in ESP22-stimulated V2Rp4+/, V2Rp4−/−, or V2Rp5−/− mice. Arrowheads represent example pS6-positive VSNs. Scale bar, 50 µm. f The number of pS6-positive cells per VNO section. For each genotype, 18 sections from each of 3 animals were quantified. ***p < 0.001, **p < 0.01, and *p < 0.05 by Steel-Dwass test. gi Quantification of the rejection ratio using V2R mutant female mice pre-exposed to either control buffer or ESP22. The genotype of the female mice is shown at the bottom of each graph. Gray lines and dots indicate data from an individual animal. Error bars, S.E.M. ns, not significant. *p < 0.05 by Kruskal-Wallis test with Bonferroni correction in g or Wilcoxon signed rank test in h, i
Fig. 4
Fig. 4
ESP22-induced c-Fos expression in the amygdala-hypothalamus axis of female mice. a Representative ISH sections of the MeA from female mice stimulated with control buffer or ESP22. c-Fos cRNA probe (green) was used in conjunction with nuclear DAPI staining (blue). Abbreviations: MeApd, MeA posterodorsal part; MeApv, MeA posteroventral part; D, dorsal; and V, ventral. Scale bar, 100 µm. b Quantification of c-Fos-positive neurons in the MeA. The number of sections counted to determine the number of c-Fos-positive neurons in each brain area of each animal were: MeAa, 4; MeApd, 12; and MeApv, 12. Error bars, S.E.M. n= 45. MeAa, MeA anterior part. c Representative ISH sections of the BNST, as detailed in a. MA, medial division anterior part; L, lateral division; MV, medial division ventral part; LV, lateral division ventral part; MP, medial division posterior part; f, fornix; and ac, anterior commissure. Scale bar, 100 µm. Image adapted from the Allen Mouse Brain Atlas (©2004 Allen Institute for Brain Science. Allen Mouse Brain Atlas. Available from: mouse.brain-map.org). d Quantification of c-Fos-positive neurons in the BNST. Ten sections were counted for each BNST area per animal. n = 7. e Representative ISH sections of the VMH from female mice stimulated with control buffer or ESP22. SF1 cRNA probe (red) and c-Fos cRNA probe (green) were used in conjunction with nuclear DAPI staining (blue). Abbreviations: VMHd, VMH dorsal part; VMHvl, VMH ventrolateral part; D, dorsal; and L, lateral. f Quantification of c-Fos-expressing neurons in the VMH. n = 4–7; 16 sections from each animal were quantified. Error bars, S.E.M. ***p < 0.001 and *p < 0.05 by Wilcoxon rank sum test
Fig. 5
Fig. 5
MeA and BNST neurons are necessary for female sexual suppression by ESP22. a Schematic illustration of the setup and timeline for loss-of-function experiments that targeted the MeA, BNST, and VMHd. Image adapted from the Allen Mouse Brain Atlas (©2004 Allen Institute for Brain Science. Allen Mouse Brain Atlas. Available from: mouse.brain-map.org). b Representative images of mCherry expression in the MeA, BNST, and VMHd of female mice. For abbreviations, see Fig. 4 legend. Scale bar, 100 µm. c, f, i Raster plots of loss-of-function experiments that targeted the MeA (c), BNST (f), and VMH (i) as detailed in Fig. 1b. Each animal in either the saline or CNO groups underwent two behavioral assays: one with control buffer exposure and one with ESP22 exposure. Animals that received hM4Di injection as follows: MeA (c), n = 10 for saline, n = 9 for CNO. BNST (f), n = 9 for each group. VMH (i), n = 8 for each group. d, g, j Quantification of the rejection ratio of female mice pre-exposed to control buffer or ESP22 in MeA (d), BNST (g), and VMH (j) groups. Error bars, S.E.M. ns, not significant. **p < 0.01 and *p < 0.05 by Wilcoxon signed rank test with Bonferroni correction. e, h, k Correlation between the ratio of mCherry-positive pixels (x-axis) in the MeApv (e), BNST (h), and VMHd (k) and the Δrejection ratio (y-axis). Open circles represent data from the hM4Di-injected CNO group, and grey circles on the y-axis represent averaged data from wild type mice (no-manipulation) to serve as a reference
Fig. 6
Fig. 6
BNST GABAergic projection neurons to VMHvl are activated by ESP22. a Representative ISH sections of the BNST from female mice stimulated with ESP22 and stained with c-Fos (green) and GAD1 + 2 cRNA probes (red). b Schematic illustration of the setup for axon mapping of BNST GABAergic neurons. Image adapted from the Allen Mouse Brain Atlas (©2004 Allen Institute for Brain Science. Allen Mouse Brain Atlas. Available from: mouse.brain-map.org). c Representative BNST images showing the distribution of source cells (green). d Fraction of the source cells among the five subdivisions of the BNST and surrounding structures. e Representative coronal sections of the MPA, MeA, and VMH showing axons of GABAergic neurons in the BNST (green) and their putative pre-synaptic structures (red). f Proportion of axonal arborization of the BNST GABAergic neurons among the eight brain regions. n = 5. Abbreviations: Sept, lateral septum; AHA, anterior hypothalamus; AHipm, amygdalohippocampal area posteromedial part; and PAG, periaqueductal gray. g Representative sections of the VMH and BNST from female mice after rabies virus-mediated trans-synaptic tracing. h Fraction of GFP+ cells in each brain area normalized by the total number of GFP+ cells in all 16 brain regions. n = 4. Abbreviations: PV, paraventricular; DR, dorsal raphe nucleus; and PBN, parabrachial nucleus. For other abbreviations, see Fig. 4. i BNST coronal sections labeled with GFP (green) and GAD1+2 (red) ISH probes. j A representative coronal VMH section showing the injection site of red Retrobeads. k Representative examples of BNST ISH sections, including the MA, MV, and MP, with ESP22-induced c-Fos-positive (green) and red Retrobeads-positive (red) neurons labeled from the VMHvl. Arrows indicate double-positive cells, which are shown in high magnification in the merged and separated channels on the right. l Ratio of double-positive neurons to red Retrobeads-positive neurons in the five BNST subdivisions and total BNST (n = 4 for control buffer, and n = 3 for ESP22). Data from individual animals are represented with gray dots. Error bars, S.E.M. Statistical analysis by Wilcoxon rank sum test. Scale bar, 100 µm. D, dorsal; L, lateral
Fig. 7
Fig. 7
Optogenetic activation of axons from GAD2-positive BNST neurons in the VMHvl elicited sexual rejection. a Schematic illustration of the setup and timeline for gain-of-function experiments that targeted GAD2-positive BNST neurons by optogenetic activation of their cell bodies in the BNST or their axons in the VMHvl. Image adapted from the Allen Mouse Brain Atlas (©2004 Allen Institute for Brain Science. Allen Mouse Brain Atlas. Available from: mouse.brain-map.org). b Representative coronal section showing location of fiber tip in the BNST (left) or VMHvl (right). Scale bar, 200 µm. c Representative ISH sections showing c-Fos-positive cells (red) induced by photoactivation and GFP-positive (ChR2-YFP expression) cells (green) in the BNST of GAD2::ChR2-BNST or GAD2::GFP-BNST animals. Quantification of the number of c-Fos-positive cells per section is shown in the graphs. ***p < 0.001 by Wilcoxon rank sum test. Scale bar, 100 µm. d Raster plots as detailed in Fig. 1b for female mice expressing ChR2 in BNST GABAergic neurons that received photoactivation in the BNST (GAD2::ChR2-BNST, n = 7) or VMHvl (GAD2::ChR2-VMHvl, n = 6), as well as for control female mice expressing GFP in BNST GABAergic neurons that received photoactivation in the BNST (GAD2::GFP-BNST, n = 7). e Quantification of the rejection ratio for optogenetic experiments. Error bars, S.E.M. ns, not significant. *p < 0.05 by Wilcoxon signed rank test. f Model of neural pathways responsible for ESP22-mediated sexual suppression of female mice (blue lines) and ESP1-mediated enhancement of sexual receptivity (red lines)

Similar articles

Cited by

References

    1. Clutton-Brock TH, Huchard E. Social competition and selection in males and females. Philos. Trans. R. Soc. B. 2013;368:20130074. doi: 10.1098/rstb.2013.0074. - DOI - PMC - PubMed
    1. Wasser S, Barash D. Reproductive suppression among female mammals: implications for biomedicine and sexual selection theory. Q. Rev. Biol. 1983;58:513–538. doi: 10.1086/413545. - DOI - PubMed
    1. Petrulis A. Chemosignals and hormones in the neural control of mammalian sexual behavior. Front. Neuroendocrinol. 2013;34:255–267. doi: 10.1016/j.yfrne.2013.07.007. - DOI - PubMed
    1. Beehner JC, Lu A. Reproductive suppression in female primates: a review. Evol. Anthropol. 2013;22:226–238. doi: 10.1002/evan.21369. - DOI - PubMed
    1. Li Q, et al. Synchronous evolution of an odor biosynthesis pathway and behavioral response. Curr. Biol. 2013;23:11–20. doi: 10.1016/j.cub.2012.10.047. - DOI - PMC - PubMed

Publication types

MeSH terms