Comparative Study
. 2018 Oct 26;9(1):4472.
doi: 10.1038/s41467-018-06962-z.

Determinants of promoter and enhancer transcription directionality in metazoans

Affiliations
Comparative Study

Determinants of promoter and enhancer transcription directionality in metazoans

Mahmoud M Ibrahim et al. Nat Commun. .

Abstract

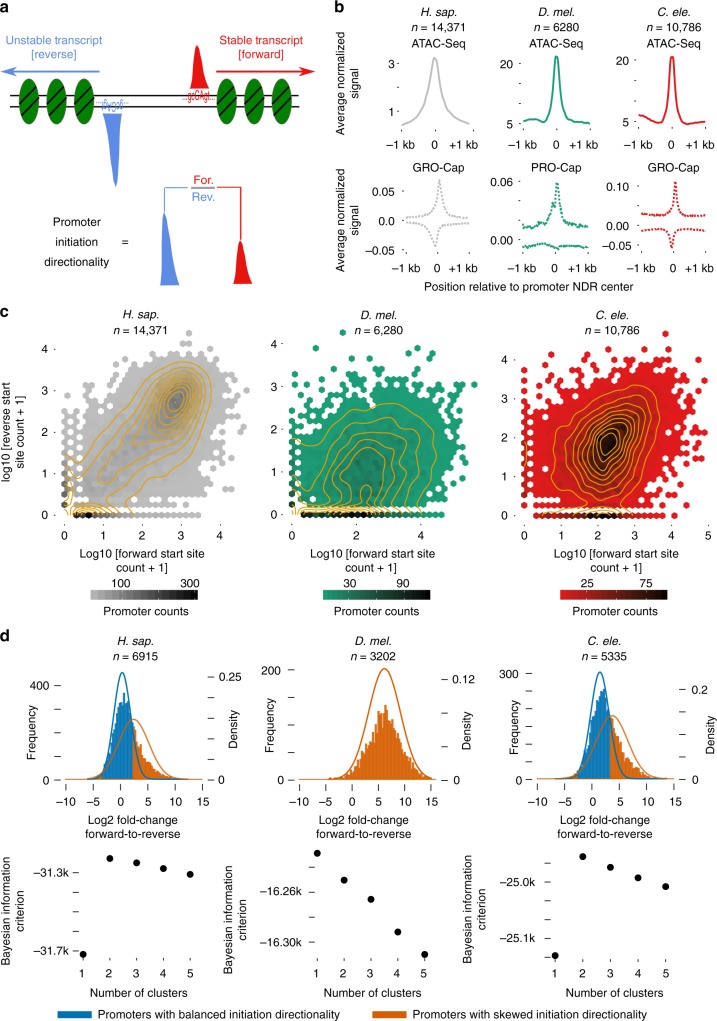
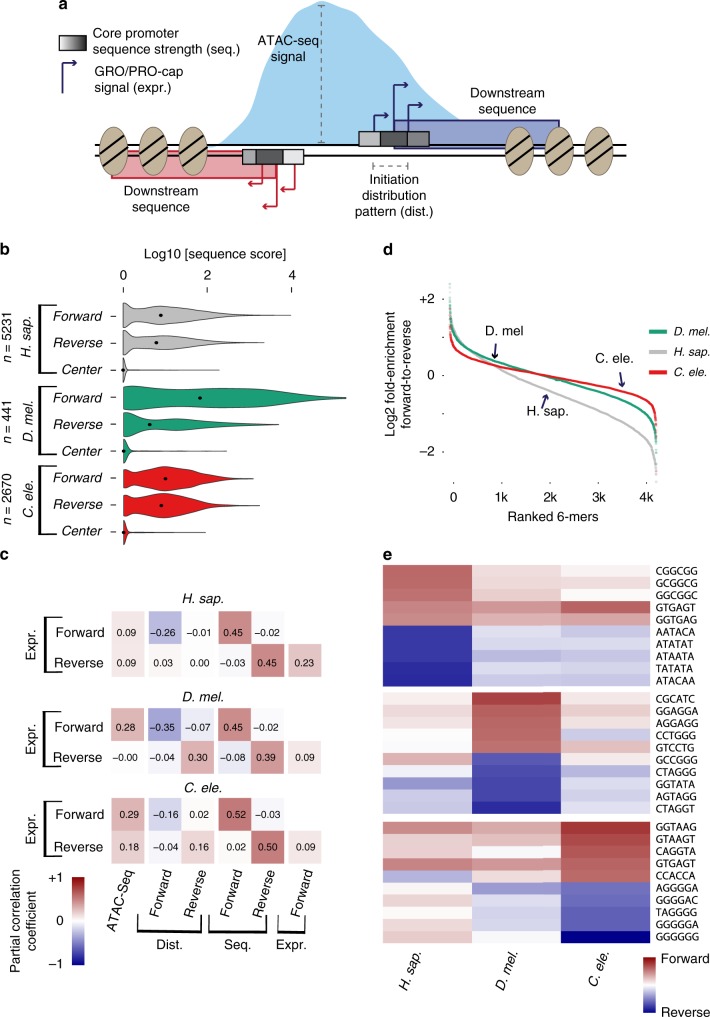
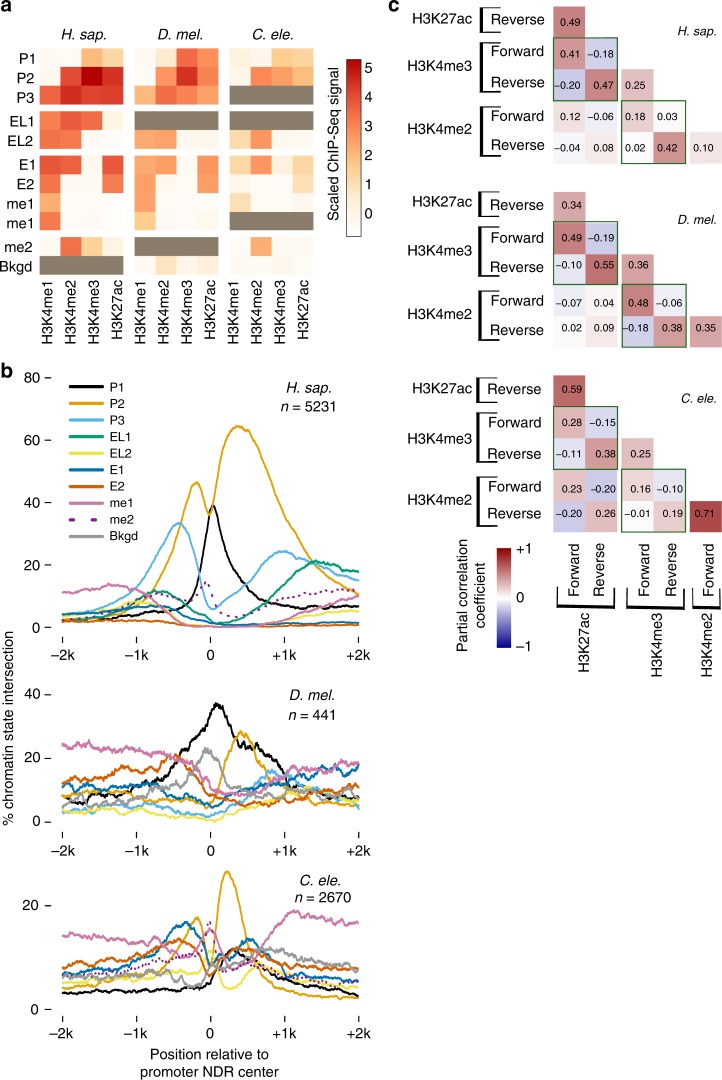
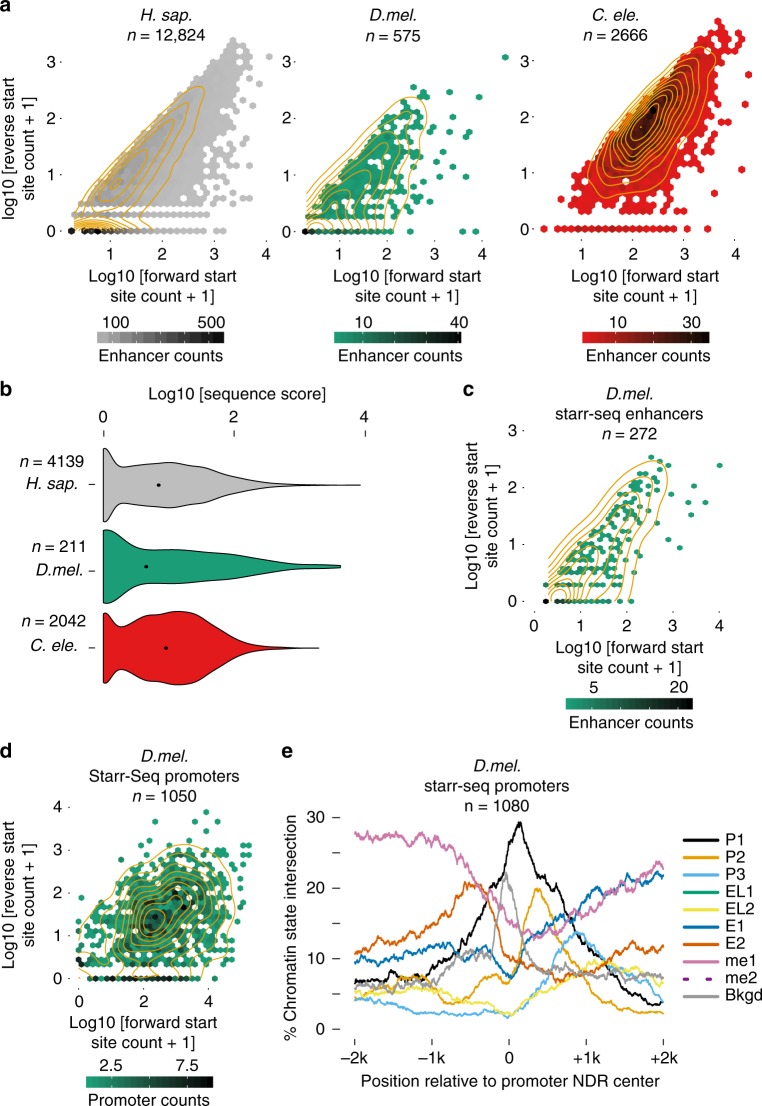
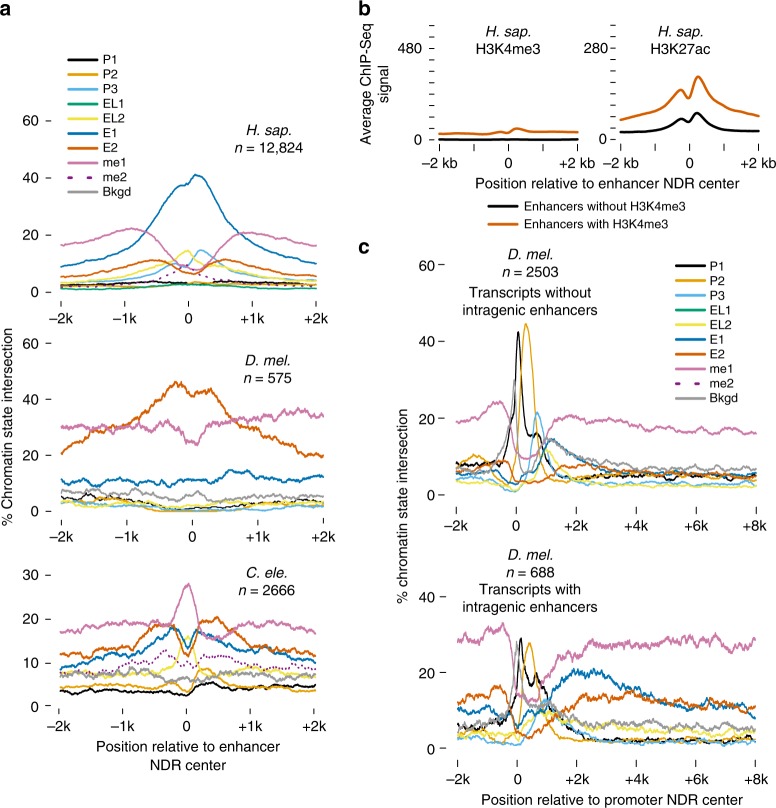
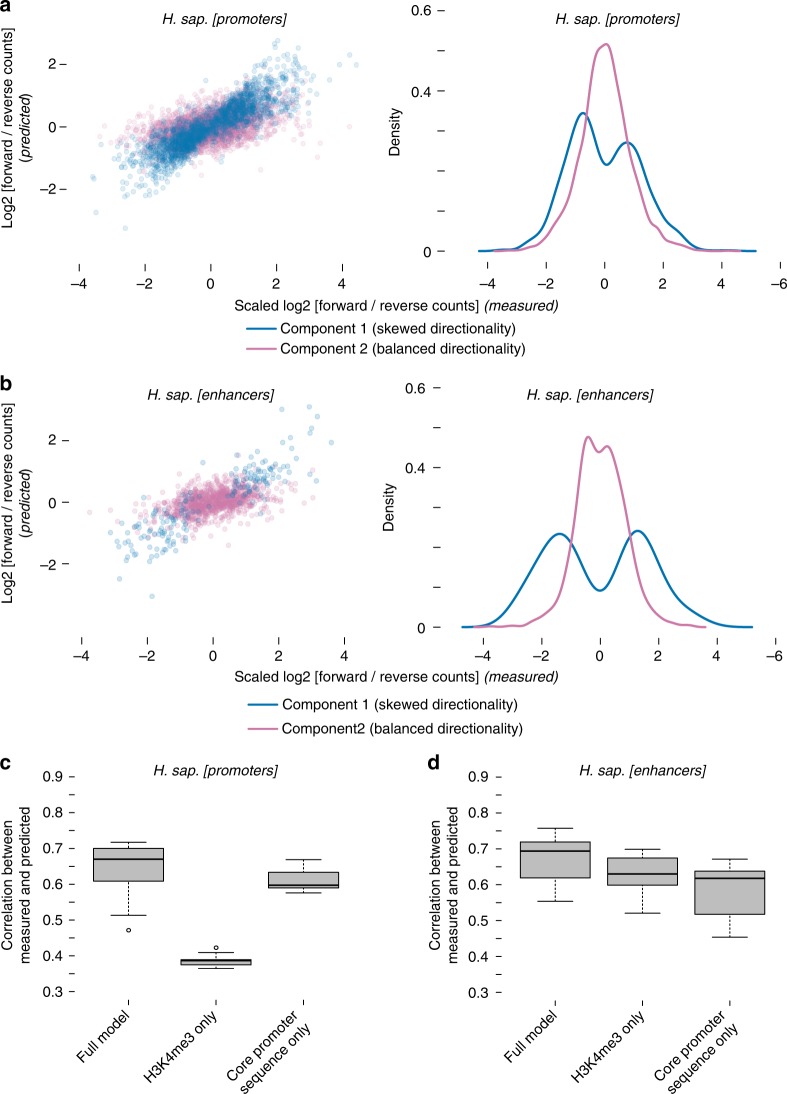
Divergent transcription from promoters and enhancers is pervasive in many species, but it remains unclear if it is a general feature of all eukaryotic cis regulatory elements. To address this, here we define cis regulatory elements in C. elegans, D. melanogaster and H. sapiens and investigate the determinants of their transcription directionality. In all three species, we find that divergent transcription is initiated from two separate core promoter sequences and promoter regions display competition between histone modifications on the + 1 and -1 nucleosomes. In contrast, promoter directionality, sequence composition surrounding promoters, and positional enrichment of chromatin states, are different across species. Integrative models of H3K4me3 levels and core promoter sequence are highly predictive of promoter and enhancer directionality and support two directional classes, skewed and balanced. The relative importance of features to these models are clearly distinct for promoters and enhancers. Differences in regulatory architecture within and between metazoans are therefore abundant, arguing against a unified eukaryotic model.


Conflict of interest statement

The authors declare no competing interests.

Figures

Fig. 1
Fig. 1
Variation of promoter initiation directionality. a Schematic of divergent transcription initiation from promoter regions. b Average depth-normalized ATAC-seq (solid line) coverage and zero-to-one-scaled PRO/GRO-cap (dotted line) coverage relative to promoter NDR midpoints as defined by ATAC-seq. c Forward direction (annotated gene) vs. reverse direction PRO/GRO-cap counts displayed as contour and hexbin scatter plots for the same promoter NDRs as b. d Mixture model (top) and Bayesian Information Criterion analysis of cluster numbers (bottom) for forward/reverse PRO/GRO-cap count ratios for promoter NDRs containing significant forward initiation. A pseudo count of 1 was added to numerators and denominators. Lines represent density of theoretical Gaussian distributions learned from the data, histograms represent observed ratios
Fig. 2
Fig. 2
Asymmetric sequence features contribute to variation of transcription directionality. a Schematic of features measured for stringently selected divergent promoters. b Core promoter sequence model scores at significant forward and reverse TSS modes for promoter NDRs in all three species (see Methods). Center positions between forward and reverse TSSs serve as negative controls. Black dots represent median values. c Partial-correlation analysis between total PRO/GRO-cap counts (Expr.), ATAC-seq signal, TSS distribution entropy (Dist.) and core promoter sequence score sums (Seq.) in forward and reverse directions for promoter NDRs with significant forward and reverse TSSs (see Supplementary Table 1 for full partial-correlation table). d All 6-mer sequences from 500 bp windows downstream of forward and reverse TSSs for stringently selected divergent promoter NDRs. Sequences are ranked by, and plotted against, their forward-reverse count ratios. e Top-5 (red) or bottom-5 (blue) 6-mers (see d) from each species with their respective scaled forward/reverse count ratios in the other species
Fig. 3
Fig. 3
Promoter histone PTM states are direction-specific. a A heatmap representing chromatin states learned for each species via a multivariate Gaussian Hidden Markov Model. Each state is a multivariate Gaussian distribution and is represented here via the mean scaled ChIP-Seq signal. Gray boxes indicate the state was not detected in the respective organism. P1/2/3: Promoter1/2/3, EL1/2: Transcription elongation1/2, E1/2: Enhancer1/2, me1: H3K4me1, me2: H3K4me2, Bkgd: Background. b Chromatin state positional coverage for promoters with stringently selected forward and reverse TSSs. c Partial-correlation analysis between promoter histone PTMs ChIP-Seq signal in forward and reverse directions for the same promoter NDRs (see Supplementary Table 2 for full partial-correlation table)
Fig. 4
Fig. 4
Genuine transcription initiation from distal enhancers. a Contour/hexbin scatter plots of forward vs. reverse direction PRO/GRO-cap counts for ATAC-seq-defined intergenic NDRs, which intersected at least H3K4me1 and H3K27ac in H. sapiens GM12878 (left), D. melanogaster S2 cells (middle) and whole L3 C. elegans (right). Forward and reverse are the strands with higher and lower counts, respectively. b Core promoter sequence model scores at enhancers with significant forward and/or reverse TSS modes (see Methods). Forward and reverse TSSs are plotted together. Numbers indicated in the figure refer to the number of enhancer regions. Total TSSs measured are 5588 (H. sap.), 267 (D. mel.), and 3062 (C. ele.). Black dots represent median values. c Forward vs. reverse direction PRO-cap counts for intergenic NDRs that intersect STARR-seq peaks and have at least one count on one strand. d Forward vs. reverse direction PRO-cap counts for promoter NDRs that intersect STARR-seq enhancer peaks and have at least one count on one strand. e Chromatin state coverage plots for promoter NDRs that intersect STARR-seq enhancer peaks
Fig. 5
Fig. 5
Variation of enhancer chromatin architecture across species. a Chromatin state (see Fig. 3a) positional coverage for enhancer NDRs (intergenic NDRs that intersect at least H3K4me1 and H3K27ac). b Average normalized ChIP-Seq signal for H3K4me3 (left) and H3K27ac (right) at human enhancer regions that either intersect or do not intersect H3K4me3 (n = 6537 and n = 6287, respectively). c Chromatin state positional coverage for expressed promoters whose transcripts are either without (top) or with (bottom) intragenic NDRs that intersect STARR-seq peaks
Fig. 6
Fig. 6
H3K4me3 and core promoter sequence are predictive of initiation directionality. Predicted vs. measured transcription directionality in H. sapiens a promoter and b enhancer regions showing significant forward and reverse initiation levels (n = 5231 and n = 1189, respectively) using a mixture linear model (left). Density plots of a promoter and b enhancer counts for different directionality groups predicted by the model (right). Models were trained on all promoter (a) and all enhancer (b) regions. Skewed (blue) and balanced (pink) directionality model components are displayed separately. c Tenfold cross-validation of three models including a model trained using core promoter sequence score ratios and H3K4me3 signal ratios, a model trained using core promoter sequence score ratios only and one trained using H3K4me3 ratios only. Boxplots show the correlation between predicted and measured transcription directionality for the test sets. Center line is the median, box represents the 25th and 75th percentiles and whiskers extend further by 1.58 times the interquartile distance divided by the square root of the number of data points. d Same as c but for enhancers

Similar articles

Cited by

References

    1. Core L, Waterfall J, Lis J. Nascent RNA sequencing reveals widespread pausing and divergent initiation at human promoters. Science. 2008;322:1845–1848. doi: 10.1126/science.1162228. - DOI - PMC - PubMed
    1. Seila AC, et al. Divergent transcription from active promoters. Science. 2008;322:1849–1851. doi: 10.1126/science.1162253. - DOI - PMC - PubMed
    1. Preker P, et al. RNA exosome depletion reveals transcription upstream of active human promoters. Science. 2008;322:1851–1854. doi: 10.1126/science.1164096. - DOI - PubMed
    1. Kruesi WS, Core LJ, Waters CT, Lis JT, Meyer BJ. Condensin controls recruitment of RNA polymerase II to achieve nematode X-chromosome dosage compensation. eLife. 2013;2:e00808. doi: 10.7554/eLife.00808. - DOI - PMC - PubMed
    1. Neil H, et al. Widespread bidirectional promoters are the major source of cryptic transcripts in yeast. Nature. 2009;457:1038–1042. doi: 10.1038/nature07747. - DOI - PubMed

Publication types