. 2018 Oct 26;9(11):1097.
doi: 10.1038/s41419-018-1061-4.

Antioxidants prevent inflammation and preserve the optic projection and visual function in experimental neurotrauma

Affiliations

Antioxidants prevent inflammation and preserve the optic projection and visual function in experimental neurotrauma

Alexandra Bernardo-Colón et al. Cell Death Dis. .

Abstract

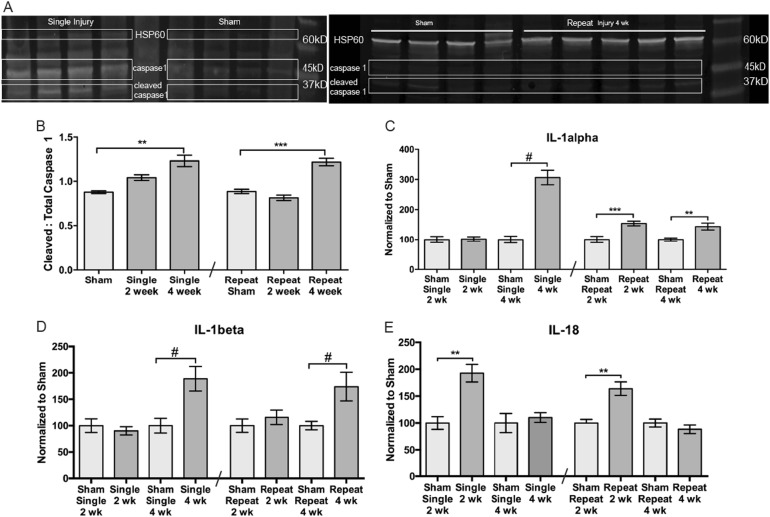
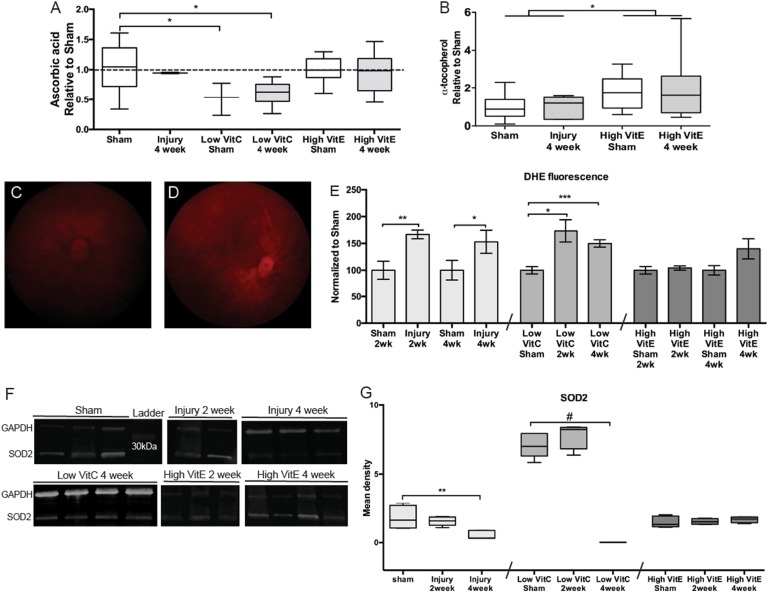
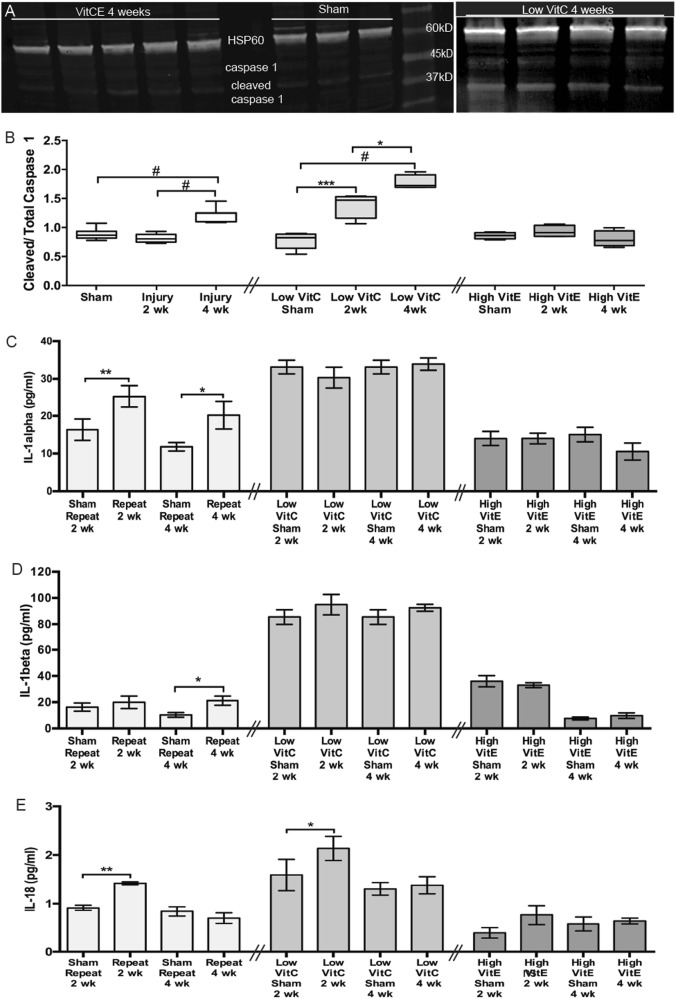
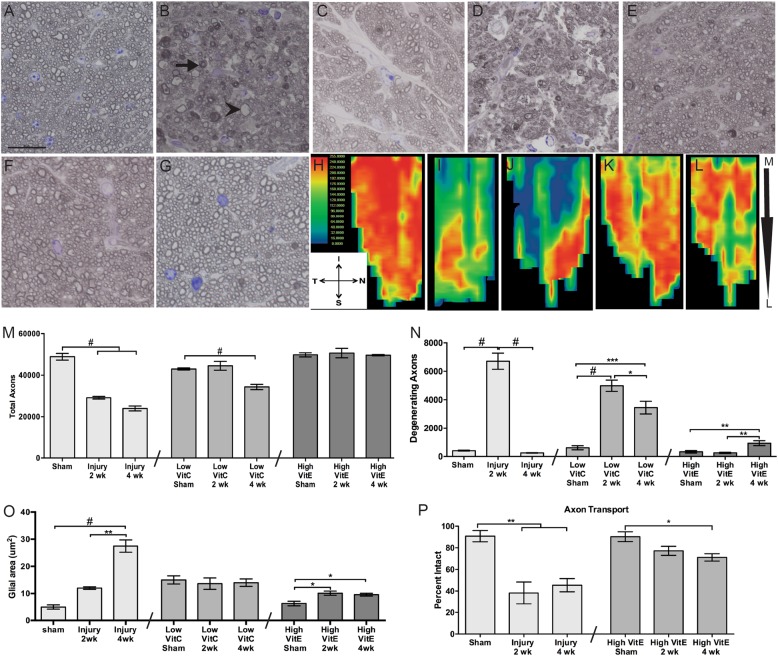
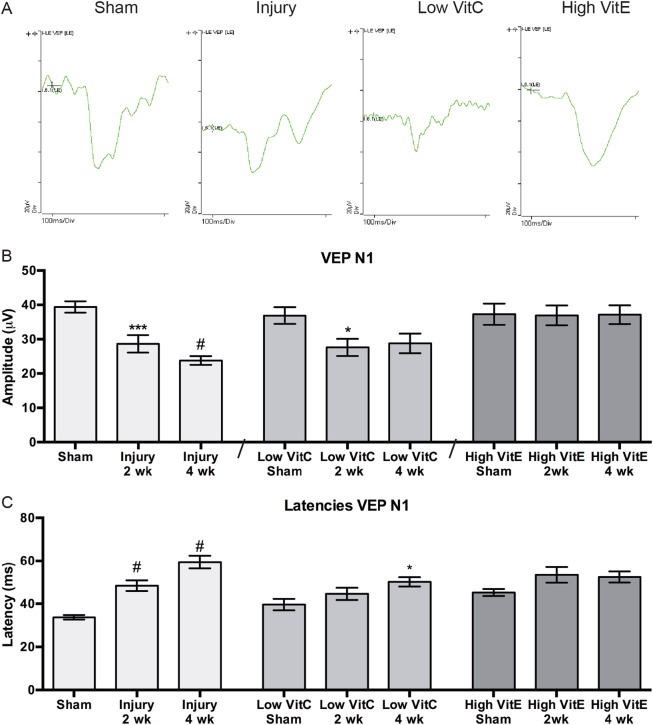
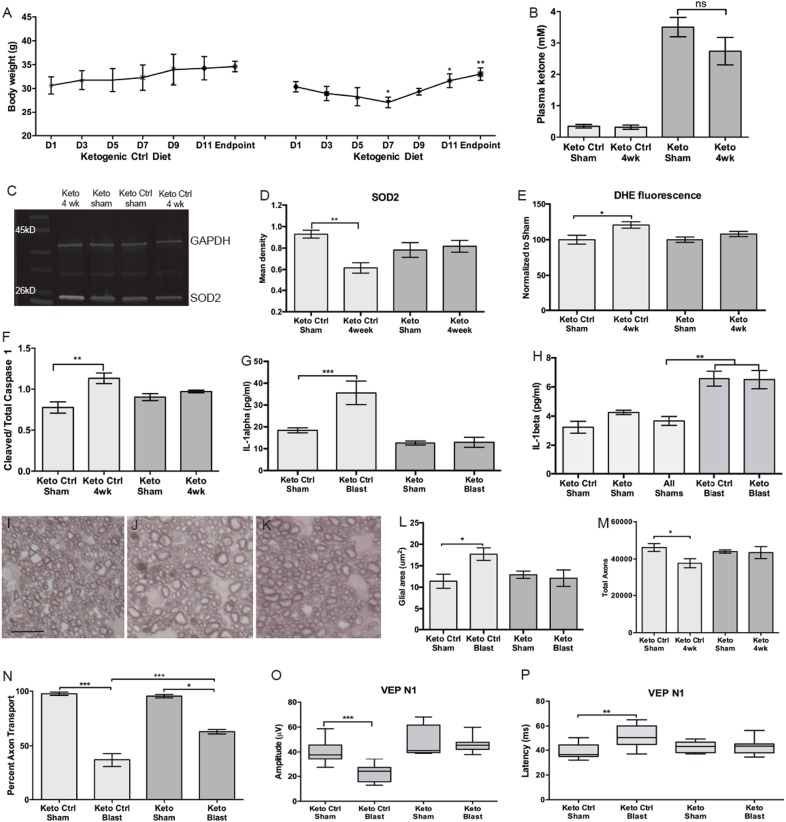
We investigated the role of oxidative stress and the inflammasome in trauma-induced axon degeneration and vision loss using a mouse model. The left eyes of male mice were exposed to over-pressure air waves. Wild-type C57Bl/6 mice were fed normal, high-vitamin-E (VitE), ketogenic or ketogenic-control diets. Mice lacking the ability to produce vitamin C (VitC) were maintained on a low-VitC diet. Visual evoked potentials (VEPs) and retinal superoxide levels were measured in vivo. Tissue was collected for biochemical and histological analysis. Injury increased retinal superoxide, decreased SOD2, and increased cleaved caspase-1, IL-1α, IL-1β, and IL-18 levels. Low-VitC exacerbated the changes and the high-VitE diet mitigated them, suggesting that oxidative stress led to the increase in IL-1α and activation of the inflammasome. The injury caused loss of nearly 50% of optic nerve axons at 2 weeks and astrocyte hypertrophy in mice on normal diet, both of which were prevented by the high-VitE diet. The VEP amplitude was decreased after injury in both control-diet and low-VitC mice, but not in the high-VitE-diet mice. The ketogenic diet also prevented the increase in superoxide levels and IL-1α, but had no effect on IL-1β. Despite this, the ketogenic diet preserved optic nerve axons, prevented astrocyte hypertrophy, and preserved the VEP amplitude. These data suggest that oxidative stress induces priming and activation of the inflammasome pathway after neurotrauma of the visual system. Further, blocking the activation of the inflammasome pathway may be an effective post-injury intervention.


Conflict of interest statement

The authors declare that they have no conflict of interest.

Figures

Fig. 1
Fig. 1. The inflammasome pathway is activated in the retina after single or repeat blast injury to the eye.
a Western blot of caspase-1 in sham, single injury, and repeat injury mice at 4 weeks after injury. b Quantification of cleaved to total caspase-1 showing an increase at 4 weeks in both single and repeat injury groups. c Quantification of IL-1α after single or repeat blast. IL-1α is increased at 4 weeks after a single blast and at both 2 and 4 weeks after a repeat blast. d Quantification of IL-1β after single or repeat blast showing an increase at 4 weeks after either injury. e Quantification of IL-18 after single or repeat blast showing a transient increase at 2 weeks after injury for both groups. This experiment was repeated twice. n = 5 for all groups. **p < 0.01, ***p < 0.001, #p < 0.0001
Fig. 2
Fig. 2. Diets alter tissue levels of VitC, VitE, and superoxide after blast.
a Quantification of retina ascorbic acid (VitC) levels. Retinas of Gulo-/- mice provided a low-VitC content diet had less ascorbic acid, *p < 0.05. Retinas of wild-type mice fed a high-VitE diet contained normal levels of ascorbic acid. b Quantification of retina α-tocopherol (VitE) levels. Retinas of wild-type mice fed a high-VitE diet contained higher levels of α-tocopherol. c, d Representative images of DHE fluorescence (superoxide levels) in the retinas of sham (c) and repeat blast-exposed (d) mice. e Quantification of retina DHE fluorescence in normal, low-VitC, and high-VitE-diet mice. Levels are increased in the 2 and 4 weeks after blast injury in both the control and low-VitC mice, but not in the high-VitE mice. f Western blots of SOD2 levels in retinas from sham, and 2- or 4-week post-blast mice on control, low-VitC, or high-VitE diets. g Quantification of SOD2 levels. SOD2 levels are decreased at 4 weeks after injury in both normal-diet and low-VitC-diet mice, but not the high-VitE mice. Low VitC retinas contained increased levels of SOD2 in sham and 2 week post-blast mice, suggesting an endogenous compensatory effect of the low-VitC diet. This experiment was repeated twice. n = 5 for all groups. *p < 0.05, **p < 0.01, ***p < 0.001, #p < 0.0001
Fig. 3
Fig. 3. Diets alter activation of the inflammasome pathway after injury.
a Western blots of cleaved and total caspase-1 in sham and post-blast mice treated with a high-VitE or low-VitC diet. b Quantification of cleaved to total caspase-1 shows a greater increase in low-VitC retinas than control-diet mice. There was no increase in activated caspase -1 in the retinas of mice on a high-VitE diet. c, d Quantification of IL-1α (c) and IL-1β (d) shows that levels are elevated in retinas of mice on a low-VitC diet regardless of injury. There was no increase in IL-1α or IL-1β levels in the retinas of high-VitE-diet mice. e Quantification of IL-18 levels also shows an overall elevation in retinas from mice on a low-VitC diet. In addition, these mice also had a transient increase at 2 weeks after injury as in control-diet mice. There was no increase in IL-18 in the retinas from the high-VitE-diet mice. This experiment was repeated twice. n = 5 for all groups. *p < 0.05, **p < 0.01, ***p < 0.001, #p < 0.0001
Fig. 4
Fig. 4. High-VitE diet prevents injury-induced axon degeneration and axon transport deficits.
a-g Representative brightfield micrographs of ON from a sham (scale represents 20 μm and applies to all micrographs); b 2-week post-blast (arrow indicates re-myelination; arrowhead indicates Wallerian degeneration); c 4 week post-blast (note the loss of small axons); d 2 week post-blast low-VitC-diet; e 4 week post-blast low-VitC-diet; f 2-week post-blast high-VitE-diet; and g 4 week post-blast high-VitE-diet mice. h-l Representative heat maps of fluorescently tagged CTB in the superior colliculus of sham (h), 2 week post-blast (i), 4 week post-blast (j), 2 week post-blast high-VitE-diet (k), and 4 week post-blast high-VitE-diet (l) mice. Medial (M), lateral superior colliculs (L), inferior (I), nasal (N), superior (S), and temporal (T) regions of the retinotopic map on the superior colliculus. m Quantification of total axons at 2 and 4 weeks after blast exposure in all diet groups as compared to their respective shams. Total axons were preserved in the high-VitE-diet group only. n Quantification of degenerative axons at 2 and 4 weeks after blast exposure in all diet groups as compared to their respective shams. Axon degeneration was more sustained in the low-VitC-diet group and was lowest overall in the high-VitE-diet group. o Quantification of cross-sectional ON glial area at 2 and 4 weeks after blast exposure in all diet groups as compared to their respective shams. Baseline glial area was elevated in the low-VitC-diet group and was unchanged after injury. The increase in glia area was less than in controls in the high-VitE-diet group. p Quantification of axon transport based on CTB fluorescence levels in the superior colliculus. Axon transport was preserved in the mice on the high-VitE diet. This experiment was repeated twice. n = 5 for all groups. *p < 0.05, **p < 0.01, ***p < 0.001, #p < 0.0001
Fig. 5
Fig. 5. High-VitE diet prevents injury-induced decrease in the VEP N1 amplitude and latency.
a Representative waveforms from sham, and 4 week post-injury mice on control, low-VitC, or high-VitE diets. b Quantification of the VEP N1 amplitude shows a decrease in both at 2 and 4 weeks after injury in mice on the control or low-VitC diets. Mice on the high-VitE diet show no decrease in amplitude at either time point. c Quantification of the VEP N1 latency shows increased latency that is statistically significant at 1 month after blast in both control and low-VitC-diet groups. There was no change in latency after blast in the high-VitE group. A total of 23 sham, 24 2-week-injury, 19 4-week-injury, 21 high-VitE sham, 10 high-VitE 2-week-injury, and 19 4-week-injury mice were used. *p < 0.05, ***p < 0.001, #p < 0.0001
Fig. 6
Fig. 6. KD prevents increase in IL-1α and superoxide, but not IL-1β, and preserves axons and VEP.
a Average mouse weight over duration of the study. Mice on the KD lost weight over the course of the first week, but regained this weight over time. Both diet groups had comparable weight at the beginning and end of the study. b Quantification of ketone body levels in serum of mice fed a KD or KCD. The KD increased ketone plasma levels regardless of blast exposure. c Representative western blot of SOD2. d Quantification of SOD2 levels in retinas from sham or post-blast mice fed control (KCD) or KD (Keto) diet. The KD prevented the blast-induced decrease in SOD2. e Quantification of DHE fluorescence in the retinas of mice on the KD or KCD. The KD prevented the increase in superoxide levels. f Quantification of cleaved to total caspase-1 in retinas from sham or post-blast mice fed a KCD or KD. The KD prevented activation of caspase-1. g Quantification of IL-1α levels in retinas from sham or post-blast mice fed a KD or KCD. The KD prevented the blast-induced increase in IL-1α. h Quantification of IL-1β levels in retinas from sham or post-blast mice fed a KD or KCD. Levels were increased similarly in both groups. i-k Brightfield micrographs of representative optic nerve cross-sections from KCD sham (i), KCD 4 weeks post-blast (j), and KD 4 weeks post-blast (k) mice. l Quantification of ON cross-sectional glial area in all groups showing an increase in glial area only in the KCD group. m Quantification of total axons in all groups showing a decrease only in the KCD group. n Quantification of CTB fluorescence in the superior colliculus (percent axon transport) in mice from all groups showing a decreased loss in transport in the KD group. o, p Quantification of VEP N1 amplitude (o) and latency (p) in sham and post-blast mice on all diets showing preservation of waveforms in the KD group. A total of 5 samples were used for the biochemistry and axon histology. A total of 8 KCD sham mice, 10 KCD blast mice, 5 KD sham mice, and 11 KD blast mice were used for the VEPs. *p < 0.05, **p < 0.01, ***p < 0.001

References

    1. Vlasov A, Ryan D, Ludlow S, Weichel E, Colyer M. Causes of combat ocular trauma-related blindness from operation Iraqi freedom and enduring freedom. J. Trauma Acute Care Surg. 2015;79:S210–S215. doi: 10.1097/TA.0000000000000666. - DOI - PubMed
    1. Weichel E, Colyer M, Ludlow S, Bower K, Eiseman A. Combat ocular trauma visual outcomes during operations Iraqi and enduring freedom. Ophthalmology. 2008;115:2235–2245. doi: 10.1016/j.ophtha.2008.08.033. - DOI - PubMed
    1. Sarkies N. Traumatic optic neuropathy. Eye. 2004;18:1122–1125. doi: 10.1038/sj.eye.6701571. - DOI - PubMed
    1. Steinsapir K, Goldberg R. Traumatic optic neuropathy. Surv. Ophthalmol. 1994;38:487–518. doi: 10.1016/0039-6257(94)90145-7. - DOI - PubMed
    1. Weichel E, Colyer M, Bautista C, Bower K, French L. Traumatic brain injury associated with combat ocular trauma. J. Head. Trauma Rehab. 2009;24:41–50. doi: 10.1097/HTR.0b013e3181956ffd. - DOI - PubMed

Publication types

MeSH terms