

Transcriptomic and functional network features of lung squamous cell carcinoma through integrative analysis of GEO and TCGA data
- PMID: 30367091
- PMCID: PMC6203807
- DOI: 10.1038/s41598-018-34160-w
Transcriptomic and functional network features of lung squamous cell carcinoma through integrative analysis of GEO and TCGA data
Abstract
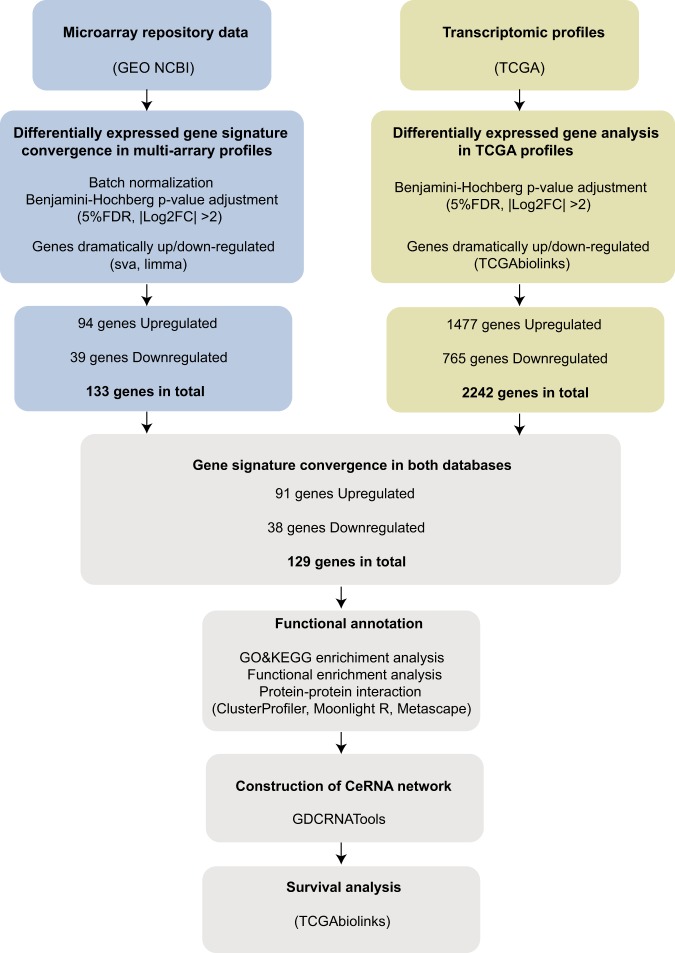
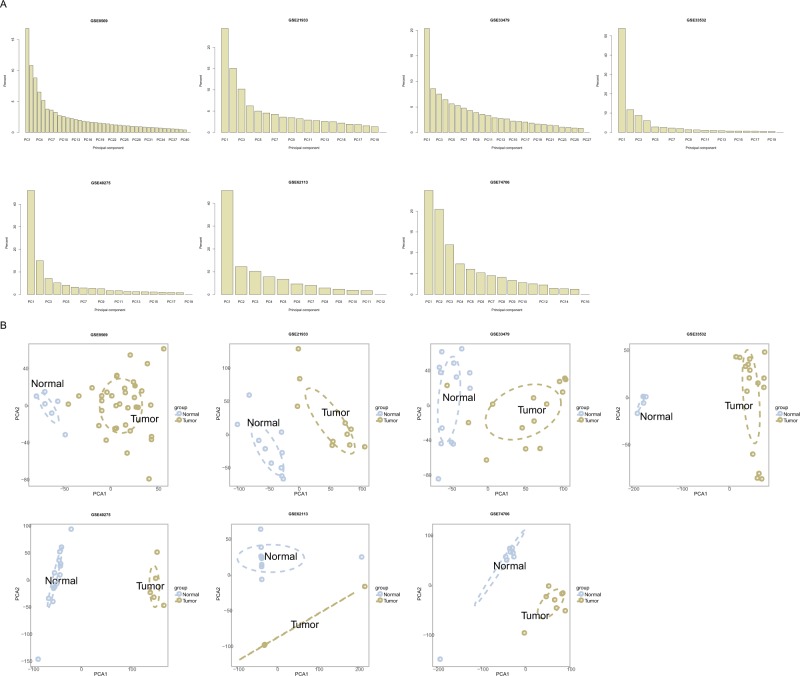
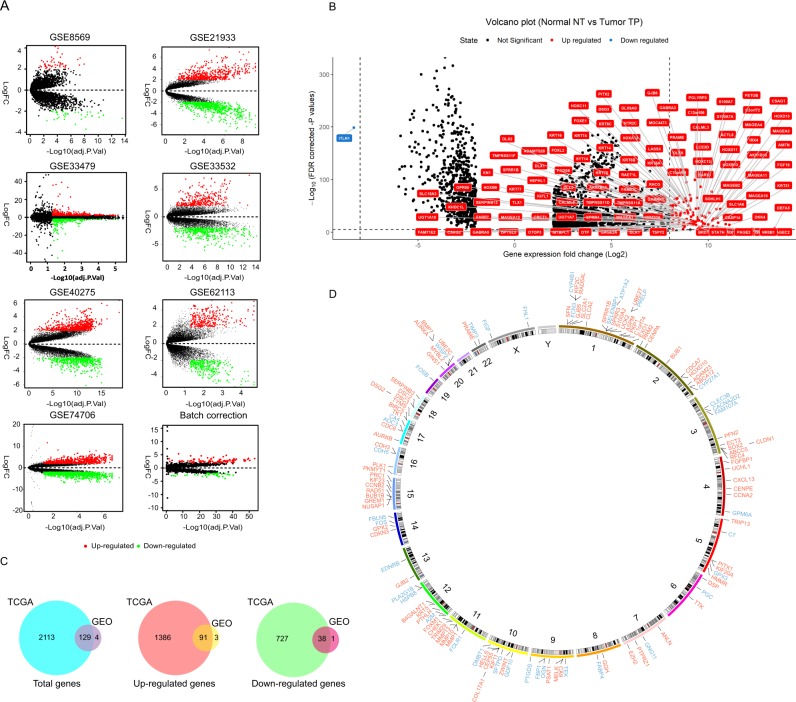
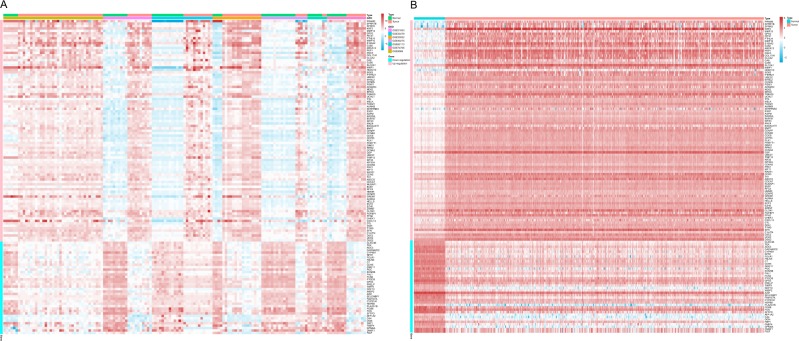
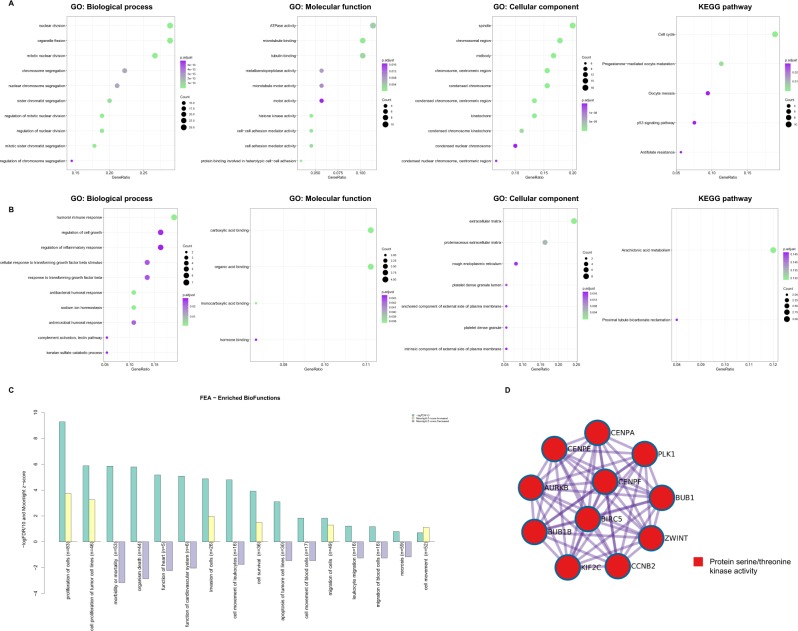
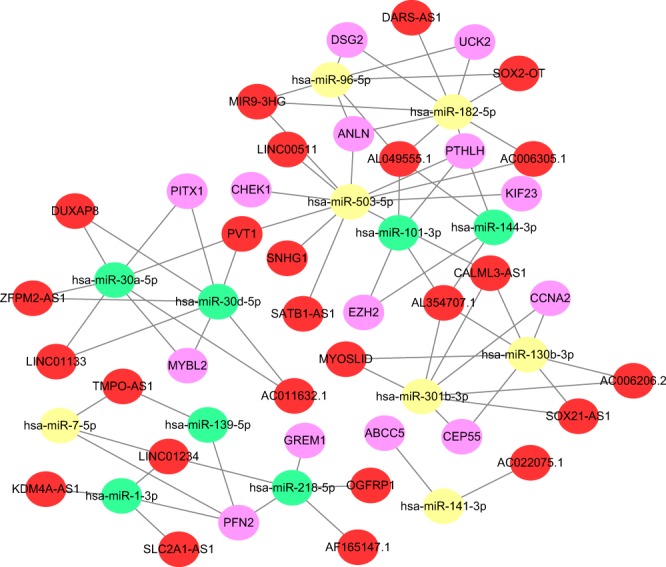
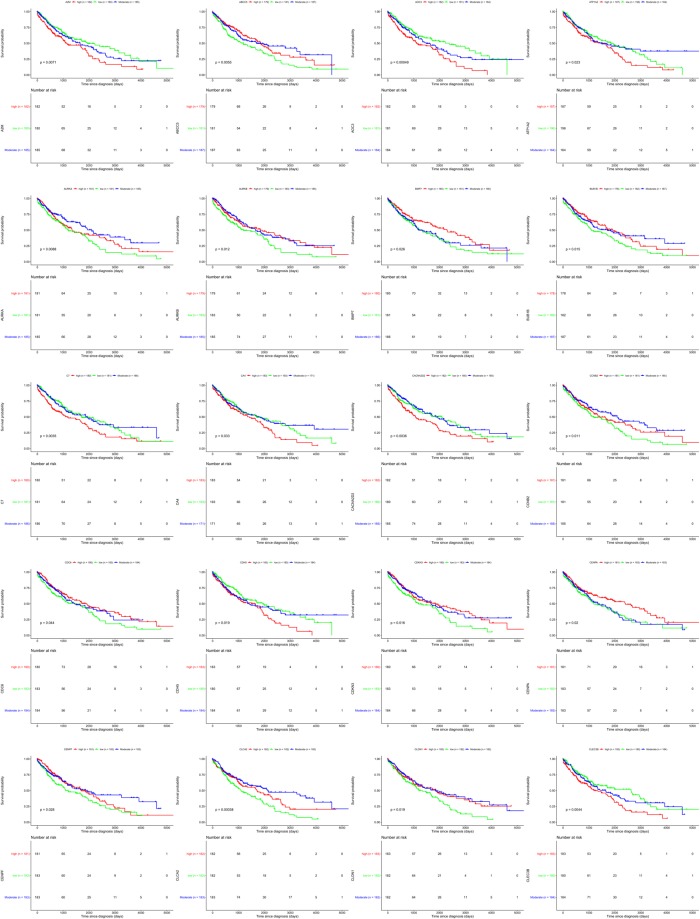
Lung squamous cell carcinoma (LUSC) is associated with poor clinical prognosis and lacks available targeted therapy. Novel molecules are urgently required for the diagnosis and prognosis of LUSC. Here, we conducted our data mining analysis for LUSC by integrating the differentially expressed genes acquired from Gene Expression Omnibus (GEO) database by comparing tumor tissues versus normal tissues (GSE8569, GSE21933, GSE33479, GSE33532, GSE40275, GSE62113, GSE74706) into The Cancer Genome Atlas (TCGA) database which includes 502 tumors and 49 adjacent non-tumor lung tissues. We identified intersections of 129 genes (91 up-regulated and 38 down-regulated) between GEO data and TCGA data. Based on these genes, we conducted our downstream analysis including functional enrichment analysis, protein-protein interaction, competing endogenous RNA (ceRNA) network and survival analysis. This study may provide more insight into the transcriptomic and functional features of LUSC through integrative analysis of GEO and TCGA data and suggests therapeutic targets and biomarkers for LUSC.
Conflict of interest statement
The authors declare no competing interests.
Figures
Similar articles
-
Clinical value of miR-182-5p in lung squamous cell carcinoma: a study combining data from TCGA, GEO, and RT-qPCR validation.World J Surg Oncol. 2018 Apr 10;16(1):76. doi: 10.1186/s12957-018-1378-6. World J Surg Oncol. 2018. PMID: 29636077 Free PMC article.
-
Clinical value of miR-198-5p in lung squamous cell carcinoma assessed using microarray and RT-qPCR.World J Surg Oncol. 2018 Feb 2;16(1):22. doi: 10.1186/s12957-018-1320-y. World J Surg Oncol. 2018. PMID: 29394946 Free PMC article.
-
Identifying the key hub genes linked with lung squamous cell carcinoma by examining the differentially expressed and survival genes.Mol Genet Genomics. 2024 Aug 3;299(1):76. doi: 10.1007/s00438-024-02169-8. Mol Genet Genomics. 2024. PMID: 39097557
-
Identification of a seven-miRNA signature as prognostic biomarker for lung squamous cell carcinoma.Oncotarget. 2016 Dec 6;7(49):81670-81679. doi: 10.18632/oncotarget.13164. Oncotarget. 2016. PMID: 27835574 Free PMC article.
-
Role of downregulated ADARB1 in lung squamous cell carcinoma.Mol Med Rep. 2020 Mar;21(3):1517-1526. doi: 10.3892/mmr.2020.10958. Epub 2020 Jan 23. Mol Med Rep. 2020. PMID: 32016472 Free PMC article.
Cited by
-
High expression levels of pyrimidine metabolic rate-limiting enzymes are adverse prognostic factors in lung adenocarcinoma: a study based on The Cancer Genome Atlas and Gene Expression Omnibus datasets.Purinergic Signal. 2020 Sep;16(3):347-366. doi: 10.1007/s11302-020-09711-4. Epub 2020 Jul 8. Purinergic Signal. 2020. PMID: 32638267 Free PMC article.
-
A model of twenty-three metabolic-related genes predicting overall survival for lung adenocarcinoma.PeerJ. 2020 Sep 24;8:e10008. doi: 10.7717/peerj.10008. eCollection 2020. PeerJ. 2020. PMID: 33024640 Free PMC article.
-
Development of a disulfidptosis-related lncRNA prognostic signature for enhanced prognostic assessment and therapeutic strategies in lung squamous cell carcinoma.Sci Rep. 2024 Aug 1;14(1):17804. doi: 10.1038/s41598-024-68423-6. Sci Rep. 2024. PMID: 39090162 Free PMC article.
-
Jmjd2c maintains the ALDHbri+ cancer stemness with transcription factor SOX2 in lung squamous cell carcinoma.Cancer Biol Ther. 2024 Dec 31;25(1):2373447. doi: 10.1080/15384047.2024.2373447. Epub 2024 Jul 8. Cancer Biol Ther. 2024. PMID: 38975736 Free PMC article.
-
SOCS3 is Related to Cell Proliferation in Neuronal Tissue: An Integrated Analysis of Bioinformatics and Experiments.Front Genet. 2021 Sep 27;12:743786. doi: 10.3389/fgene.2021.743786. eCollection 2021. Front Genet. 2021. PMID: 34646310 Free PMC article.
References
Publication types
MeSH terms
LinkOut - more resources
Full Text Sources
Medical
