

Investigating the Ca2+-dependent and Ca2+-independent mechanisms for mammalian cone light adaptation
- PMID: 30367097
- PMCID: PMC6203770
- DOI: 10.1038/s41598-018-34073-8
Investigating the Ca2+-dependent and Ca2+-independent mechanisms for mammalian cone light adaptation
Abstract
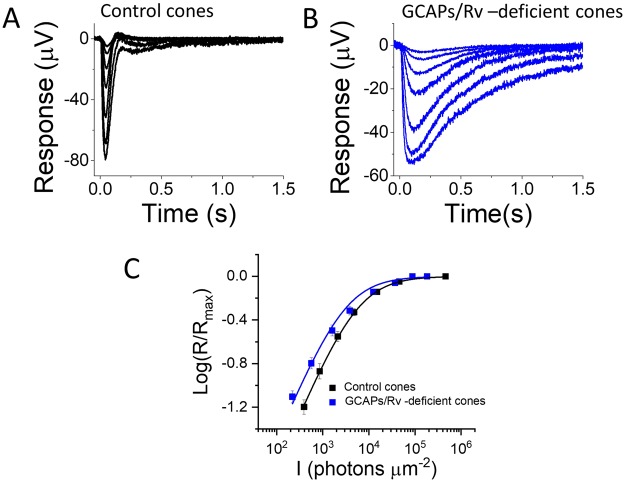
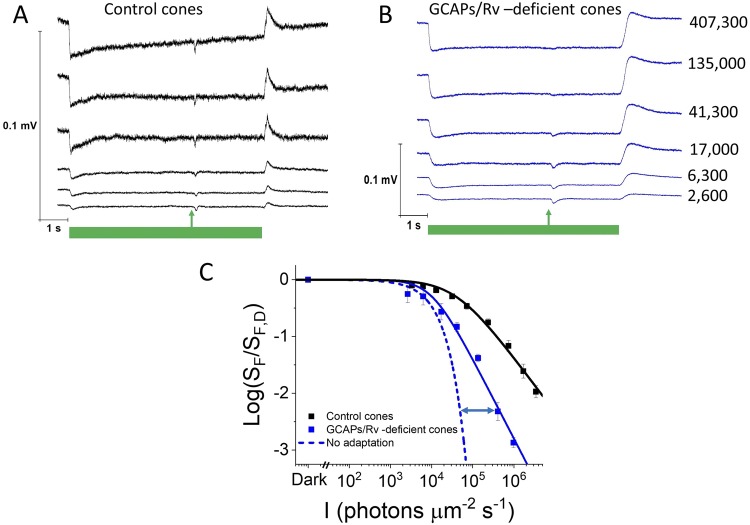
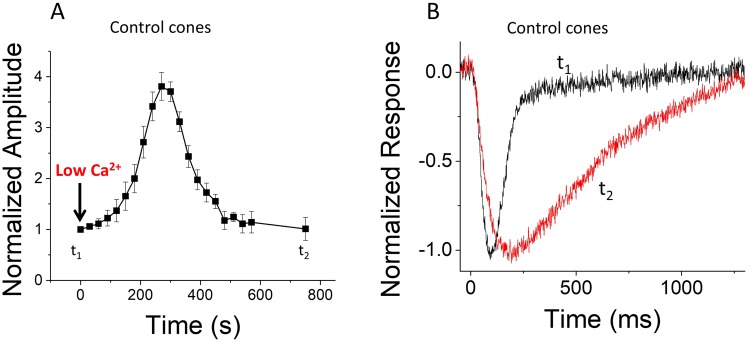
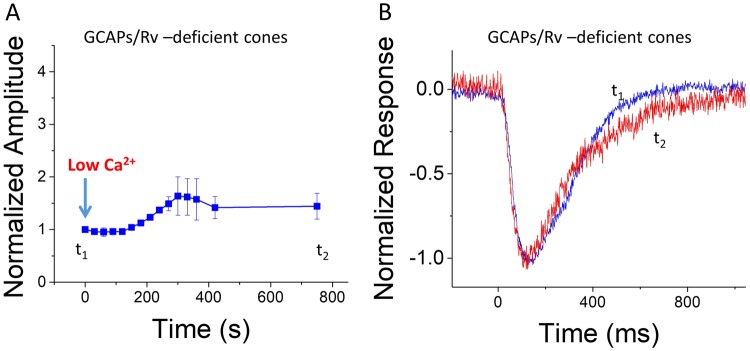
Vision is mediated by two types of photoreceptors: rods, enabling vision in dim light; and cones, which function in bright light. Despite many similarities in the components of their respective phototransduction cascades, rods and cones have distinct sensitivity, response kinetics, and adaptation capacity. Cones are less sensitive and have faster responses than rods. In addition, cones can function over a wide range of light conditions whereas rods saturate in moderately bright light. Calcium plays an important role in regulating phototransduction and light adaptation of rods and cones. Notably, the two dominant Ca2+-feedbacks in rods and cones are driven by the identical calcium-binding proteins: guanylyl cyclase activating proteins 1 and 2 (GCAPs), which upregulate the production of cGMP; and recoverin, which regulates the inactivation of visual pigment. Thus, the mechanisms producing the difference in adaptation capacity between rods and cones have remained poorly understood. Using GCAPs/recoverin-deficient mice, we show that mammalian cones possess another Ca2+-dependent mechanism promoting light adaptation. Surprisingly, we also find that, unlike in mouse rods, a unique Ca2+-independent mechanism contributes to cone light adaptation. Our findings point to two novel adaptation mechanisms in mouse cones that likely contribute to the great adaptation capacity of cones over rods.
Conflict of interest statement
The authors declare no competing interests.
Figures
Similar articles
-
Tuning outer segment Ca2+ homeostasis to phototransduction in rods and cones.Adv Exp Med Biol. 2002;514:179-203. doi: 10.1007/978-1-4615-0121-3_11. Adv Exp Med Biol. 2002. PMID: 12596922 Review.
-
Guanylate cyclase-activating protein 2 contributes to phototransduction and light adaptation in mouse cone photoreceptors.J Biol Chem. 2018 May 11;293(19):7457-7465. doi: 10.1074/jbc.RA117.001574. Epub 2018 Mar 16. J Biol Chem. 2018. PMID: 29549122 Free PMC article.
-
Role of guanylyl cyclase modulation in mouse cone phototransduction.J Neurosci. 2011 Jun 1;31(22):7991-8000. doi: 10.1523/JNEUROSCI.6650-10.2011. J Neurosci. 2011. PMID: 21632921 Free PMC article.
-
GUCY2D Cone-Rod Dystrophy-6 Is a "Phototransduction Disease" Triggered by Abnormal Calcium Feedback on Retinal Membrane Guanylyl Cyclase 1.J Neurosci. 2018 Mar 21;38(12):2990-3000. doi: 10.1523/JNEUROSCI.2985-17.2018. Epub 2018 Feb 12. J Neurosci. 2018. PMID: 29440533 Free PMC article.
-
Speed, sensitivity, and stability of the light response in rod and cone photoreceptors: facts and models.Prog Retin Eye Res. 2012 Sep;31(5):442-66. doi: 10.1016/j.preteyeres.2012.05.002. Epub 2012 May 29. Prog Retin Eye Res. 2012. PMID: 22658984 Free PMC article. Review.
Cited by
-
Olfactory marker protein directly buffers cAMP to avoid depolarization-induced silencing of olfactory receptor neurons.Nat Commun. 2020 May 4;11(1):2188. doi: 10.1038/s41467-020-15917-2. Nat Commun. 2020. PMID: 32366818 Free PMC article.
-
Feedforward and feedback mechanisms cooperatively regulate rapid experience-dependent response adaptation in a single thermosensory neuron type.Proc Natl Acad Sci U S A. 2024 Apr 2;121(14):e2321430121. doi: 10.1073/pnas.2321430121. Epub 2024 Mar 26. Proc Natl Acad Sci U S A. 2024. PMID: 38530893 Free PMC article.
-
Increasing Ca2+ in photoreceptor mitochondria alters metabolites, accelerates photoresponse recovery, and reveals adaptations to mitochondrial stress.Cell Death Differ. 2020 Mar;27(3):1067-1085. doi: 10.1038/s41418-019-0398-2. Epub 2019 Aug 2. Cell Death Differ. 2020. PMID: 31371786 Free PMC article.
-
Feedforward and feedback mechanisms cooperatively regulate rapid experience-dependent response adaptation in a single thermosensory neuron type.bioRxiv [Preprint]. 2023 Dec 6:2023.12.05.570166. doi: 10.1101/2023.12.05.570166. bioRxiv. 2023. Update in: Proc Natl Acad Sci U S A. 2024 Apr 2;121(14):e2321430121. doi: 10.1073/pnas.2321430121. PMID: 38168209 Free PMC article. Updated. Preprint.
-
Regional tuning of photoreceptor adaptation in the primate retina.Nat Commun. 2024 Oct 12;15(1):8821. doi: 10.1038/s41467-024-53061-3. Nat Commun. 2024. PMID: 39394185 Free PMC article.
References
Publication types
MeSH terms
Substances
Grants and funding
LinkOut - more resources
Full Text Sources
Molecular Biology Databases
Miscellaneous
