. 2018 Oct 26;8(1):15841.
doi: 10.1038/s41598-018-33960-4.

Single-Stranded Nucleic Acids Regulate TLR3/4/7 Activation through Interference with Clathrin-Mediated Endocytosis

Affiliations

Single-Stranded Nucleic Acids Regulate TLR3/4/7 Activation through Interference with Clathrin-Mediated Endocytosis

Peter Järver et al. Sci Rep. .

Abstract

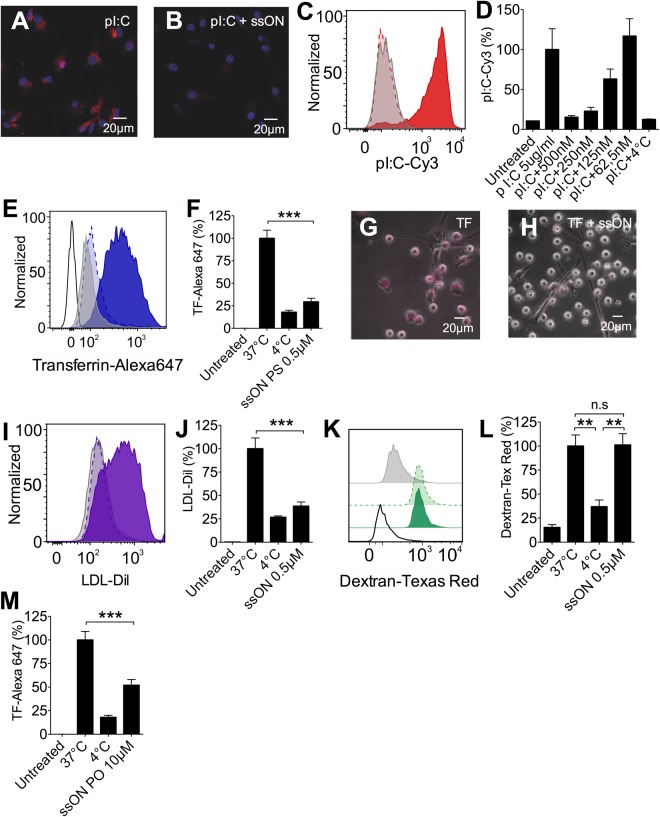
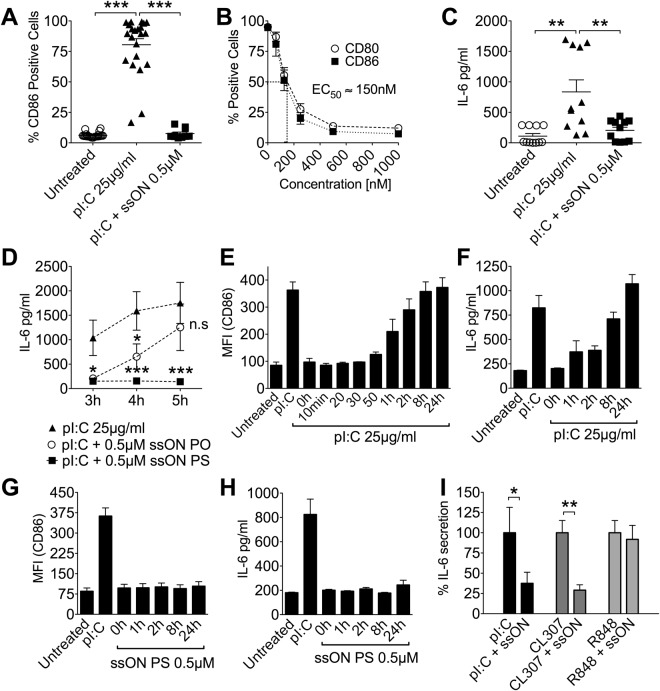
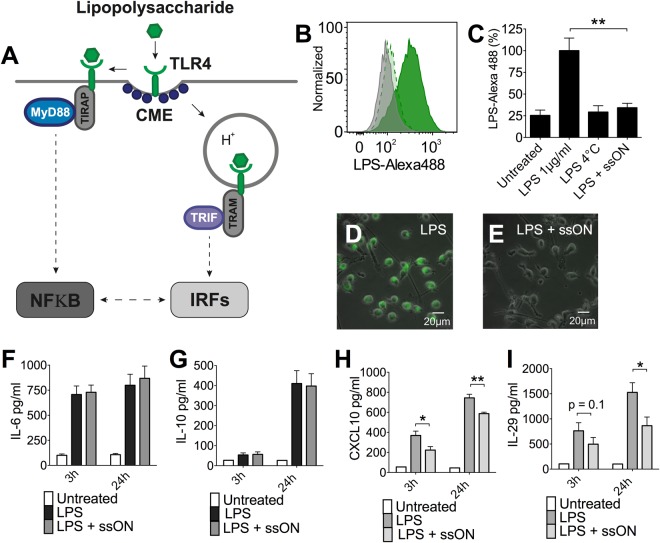
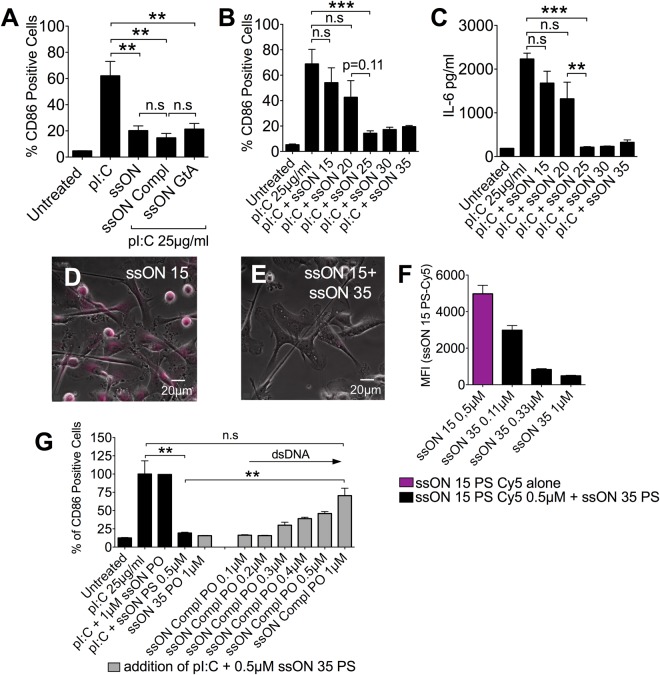
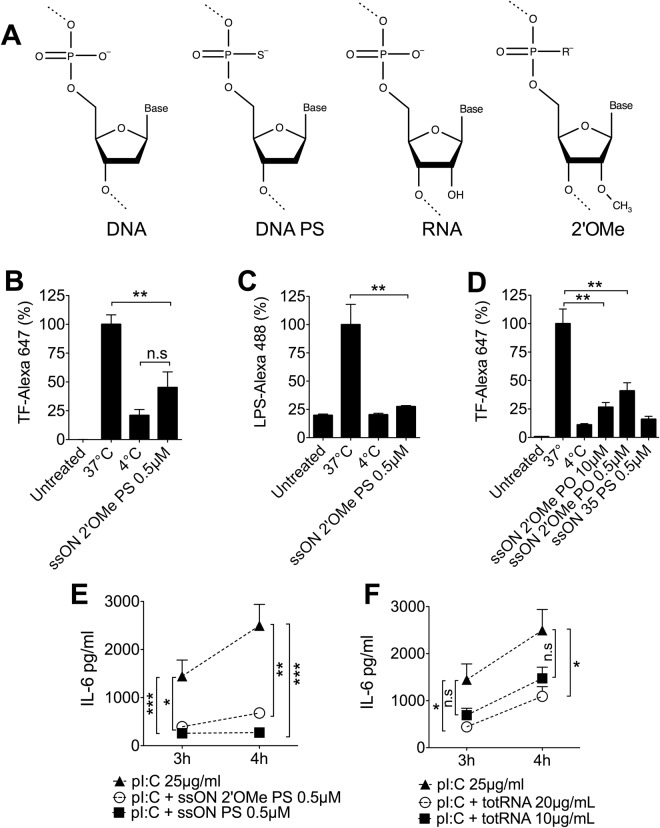
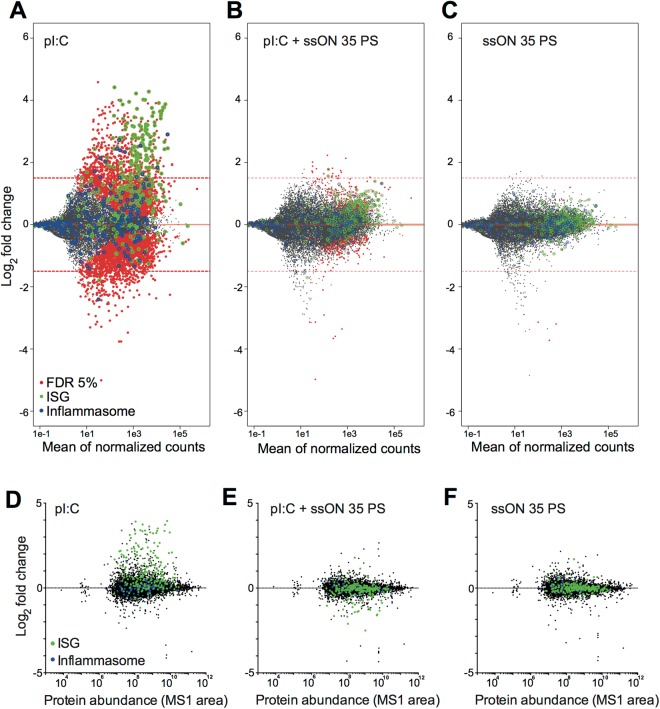
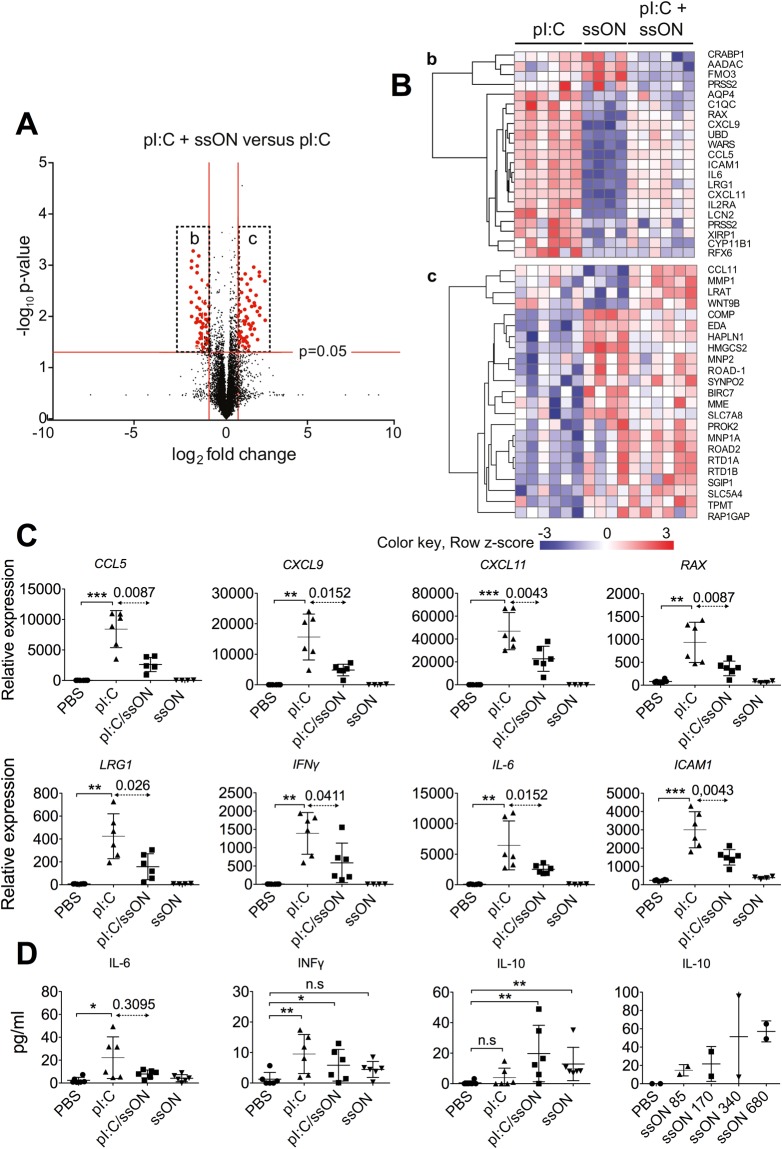
Recognition of nucleic acids by endosomal Toll-like receptors (TLR) is essential to combat pathogens, but requires strict control to limit inflammatory responses. The mechanisms governing this tight regulation are unclear. We found that single-stranded oligonucleotides (ssON) inhibit endocytic pathways used by cargo destined for TLR3/4/7 signaling endosomes. Both ssDNA and ssRNA conferred the endocytic inhibition, it was concentration dependent, and required a certain ssON length. The ssON-mediated inhibition modulated signaling downstream of TLRs that localized within the affected endosomal pathway. We further show that injection of ssON dampens dsRNA-mediated inflammatory responses in the skin of non-human primates. These studies reveal a regulatory role for extracellular ssON in the endocytic uptake of TLR ligands and provide a mechanistic explanation of their immunomodulation. The identified ssON-mediated interference of endocytosis (SOMIE) is a regulatory process that temporarily dampens TLR3/4/7 signaling, thereby averting excessive immune responses.


Conflict of interest statement

P.J., A.D., A.E.S., and AL.S are authors of patent applications related to the work and are shareholders of TIRmed Pharma.

Figures

Figure 1
Figure 1
SsON inhibit CME and spare MPC in human moDC. Human moDC were treated for 45 min at +37 °C or +4 °C with endocytic uptake markers (pI:C-Cy3, TF-Alexa647, LDL-Dil, and Dextran-Texas Red) with or without addition of ssON. Flow cytometry histograms show representative data from at least three donors, in separate experiments. Red, blue, purple or green histograms are without ssON. Lighter colors with dashed lines depict the addition of ssON. Grey display background (fluorescent signal at +4 °C). (A,B) Confocal microscopy of pI:C uptake in the absence (A) or presence of 0.5 µM ssON 35 PS at + 37 °C (B). (C) 0.5 µM ssON 35 PS inhibited uptake of pI:C. (D) The inhibition of pI:C uptake was dependent on ssON 35 PS concentration. (E) Flow cytometry analysis of TF uptake in the presence of 0.5 µM ssON 35 PS at + 37 °C or +4 °C. (F) Quantification of TF uptake in the presence of 0.5 µM ssON 35 PS at +37 °C or +4 °C. (G,H) Wide-field microscopy of TF uptake in the absence (G) or presence of 0.5 µM ssON 35 PS at +37 °C (H). (I) Flow cytometry analysis of LDL uptake in the presence of 0.5 µM ssON 35 PS at +37 °C or +4 °C. (J) Quantification of LDL uptake in the presence of 0.5 µM ssON 35 PS at +37 °C or +4 °C. (K) Flow cytometry analysis of Dextran uptake in the presence of 0.5 µM ssON 35 PS at +37 °C or +4 °C. (L) Quantification of Dextran uptake in the presence of 0.5 µM ssON 35 PS at +37 °C or +4 °C. (M) 10 µM ssON 35 PO partly inhibited uptake of CME (TF). All data are from at least three donors in duplicate. Error bars are given in SEM. Non-parametric Mann-Whitney test was used to compare the data. P-value: not significant (n.s) P > 0.05; *P ≤ 0.05; **P ≤ 0.01; ***P ≤ 0.001.
Figure 2
Figure 2
SsON inhibit TLR3 and TLR7 activation. (A) The frequency of moDC expressing CD86 was determined by flow cytometry. 0.5 µM ssON 35 PS completely inhibited pI:C-induced CD86 expression (48 h). Results from individual donors are shown. (B) The ssON 35 PS-mediated inhibition of CD86 and CD80 expression in pI:C exposed moDC was concentration dependent (48 h), EC50 between 100–200 nM). (C) SsON 35 PS completely inhibited pI:C-induced IL-6 secretion from moDC (48 h). ELISA results from individual donors are shown. (D) PS modification was not essential for the inhibitory effect. IL-6 released from moDC was quantified by ELISA. (E,F) CD86 expression and IL-6 secretion from moDC exposed to pI:C and subsequently challenged with ssON 35 PS at time-points from 5 min to 24 h. (G,H) MoDC treated in the opposite way, first ssON 35 PS and subsequently challenged with pI:C. (I) SsON mediated inhibition of IL-6 secretion in PBMC (24 h) was limited to agonists that are taken up by endocytosis (pI:C and CL307). Unless otherwise stated, all data are from at least three donors in duplicate. Error bars are given in SEM. Non-parametric Mann-Whitney test was used to compare the data. P-value: not significant (n.s) P > 0.05; *P ≤ 0.05; **P ≤ 0.01; ***P ≤ 0.001. See also Fig. S1.
Figure 3
Figure 3
Partial inhibition of TLR4 activation in moDC exposed to ssON 35 PS. (A) Schematic view of TLR4-mediated cell signaling. Human moDC were exposed to the TLR4 agonist LPS with or without ssON 35 PS. (B) 0.5 µM ssON 35 PS inhibited uptake of fluorescently labelled LPS-Alexa488. Histograms show representative data from at least three donors. Dark green histogram is without ssON. Lighter color with a dashed lines depicts the addition of ssON. Grey displays background (fluorescent signal at +4 °C). (C) Quantitative analysis of LPS uptake measured by flow cytometry in the presence of 0.5 µM ssON 35 PS at +37 °C or +4 °C. (D) Wide-field microscopy of uptake of fluorescent LPS-Alexa488 in moDC (E) in the presence of 0.5 µM ssON 35 PS. (F,G) 0.5 µM ssON 35 PS had no influence on secretion of cytokines/chemokines that are downstream of NF-κB-mediated signaling pathways (IL-6 and IL-10). (H,I) 0.5 µM ssON 35 PS reduced secretion of cytokines/chemokines that are downstream of TRIF mediated signaling pathways (IL-29 and CXCL10). All data are from at least three donors in duplicate. Error bars are given in SEM. Non-parametric Mann-Whitney test was used to compare the data. P-value: not significant (n.s) P > 0.05; *P ≤ 0.05; **P ≤ 0.01; ***P ≤ 0.001.
Figure 4
Figure 4
SsON, but not dsDNA, of at least 20–25 bases inhibit TLR3 activation. (A) The inhibition of pI:C-induced CD86 expression (48 h) in moDC was not dependent on a canonical sequence (for sequences, see Table S1). (B,C) The inhibition of pI:C-induced CD86 expression (48 h) (B) and IL-6 production (24 h) (C) in moDC was dependent on the ssON length (ssON PS 15–35). (D) Uptake of fluorescent ssON-color Cy5 15 PS in moDC (E) in the presence 0.5 µM ssON 35 PS. (F) Inhibition of fluorescent ssON 15 PS uptake was dependent on ssON 35 PS concentration. (G) Introduction of the complementary strand (ssON Compl PO) abolished the inhibitory effect on pI:C-induced CD86 expression (48 h) of 0.5 µM ssON 35 PS. All data are from at least three donors in duplicate. Error bars are given in SEM. Non-parametric Mann-Whitney test was used to compare the data. P-value: not significant (n.s) P > 0.05; *P ≤ 0.05; **P ≤ 0.01; ***P ≤ 0.001.
Figure 5
Figure 5
SsRNA display similar ability as ssDNA to inhibit endocytic uptake in human moDC. Human moDC were treated for 45 min at +37 °C or +4 °C with TF (Alexa 647) or LPS (Alexa 488) with or without addition of ssON 2′OMe RNA PS (Table S1). (A) Structures of repeating units of oligonucleotides and oligonucleotide analogues used in this study. (B,C) 0.5 µM ssON 2′OMe RNA PS inhibited uptake of fluorescently labelled TF and LPS. (D) SsON 2′OMe RNA with a native PO backbone is able to block TF uptake in moDC. (E) SsON 2′OMe RNA PS displayed the same efficacy as ssON 35 DNA PS in blocking pI:C-induced secretion of IL-6 from moDC. (F) Total RNA inhibited pI:C-induced IL-6 secretion from moDC in a concentration dependent manner. All data are from at least three donors in duplicate. Error bars are given in SEM. Non-parametric Mann-Whitney test was used to compare the data. P-value: not significant (n.s) P > 0.05; *P ≤ 0.05; **P ≤ 0.01; ***P ≤ 0.001.
Figure 6
Figure 6
SsON 35 PS inhibits pI:C induced changes in the transcriptome and proteome profile in moDC. Colored circles mark genes included in specific categories (green = ISGs, blue = inflammasome related). (AC) RNA-seq data from moDC 24 h post treatment (3 donors). MA-plots log2 fold changes adjusted p-values below 0.05 in red. (A) PI:C treatment vs non-treated cells shows high upregulation of ISGs. (B) Combined treatment with pI:C and ssON 35 PS (0.5 µM) vs non-treated cells show minor differences. (C) SsON 35 PS treatment (0.5 µM) vs non-treated cells show minor differences. (DF) Whole cell proteomic data from moDC 24 h post treatment (3 donors). MA-plots of whole cell proteomic data (protein log intensity ratio versus average intensity). (D) PI:C treatment vs non-treated cells show high upregulation of ISGs. (E) Combined treatment with pI:C and ssON 35 PS (0.5 µM) vs non-treated cells show minor differences. (F) SsON 35 PS treatment (0.5 µM) vs non-treated cells show minor differences. See also Figs S3–S5.
Figure 7
Figure 7
SsON dampens dsRNA-mediated inflammatory signatures in macaque skin. (A) RNA expression in skin following injection with dsRNA (pI:C) in the presence or absence of ssON 35 PS. Volcano plot illustrating log2 fold-change and p < 0.05 in red. (B) Clustering of genes showing the highest differential expression comparing pI:C + ssON with ssON 35 PS treatment alone (b,c). Gene expression is represented as gene-wise standardized expression (Z score) with p < 0.05. Red and blue correspond to up- and down-regulated genes, respectively. Unsupervised hierarchical clustering of genes based on Spearman-correlation. (C) Relative mRNA expression values from the microarray analyses of individual macaque skin biopsies 24 h post-stimulation (means ± SEM). (D) Concentrations of indicated cytokine proteins present in supernatants of enzymatically digested skin biopsies (24 h post-stimulation in vivo) (means ± SEM from individual animals). Lower right panel shows IL-10 production in a dose escalation experiment with ssON ranging from 85–680 μg per injection (n = 2). Significant differences were assessed by non-parametric Kruskal-Wallis test and Dunn’s post-test (*P < 0.05, **P < 0.01 and ***P < 0.001). Different treatment groups were compared using nonparametric Mann-Whitney unpaired test, as indicated. See also Figs S5 and S6.

References

    1. Pandey S, Kawai T, Akira S. Microbial sensing by Toll-like receptors and intracellular nucleic acid sensors. Cold Spring Harb Perspect Biol. 2014;7:a016246. doi: 10.1101/cshperspect.a016246. - DOI - PMC - PubMed
    1. Takeda K, Kaisho T, Akira S. Toll-like receptors. Annu. Rev. Immunol. 2003;21:335–376. doi: 10.1146/annurev.immunol.21.120601.141126. - DOI - PubMed
    1. Akira S, Takeda K. Toll-like receptor signalling. Nat. Rev. Immunol. 2004;4:499–511. doi: 10.1038/nri1391. - DOI - PubMed
    1. Pelka K, Shibata T, Miyake K, Latz E. Nucleic acid-sensing TLRs and autoimmunity: novel insights from structural and cell biology. Immunol. Rev. 2016;269:60–75. doi: 10.1111/imr.12375. - DOI - PubMed
    1. Govindaraj RG, Manavalan B, Basith S, Choi S. Comparative analysis of species-specific ligand recognition in Toll-like receptor 8 signaling: a hypothesis. PLoS ONE. 2011;6:e25118. doi: 10.1371/journal.pone.0025118. - DOI - PMC - PubMed

Publication types

MeSH terms