. 2018 Aug 13;19(Suppl 9):280.
doi: 10.1186/s12859-018-2273-4.

A graph-based approach for proteoform identification and quantification using top-down homogeneous multiplexed tandem mass spectra

Affiliations

A graph-based approach for proteoform identification and quantification using top-down homogeneous multiplexed tandem mass spectra

Kaiyuan Zhu et al. BMC Bioinformatics. .

Abstract

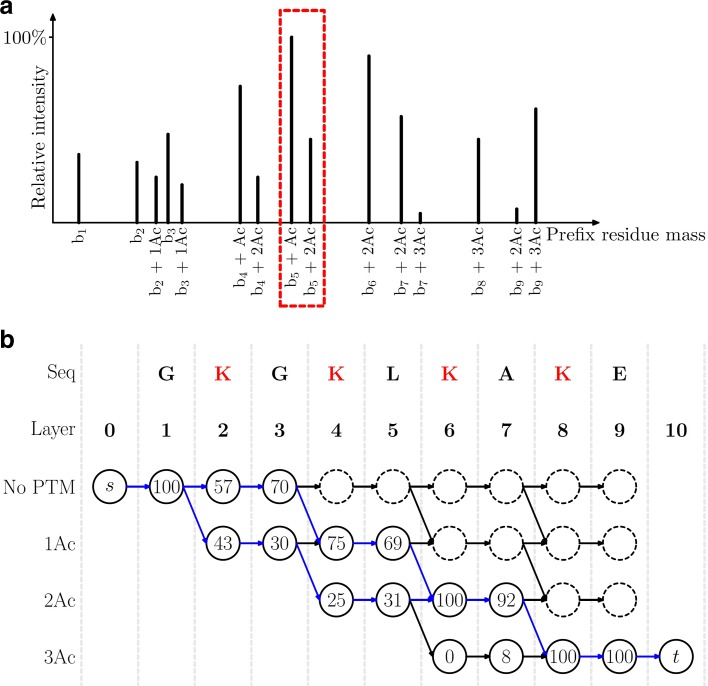
Background: Top-down homogeneous multiplexed tandem mass (HomMTM) spectra are generated from modified proteoforms of the same protein with different post-translational modification patterns. They are frequently observed in the analysis of ultramodified proteins, some proteoforms of which have similar molecular weights and cannot be well separated by liquid chromatography in mass spectrometry analysis.

Results: We formulate the top-down HomMTM spectral identification problem as the minimum error k-splittable flow problem on graphs and propose a graph-based algorithm for the identification and quantification of proteoforms using top-down HomMTM spectra.

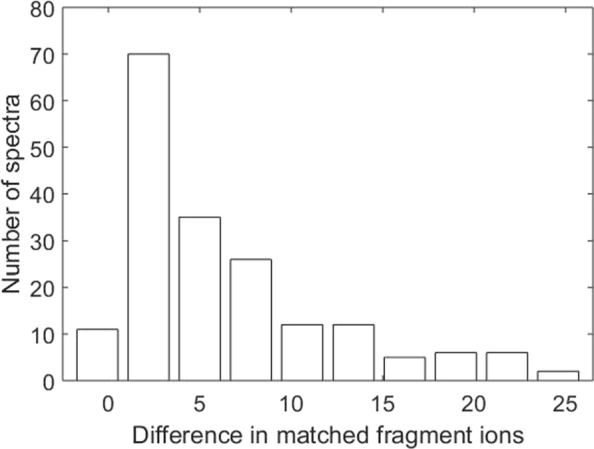
Conclusions: Experiments on a top-down mass spectrometry data set of the histone H4 protein showed that the proposed method identified many proteoform pairs that better explain the query spectra than single proteoforms.

Keywords: Graph algorithms; Mass spectrometry; Multiplexed mass spectra; Top-down.


Conflict of interest statement

Ethics approval and consent to participate

Not applicable.

Consent for publication

Not applicable.

Competing interests

The authors declare that they have no competing interests.

Publisher’s Note

Springer Nature remains neutral with regard to jurisdictional claims in published maps and institutional affiliations.

Figures

Fig. 1
Fig. 1
Illustration of the conversion from the HomMTM spectral identification problem to the MSkSF problem. A deconvoluted HomMTM spectrum generated from two modified proteoforms of the protein GKGKLKAKE with one expected PTM: acetylation on K, is used as an example. a Each peak corresponds to a potential prefix residue mass of a proteoform of GKGKLKAKE satisfying that the prefix residue mass or its complementary suffix residue mass matches an experimental fragment mass. Potential masses for the prefix GKGKL matched to experimental masses are shown in the red dotted box. b A graph with 10 layers is constructed based on the masses in P0,P1,,P10 and the peaks in (a). Each vertex in layer i, 0≤i≤10, corresponds to a mass in Pi and those with dotted circles are removed because they are not on any path from the source to the sink. The capacity of a vertex is the ratio (shown in percentage) between the intensity of the mass and the sum of the intensities of all masses corresponding to vertices with solid circles in the same layer. The solution to the MSkSF problem is the two blue paths with flows 70 and 30 (in percentage), which correspond to two proteoforms GK[Acetylation]GK[Acetylation]LKAKE with relative abundance 70% and GKGK[Acetylation]LK[Acetylation]AKE with relative abundance 30%
Fig. 2
Fig. 2
Comparison of the numbers of matched fragment ions. The numbers of matched fragment ions are compared for the 184 spectra identified by both the proposed method and MS-Align-E. For each spectrum, the difference between the number of fragment ions matched to the proteoform pair reported by the proposed method and that matched to the single proteoform reported by MS-Align-E is computed
Fig. 3
Fig. 3
The sizes of graphs used in HomMTM spectral interpretation. The numbers of vertices and edges in the graph generated from the histone H4 protein and five PTMs (acetylation, methylation, dimethylation, trimethylation, phosphorylation) increase significantly when the bound for the sum of mass shifts introduced by PTMs increases from 50 Da to 600 Da

Similar articles

Cited by

References

    1. DiMaggio Jr PA, Young NL, Baliban RC, Garcia BA, Floudas CA. A mixed integer linear optimization framework for the identification and quantification of targeted post-translational modifications of highly modified proteins using multiplexed electron transfer dissociation tandem mass spectrometry. Mol Cell Proteomics. 2009;8:2527–43. doi: 10.1074/mcp.M900144-MCP200. - DOI - PMC - PubMed
    1. Wang J, Perez-Santiago J, Katz JE, Mallick P, Bandeira N. Peptide identification from mixture tandem mass spectra. Mol Cell Proteomics. 2010;9:1476–85. doi: 10.1074/mcp.M000136-MCP201. - DOI - PMC - PubMed
    1. Wang J, Bourne PE, Bandeira N. MixGF: spectral probabilities for mixture spectra from more than one peptide. Mol Cell Proteomics. 2014;13:3688–97. doi: 10.1074/mcp.O113.037218. - DOI - PMC - PubMed
    1. Cosgrove MS, Wolberger C. How does the histone code work? Biochem Cell Biol. 2005;83:468–76. doi: 10.1139/o05-137. - DOI - PubMed
    1. Strahl BD, Allis CD. The language of covalent histone modifications. Nature. 2000;403:41–5. doi: 10.1038/47412. - DOI - PubMed