

Wheat Bax Inhibitor-1 interacts with TaFKBP62 and mediates response to heat stress
- PMID: 30367612
- PMCID: PMC6204060
- DOI: 10.1186/s12870-018-1485-0
Wheat Bax Inhibitor-1 interacts with TaFKBP62 and mediates response to heat stress
Abstract
Background: Heat stress is a severe environmental stress that affects plant growth and reduces yield. Bax inhibitor-1 (BI-1) is a cytoprotective protein that is involved in the response to biotic and abiotic stresses. The Arabidopsis (Arabidopsis thaliana) BI-1 mutants atbi1-1 and atbi1-2 are hypersensitive to heat stress, and AtBI-1 overexpression rescues thermotolerance deficiency in atbi1 plants. Nevertheless, the mechanism of BI-1 in plant thermotolerance is still unclear.
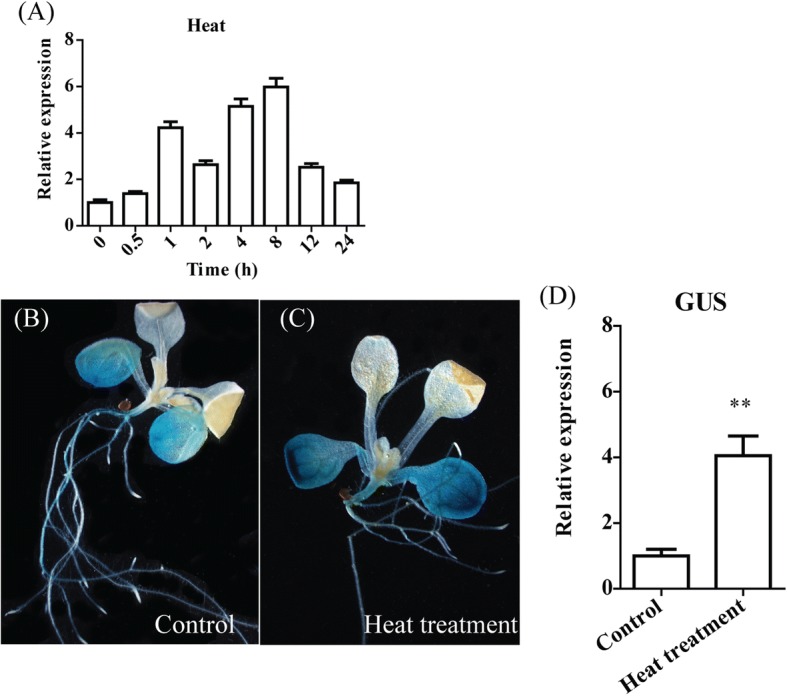
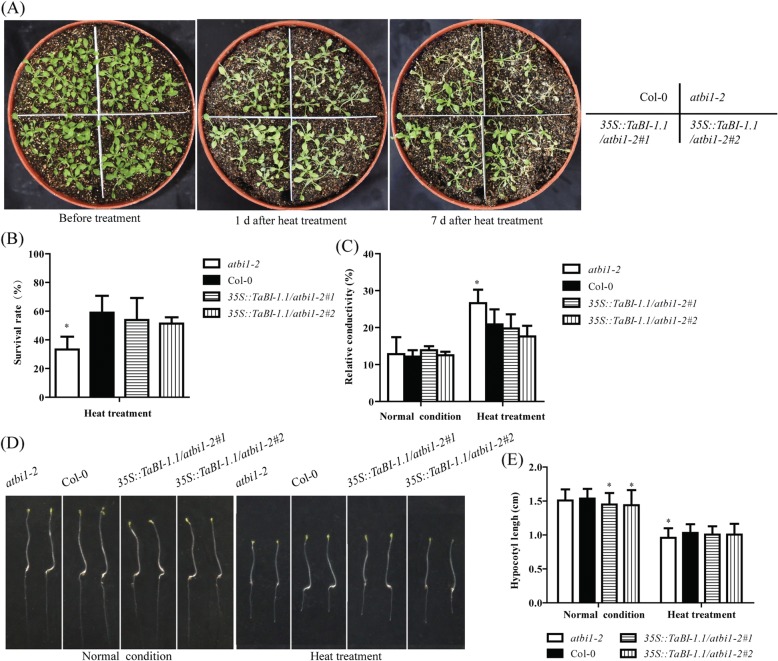
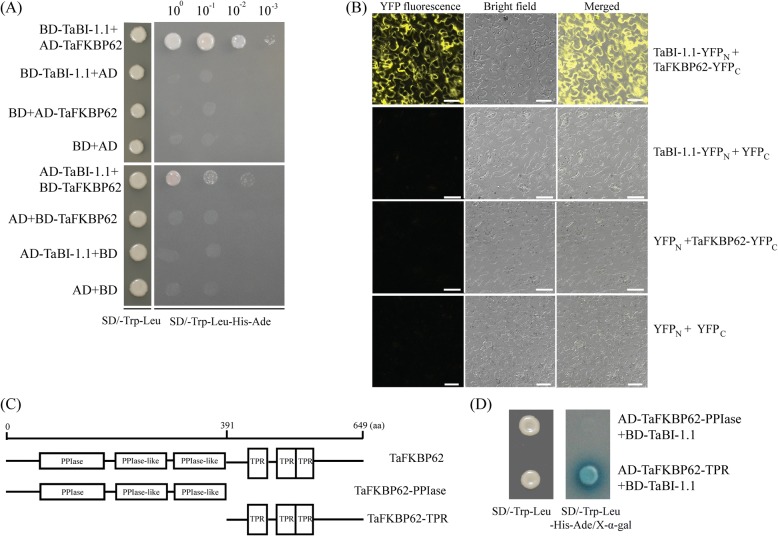
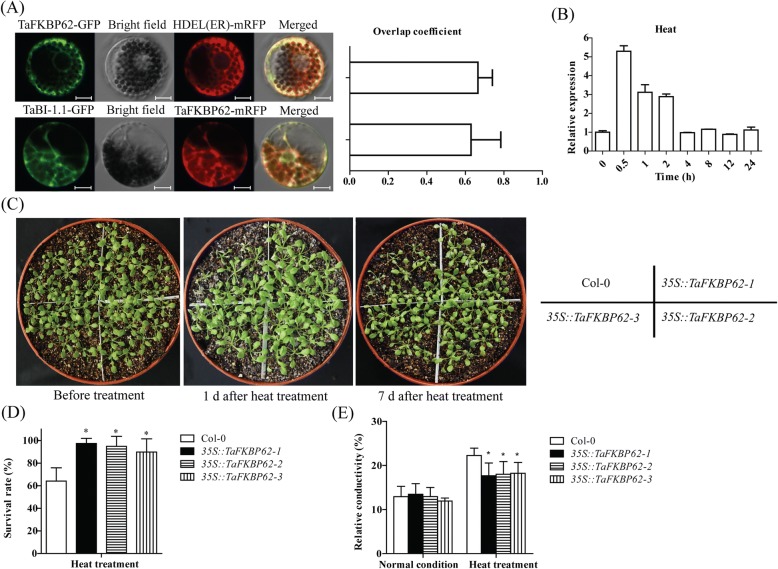
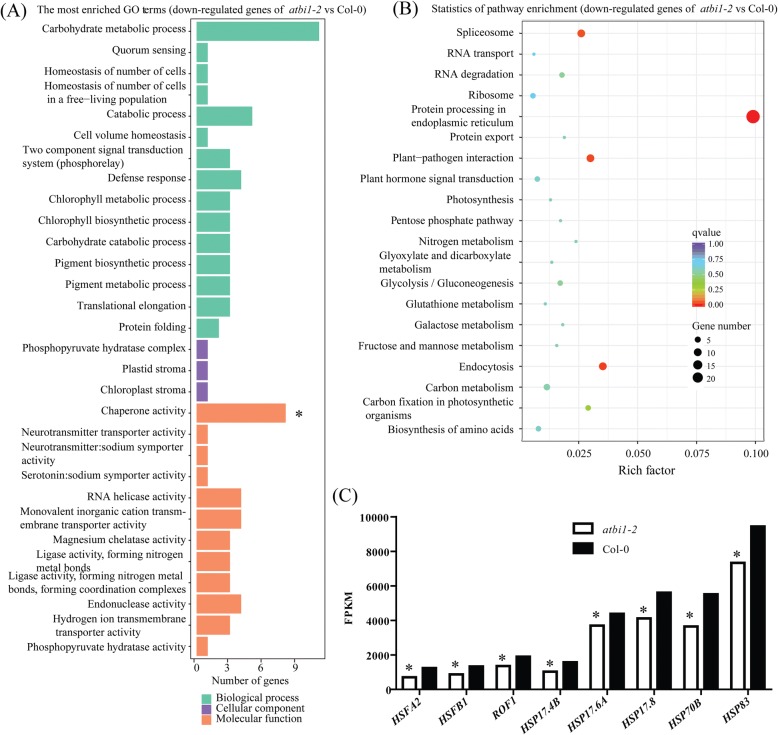
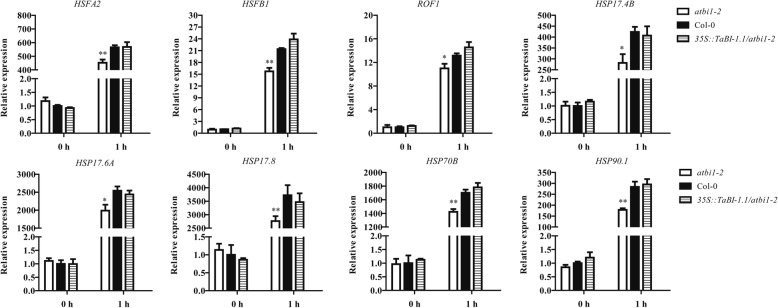
Results: We identified a wheat (Triticum aestivum L.) BI-1 gene, TaBI-1.1, which was highly upregulated in an RNA sequencing (RNA-seq) analysis of heat-treated wheat. The upregulation of TaBI-1.1 under heat stress was further demonstrated by real time quantitative PCR (qRT-PCR) and β-glucuronidase (GUS) staining. Compared with the wild type Col-0, the atbi1-2 mutant is hypersensitive to heat stress, and constitutive expression of TaBI-1.1 in atbi1-2 (35S::TaBI-1.1/ atbi1-2) rescued the deficiency of atbi1-2 under heat stress. Furthermore, we identified TaFKBP62 as a TaBI-1.1-interacting protein that co-localized with TaBI-1.1 on the endoplasmic reticulum (ER) membrane and enhanced heat stress tolerance. Additionally, HSFA2, HSFB1, ROF1, HSP17.4B, HSP17.6A, HSP17.8, HSP70B, and HSP90.1 expression levels were suppressed in atbi1-2 plants under heat stress. In contrast, 35S::TaBI-1.1/atbi1-2 relieved the inhibitory effect of AtBI-1 loss of function.
Conclusions: TaBI-1.1 interacted with TaFKBP62 and co-localized with TaFKBP62 on the ER membrane. Both TaBI-1.1 and AtBI-1 regulated the expression of heat-responsive genes and were conserved in plant thermotolerance.
Keywords: Bax inhibitor-1; Heat stress; Heat-responsive genes; RNA-seq; TaFKBP62.
Conflict of interest statement
Ethics approval and consent to participate
Not applicable.
Consent for publication
Not applicable.
Competing interests
The authors declare that they have no competing interests.
Publisher’s Note
Springer Nature remains neutral with regard to jurisdictional claims in published maps and institutional affiliations.
Figures
Similar articles
-
The Wheat Bax Inhibitor-1 Protein Interacts with an Aquaporin TaPIP1 and Enhances Disease Resistance in Arabidopsis.Front Plant Sci. 2018 Jan 22;9:20. doi: 10.3389/fpls.2018.00020. eCollection 2018. Front Plant Sci. 2018. PMID: 29403525 Free PMC article.
-
The heat responsive wheat TaRAD23 rescues developmental and thermotolerant defects of the rad23b mutant in Arabidopsis thaliana.Plant Sci. 2018 Sep;274:23-31. doi: 10.1016/j.plantsci.2018.04.028. Epub 2018 May 3. Plant Sci. 2018. PMID: 30080608 Review.
-
Unconventional splicing of wheat TabZIP60 confers heat tolerance in transgenic Arabidopsis.Plant Sci. 2018 Sep;274:252-260. doi: 10.1016/j.plantsci.2018.05.029. Epub 2018 May 29. Plant Sci. 2018. PMID: 30080611
-
Arabidopsis Bax inhibitor-1 functions as an attenuator of biotic and abiotic types of cell death.Plant J. 2006 Mar;45(6):884-94. doi: 10.1111/j.1365-313X.2006.02654.x. Plant J. 2006. PMID: 16507080
-
Can wheat survive in heat? Assembling tools towards successful development of heat stress tolerance in Triticum aestivum L.Mol Biol Rep. 2019 Apr;46(2):2577-2593. doi: 10.1007/s11033-019-04686-x. Epub 2019 Feb 13. Mol Biol Rep. 2019. PMID: 30758807 Review.
Cited by
-
Assessing the Heat Tolerance of Meiosis in Spanish Landraces of Tetraploid Wheat Triticum turgidum.Plants (Basel). 2022 Jun 23;11(13):1661. doi: 10.3390/plants11131661. Plants (Basel). 2022. PMID: 35807613 Free PMC article.
-
Differential responses of anthers of stress tolerant and sensitive wheat cultivars to high temperature stress.Planta. 2021 Jun 15;254(1):4. doi: 10.1007/s00425-021-03656-7. Planta. 2021. PMID: 34131818
-
Fine mapping of a QTL and identification of candidate genes associated with cold tolerance during germination in peanut (Arachis hypogaea L.) on chromosome B09 using whole genome re-sequencing.Front Plant Sci. 2023 May 8;14:1153293. doi: 10.3389/fpls.2023.1153293. eCollection 2023. Front Plant Sci. 2023. PMID: 37223785 Free PMC article.
-
Physiological and gene expression responses involved in teak (Tectona grandis L.) seedlings exposed to osmotic and salt stressors.Mol Biol Rep. 2023 Jun;50(6):4875-4886. doi: 10.1007/s11033-023-08437-x. Epub 2023 Apr 15. Mol Biol Rep. 2023. PMID: 37060520
-
Characterization of the Bax Inhibitor-1 Family in Cauliflower and Functional Analysis of BobBIL4.Int J Mol Sci. 2024 Sep 3;25(17):9562. doi: 10.3390/ijms25179562. Int J Mol Sci. 2024. PMID: 39273509 Free PMC article.
References
MeSH terms
Substances
Grants and funding
- 2018ZX0800909B/National Transgenic Key Project of the Ministry of Agriculture of China
- 2016ZX08002-002/National Transgenic Key Project of the Ministry of Agriculture of China
- 2014YB079/Fundamental Research Funds for the Central Universities
- 2016YFD0100600/National Key Research and Development Program of China
LinkOut - more resources
Full Text Sources
Research Materials
