

Effects of sugarcane aphid herbivory on transcriptional responses of resistant and susceptible sorghum
- PMID: 30367619
- PMCID: PMC6204049
- DOI: 10.1186/s12864-018-5095-x
Effects of sugarcane aphid herbivory on transcriptional responses of resistant and susceptible sorghum
Abstract
Background: Sugarcane aphid (Melanaphis sacchari) outbreaks in sorghum that were first reported in 2013 are now the most significant threat to this crop in all major sorghum production areas in the U.S. The outcomes of interactions between sugarcane aphid and sorghum and thus the severity of the outbreaks depend on sorghum genotype and potentially also on the phenology of sorghum. Mechanisms underlying these interactions are not known, however. Thus, the goal of this research was to characterize transcriptional changes in a commercially available resistant and a susceptible genotype of sorghum at 2- and 6-wk post-emergence exposed to M. sacchari herbivory. The effects of sorghum age and genotype on the daily change in aphid densities were also evaluated in separate greenhouse experiments.
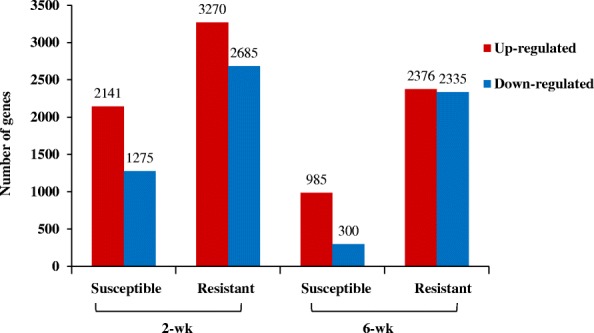
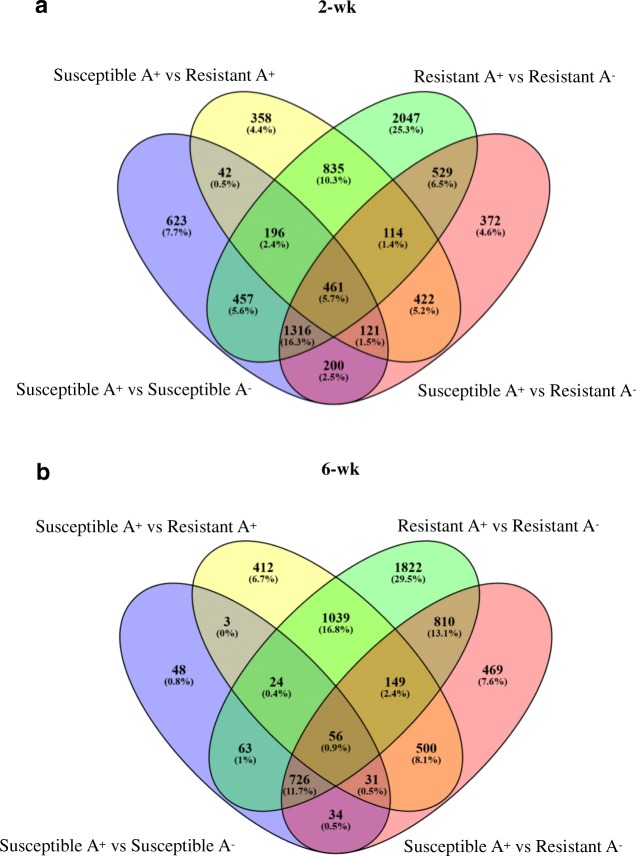
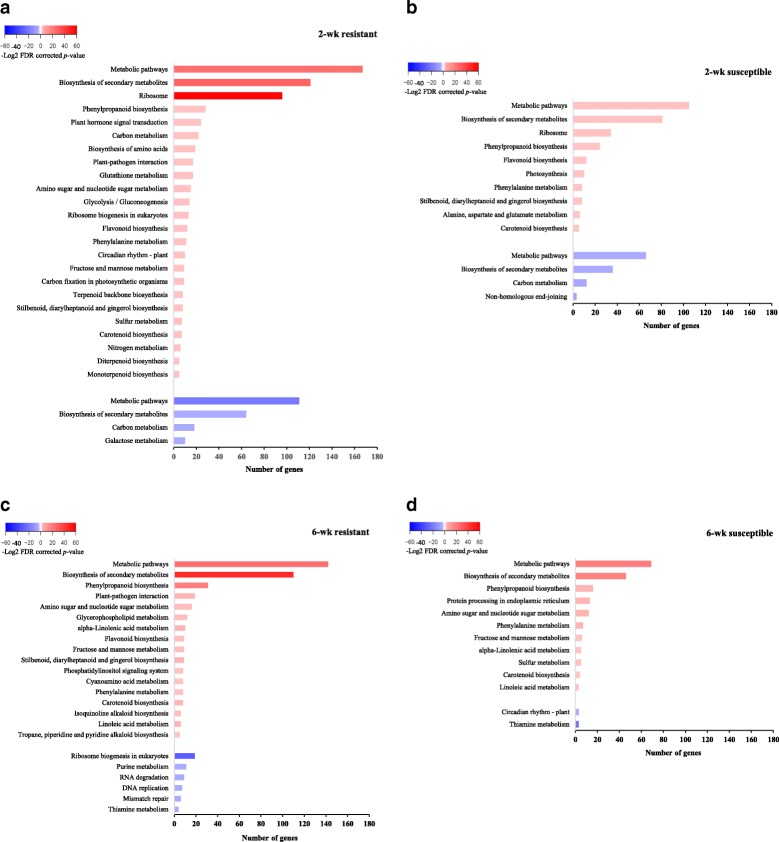
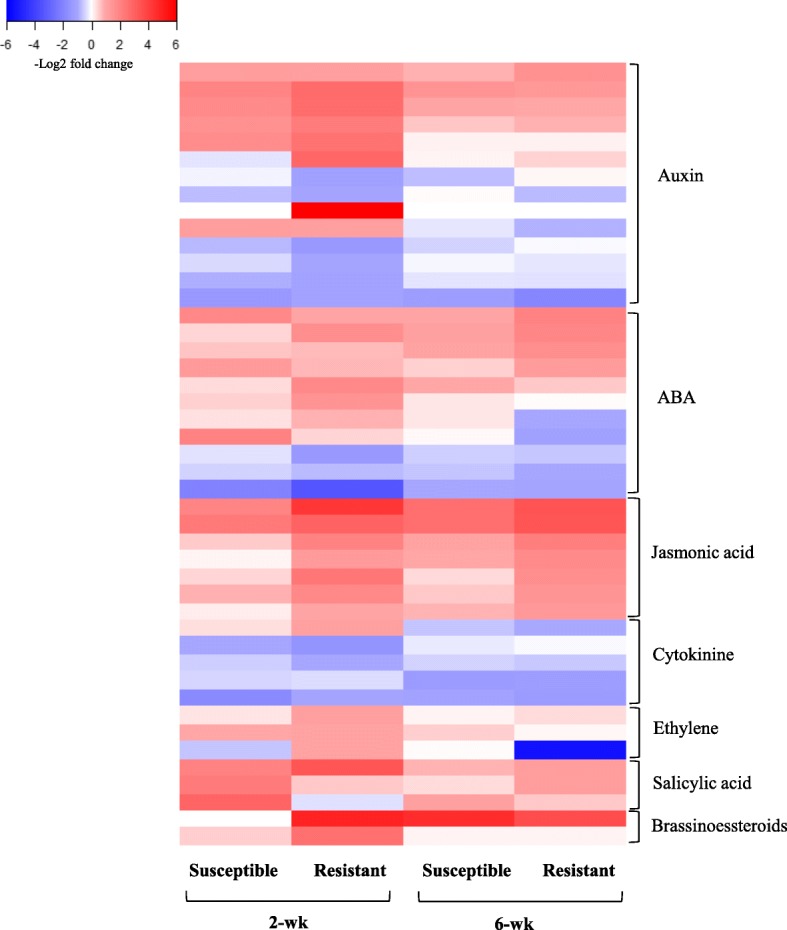
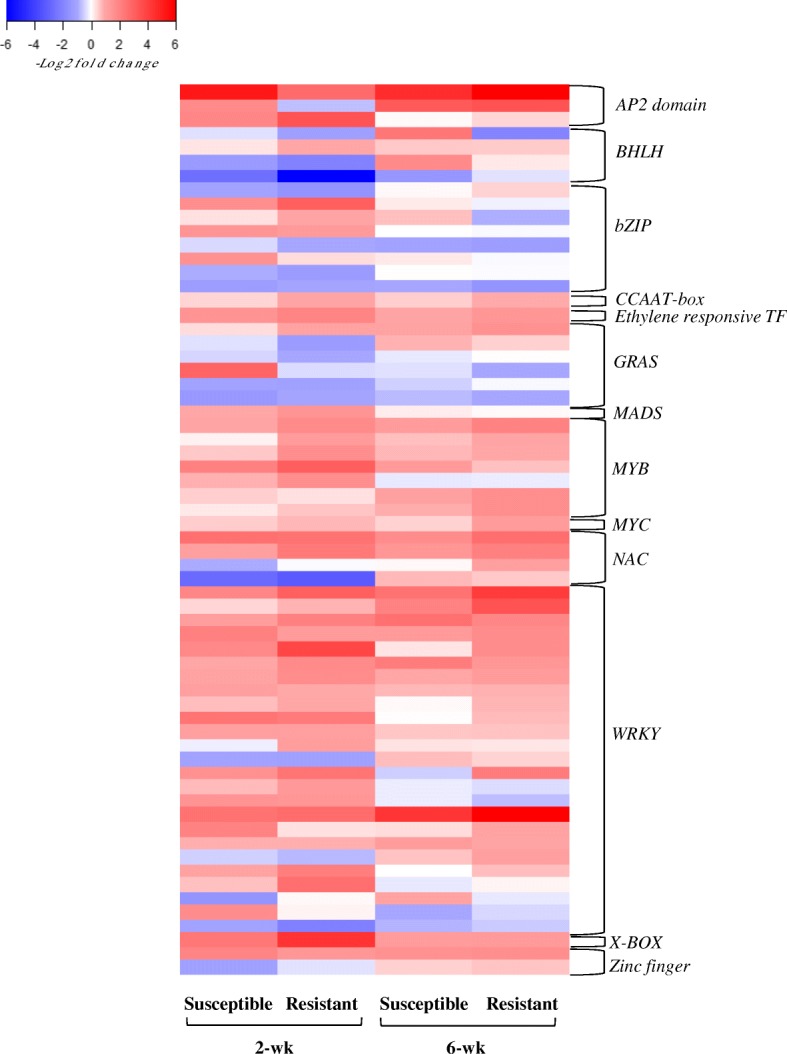
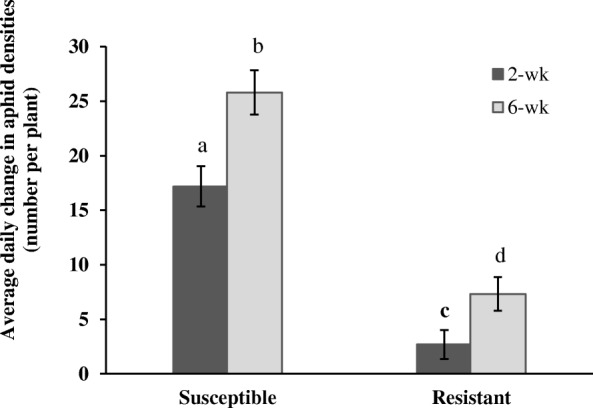
Results: A higher number of diffentially expressed genes (DEGs) was recovered from the 2-wk plants exposed to aphid herbivory compared to the 6-wk plants across genotypes. Further, gene ontology and pathway analysis indicated a suite of transcriptional changes in the resistant genotype that were weak or absent in the susceptible sorghum. Specifically, the aphid-resistant genotype exposed to M. sacchari up-regulated several genes involved in defense, which was particularly evident in the 2-wk plants that showed the most robust transcriptional responses. These transcriptional changes in the younger resistant sorghum were characterized by induction of hormone-signaling pathways, pathways coding for secondary metabolites, glutathion metabolism, and plant-pathogen interaction. Furthermore, the 2-wk resistant plants appeared to compensate for the effects of oxidative stress induced by sugarcane aphid herbivory with elevated expression of genes involved in detoxification. These transcriptional responses were reflected in the aphid population growth, which was significantly faster in the susceptible and older sorghum than in the resistant and younger plants.
Conclusion: This experiment provided the first insights into molecular mechanisms underlying lower population growth of M. sacchari on the resistant sorghum genotype. Further, it appears that the younger resistant sorghum was able to mount a robust defense response following aphid herbivory, which was much weaker in the older sorghum. Several pathways and specific genes provide specific clues into the mechanisms underlying host plant resistance to this invasive insect.
Keywords: Melanaphis sacchari; Plant defenses; Plant-insect interaction; RNA-seq; Sorghum bicolor.
Conflict of interest statement
Ethics approval and consent to participate
Not applicable.
Consent for publication
Not applicable.
Competing interests
The authors declare that they have no competing interests.
Publisher’s Note
Springer Nature remains neutral with regard to jurisdictional claims in published maps and institutional affiliations.
Figures


Similar articles
-
Comparative Transcriptome Analysis Reveals Genetic Mechanisms of Sugarcane Aphid Resistance in Grain Sorghum.Int J Mol Sci. 2021 Jul 1;22(13):7129. doi: 10.3390/ijms22137129. Int J Mol Sci. 2021. PMID: 34281180 Free PMC article.
-
Global Responses of Resistant and Susceptible Sorghum (Sorghum bicolor) to Sugarcane Aphid (Melanaphis sacchari).Front Plant Sci. 2019 Feb 22;10:145. doi: 10.3389/fpls.2019.00145. eCollection 2019. Front Plant Sci. 2019. PMID: 30853964 Free PMC article.
-
Elevated production of reactive oxygen species is related to host plant resistance to sugarcane aphid in sorghum.Plant Signal Behav. 2021 Feb 1;16(2):1849523. doi: 10.1080/15592324.2020.1849523. Epub 2020 Dec 3. Plant Signal Behav. 2021. PMID: 33270502 Free PMC article.
-
Melanaphis sacchari/sorghi complex: current status, challenges and integrated strategies for managing the invasive sap-feeding insect pest of sorghum.Pest Manag Sci. 2025 May;81(5):2427-2441. doi: 10.1002/ps.8291. Epub 2024 Jul 13. Pest Manag Sci. 2025. PMID: 39001705 Free PMC article. Review.
-
Mechanisms and evolution of plant resistance to aphids.Nat Plants. 2016 Jan 6;2:15206. doi: 10.1038/nplants.2015.206. Nat Plants. 2016. PMID: 27250753 Review.
Cited by
-
Transcriptome Sequence Analysis of the Defense Responses of Resistant and Susceptible Cucumber Strains to Podosphaera xanthii.Front Plant Sci. 2022 May 12;13:872218. doi: 10.3389/fpls.2022.872218. eCollection 2022. Front Plant Sci. 2022. PMID: 35645993 Free PMC article.
-
The Effects of High CO2 and Strigolactones on Shoot Branching and Aphid-Plant Compatibility Control in Pea.Int J Mol Sci. 2022 Oct 12;23(20):12160. doi: 10.3390/ijms232012160. Int J Mol Sci. 2022. PMID: 36293014 Free PMC article.
-
Transcriptomic and metabolomic changes triggered by Macrosiphum rosivorum in rose (Rosa longicuspis).BMC Genomics. 2021 Dec 9;22(1):885. doi: 10.1186/s12864-021-08198-6. BMC Genomics. 2021. PMID: 34886808 Free PMC article.
-
Transcriptional Responses of Resistant and Susceptible Wheat Exposed to Wheat Curl Mite.Int J Mol Sci. 2021 Mar 8;22(5):2703. doi: 10.3390/ijms22052703. Int J Mol Sci. 2021. PMID: 33800120 Free PMC article.
-
Plant Genes Benefitting Aphids-Potential for Exploitation in Resistance Breeding.Front Plant Sci. 2019 Nov 13;10:1452. doi: 10.3389/fpls.2019.01452. eCollection 2019. Front Plant Sci. 2019. PMID: 31798609 Free PMC article. Review.
References
-
- Walling LL. The myriad plant responses to herbivores. J Plant Growth Regul. 2000;19(2):195–216. - PubMed
-
- Howe GA, Jander G. Plant immunity to insect herbivores. Annu Rev Plant Biol. 2008;59:41–66. - PubMed
-
- Wu J, Baldwin IT. New insights into plant responses to the attack from insect herbivores. Annu Rev Genet. 2010;44:1–24. - PubMed
-
- Foyer CH, Rasool B, Davey JW, Hancock RD. Cross-tolerance to biotic and abiotic stresses in plants: a focus on resistance to aphid infestation. J Exp Bot. 2016;67(7):2025–2037. - PubMed
MeSH terms
Grants and funding
LinkOut - more resources
Full Text Sources
