. 2018 Oct 26;13(1):188.
doi: 10.1186/s13023-018-0912-5.

White matter microstructural damage in early treated phenylketonuric patients

Affiliations

White matter microstructural damage in early treated phenylketonuric patients

María Julieta González et al. Orphanet J Rare Dis. .

Abstract

Background: Despite dietary intervention, individuals with early treated phenylketonuria (ETPKU) could present neurocognitive deficits and white matter (WM) abnormalities. The aim of the present study was to evaluate the microstructural integrity of WM pathways across the whole brain in a cohort of paediatric ETPKU patients compared with healthy controls (HCs), by collecting DTI-MRI (diffusion tensor magnetic resonance imaging) data and diffusion values (mean diffusivity (MD), radial diffusivity (RD) and fractional anisotropy (FA)).

Methods: DTI-MRI data and diffusion values (MD, RD, FA) from WM tracts across the whole brain were analized using Tract Based Spatial Statistics (TBSS), in 15 paediatrics TPKU patients (median age: 12 years) and compared with 11 HCs. Areas showing abnormal values in the patient group were correlated (Pearson) with age, lifetime Phe values, last year median and mean Phe, concurrent Phe values in plasma, urine neurotransmitters status biomarkers, and with a processing speed task.

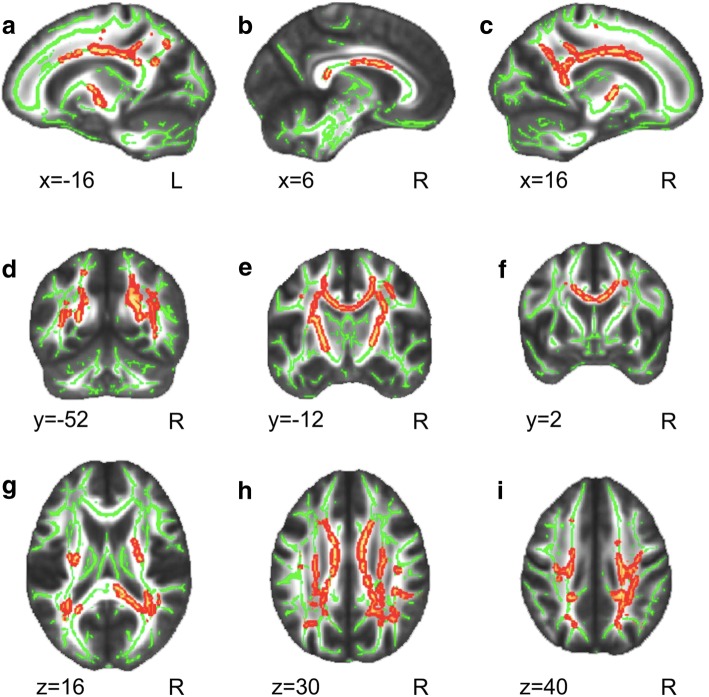
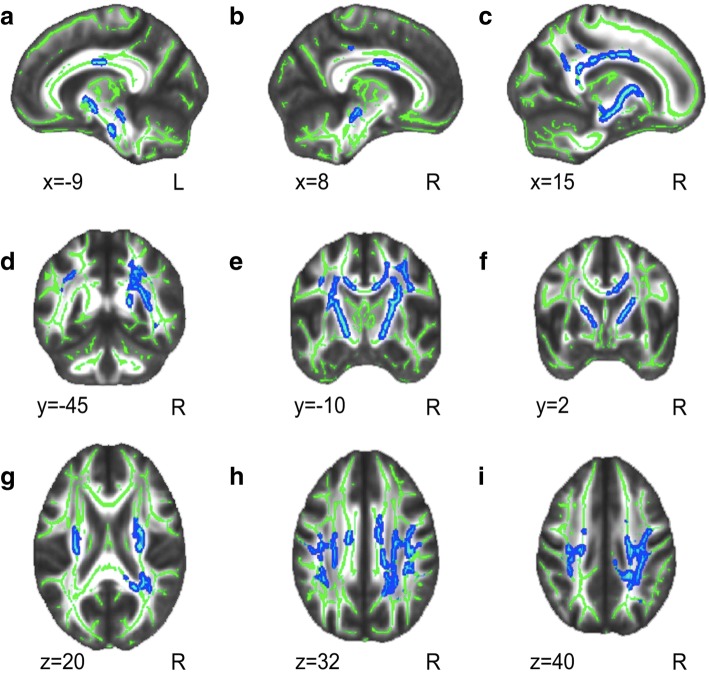
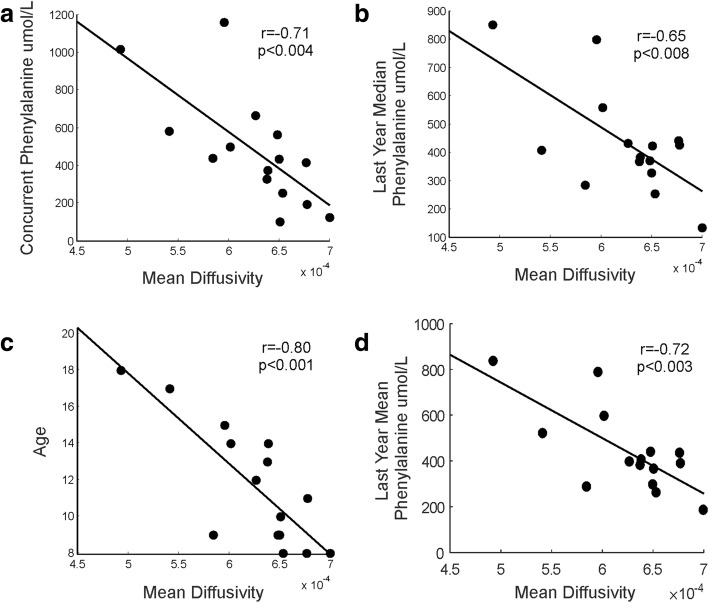
Results: ETPKU showed bilaterally decreased MD values compared with HCs in the body and splenium of the corpus callosum, superior longitudinal fasciculus, corona radiata and in the posterior limb of the internal capsule. RD values followed a similar pattern, although decreased RD values in PKU patients were also found in the anterior limb of the internal capsule and in the cerebral peduncle. Decreased MD and RD values within the aforementioned regions had significant negative correlations with age, last year median and mean Phe and concurrent Phe values. No correlations were found with monoamines in urine or processing speed task.

Conclusions: ETPKU patients showed MD and RD values significantly decreased across the whole brain when compared with HCs, and this damage was associated with high Phe values and the age of patients. Despite this microstructural damage, no affectation in processing speed was observed in patients with good metabolic control. DTI-MRI sequences could be used as a technique to quantify WM damage that is difficult to be detect in T1 or T2-weighted images, but also to quantify damage of WM through the follow up of patients with poor metabolic control in prospective studies.

Keywords: Diffusion tensor imaging; Early treatment; Neuroimaging; Paediatric; Phenylketonuria; Urine monoamines.


Conflict of interest statement

Ethics approval and consent to participate

The study protocols and amendments were approved by local independent ethics committees (IECs). Written informed consent/assent was obtained from all parents/participants of the control group at the time of their visit. The studies were conducted in accordance with the principles of the Declaration of Helsinki, amended in 2013. Our hospital ethics committee approved the study.

Consent for publication

Not applicable.

Competing interests

The authors declare that they have no competing interests.

Publisher’s Note

Springer Nature remains neutral with regard to jurisdictional claims in published maps and institutional affiliations.

Figures

Fig. 1
Fig. 1
Decreased Mean Diffusivity values of WM tracts across the whole brain in PKU as compared with controls. a-i: Results are shown over the mean group skeleton (in green), which represents the centers of all WM tracts common to all participants in the study (see Materials and Methods). In red-yellow, the WM regions showing decreased MD in patients as compared with controls are shown (p < 0.05 FWE corrected). Neurological convention is used with MNI (Montreal Neurological Institute) coordinates at the left bottom of each slice
Fig. 2
Fig. 2
Decreased Radial Diffusivity values of WM tracts acress the whole brain in PKU as compared with controls. a-i: Results are shown over the mean group skeleton (in green), which represents the centers of all WM tracts common to all participants in the study (see Materials and Methods). In blue, the WM regions showing decreased RD in patients as compared with controls are shown (p < 0.05 FWE corrected). Neurological convention is used with MNI (Montreal Neurological Institute) coordinates at the left bottom of each slice
Fig. 3
Fig. 3
Correlations between the average Mean Diffusivity value of the WM pathways showing between-group differences and biochemical parameters and age. The scatter plots display: a The correlation between the mean MD value of the voxels and concurrent Phe. b The correlation between the mean MD value of the voxels and last year median. c The correlation between the mean MD value of the voxels and age. d The correlation between the mean MD value of the voxels and last year mean. The scatter plots display the correlation between the mean MD value of the voxels showing significant differences and concurrent Phe, last year median and mean Phe values and age (the greater the age/phenylalanine values the greater the reduction in MD)
Fig. 4
Fig. 4
Correlations between the average Radial Diffusivity value of the WM pathways showing between-group differences and biochemical parameters and age. The scatter plots display: a The correlation between the mean RD value of the voxels and concurrent Phe. b The correlation between the mean RD value of the voxels and last year median. c The correlation between the mean RD value of the voxels and age. d The correlation between the mean RD value of the voxels and last year mean. The scatter plots display the correlation between the mean RD value of the voxels showing significant differences and concurrent Phe, last year median and mean Phe values and age (the greater the age/phenylalanine values the greater the reduction in RD)

References

    1. Blau N, van Spronsen FJ, Levy HL. Phenylketonuria. Lancet. 2010;376(9750):1417–1427. doi: 10.1016/S0140-6736(10)60961-0. - DOI - PubMed
    1. Basser PJ, Mattiello J, LeBihan D. Estimation of the effective self-diffusion tensor from the NMR spin echo. J Magn Reson B. 1994;103(3):247–254. doi: 10.1006/jmrb.1994.1037. - DOI - PubMed
    1. Hüppi PS, Dubois J. Diffusion tensor imaging of brain development. Semin Fetal Neonatal Med. 2006;11(6):489–497. doi: 10.1016/j.siny.2006.07.006. - DOI - PubMed
    1. Yoshida S, Oishi K, Faria AV, Mori S. Diffusion tensor imaging of normal brain development. Pediatr Radiol. 2013;43(1):15–27. doi: 10.1007/s00247-012-2496-x. - DOI - PMC - PubMed
    1. Sen PN, Basser PJ. A model for diffusion in white matter in the brain. Biophys J. 2005;89(5):2927–2938. doi: 10.1529/biophysj.105.063016. - DOI - PMC - PubMed

Publication types