. 2018 Oct 26;6(1):193.
doi: 10.1186/s40168-018-0566-5.

Neonatal gut and respiratory microbiota: coordinated development through time and space

Affiliations

Neonatal gut and respiratory microbiota: coordinated development through time and space

Alex Grier et al. Microbiome. .

Abstract

Background: Postnatal development of early life microbiota influences immunity, metabolism, neurodevelopment, and infant health. Microbiome development occurs at multiple body sites, with distinct community compositions and functions. Associations between microbiota at multiple sites represent an unexplored influence on the infant microbiome. Here, we examined co-occurrence patterns of gut and respiratory microbiota in pre- and full-term infants over the first year of life, a period critical to neonatal development.

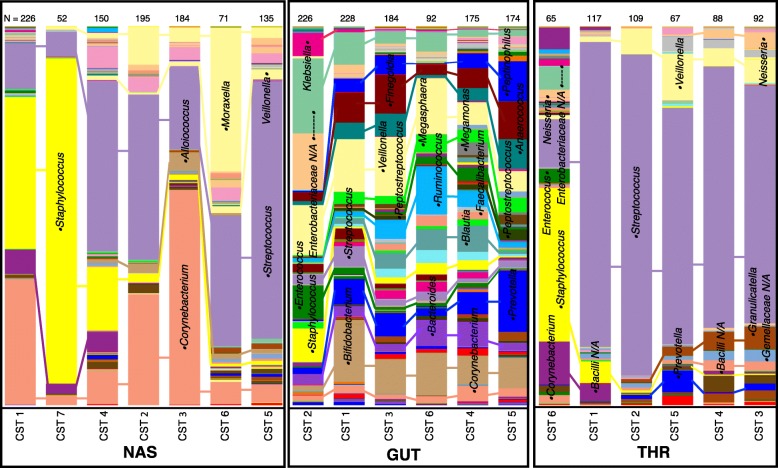
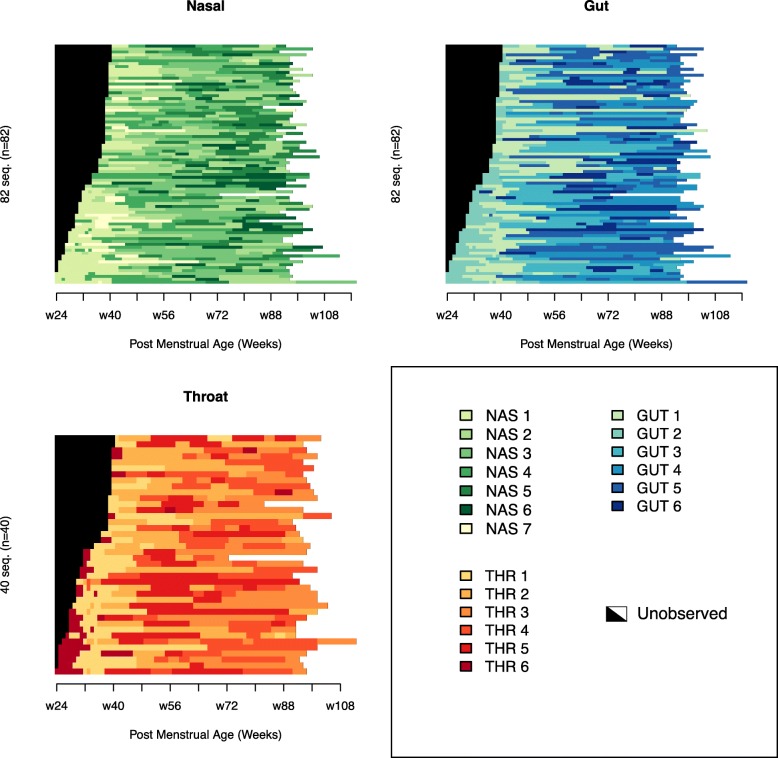
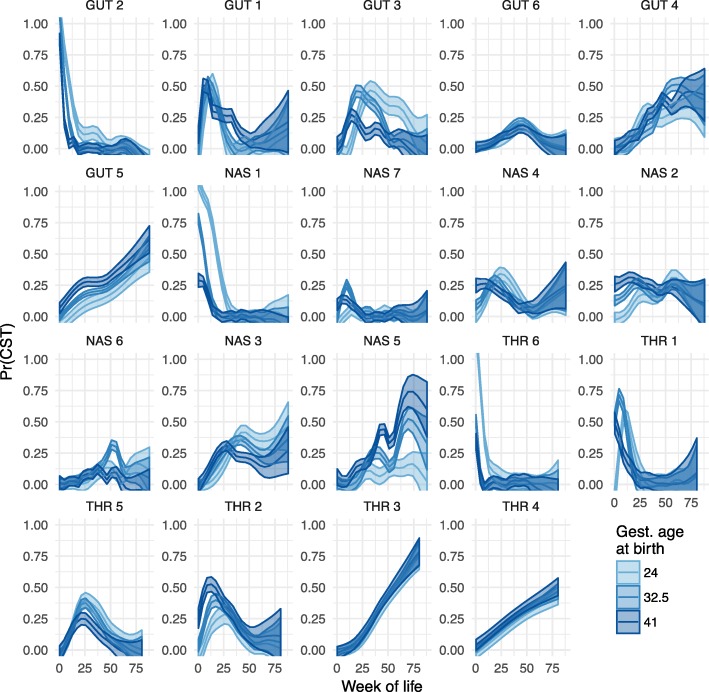
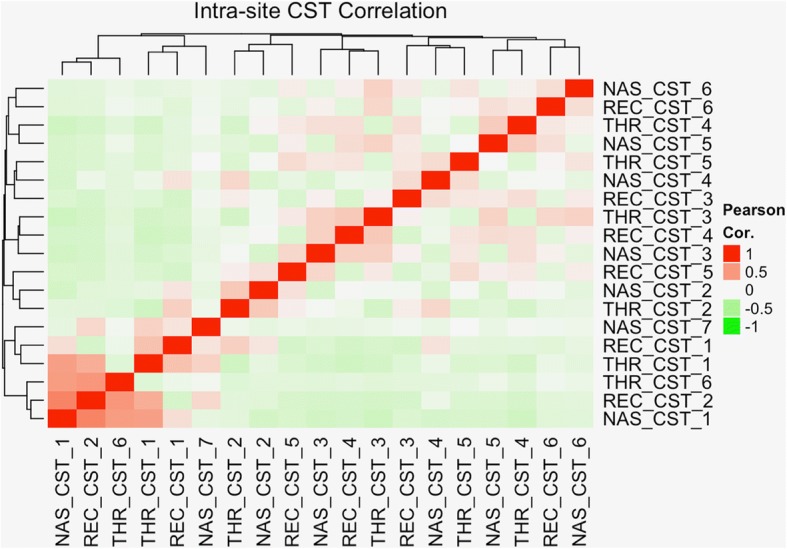
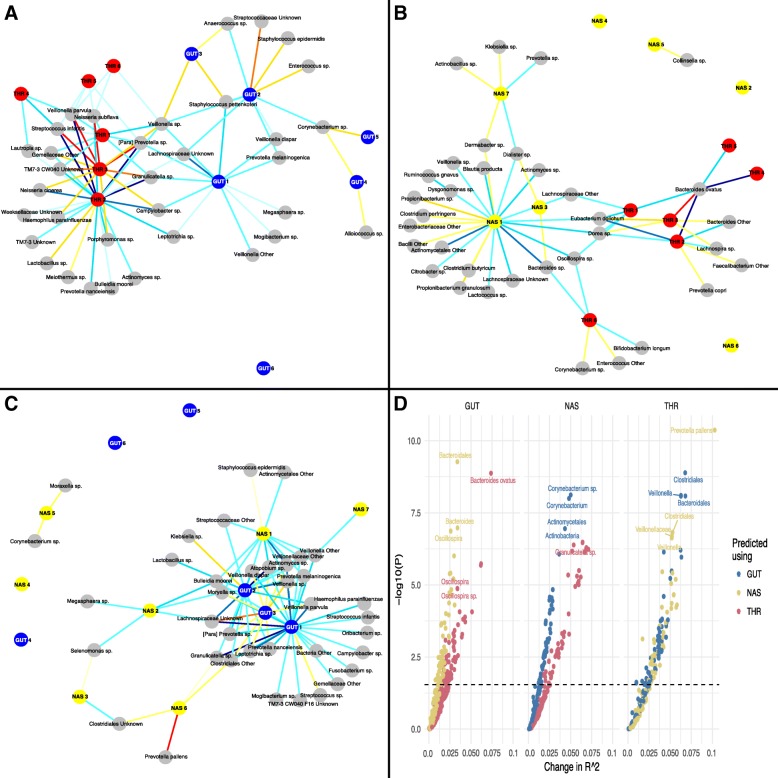
Results: Gut and respiratory microbiota collected as longitudinal rectal, throat, and nasal samples from 38 pre-term and 44 full-term infants were first clustered into community state types (CSTs) on the basis of their compositional profiles. Multiple methods were used to relate the occurrence of CSTs to temporal microbiota development and measures of infant maturity, including gestational age (GA) at birth, week of life (WOL), and post-menstrual age (PMA). Manifestation of CSTs followed one of three patterns with respect to infant maturity: (1) chronological, with CST occurrence frequency solely a function of post-natal age (WOL), (2) idiosyncratic to maturity at birth, with the interval of CST occurrence dependent on infant post-natal age but the frequency of occurrence dependent on GA at birth, and (3) convergent, in which CSTs appear first in infants of greater maturity at birth, with occurrence frequency in pre-terms converging after a post-natal interval proportional to pre-maturity. The composition of CSTs was highly dissimilar between different body sites, but the CST of any one body site was highly predictive of the CSTs at other body sites. There were significant associations between the abundance of individual taxa at each body site and the CSTs of the other body sites, which persisted after stringent control for the non-linear effects of infant maturity. Canonical correlations exist between the microbiota composition at each pair of body sites, with the strongest correlations between proximal locations.

Conclusion: These findings suggest that early microbiota is shaped by neonatal innate and adaptive developmental responses. Temporal progression of CST occurrence is influenced by infant maturity at birth and post-natal age. Significant associations of microbiota across body sites reveal distal connections and coordinated development of the infant microbial ecosystem.


Conflict of interest statement

Ethics approval and consent to participate

Written informed consent was obtained from parent or guardian of all participating infants. The institutional review board at the University of Rochester School of Medicine and Strong Memorial Hospital approved the study.

Consent for publication

Not applicable

Competing interests

The authors declare that they have no competing interests.

Publisher’s Note

Springer Nature remains neutral with regard to jurisdictional claims in published maps and institutional affiliations.

Figures

Fig. 1
Fig. 1
Composition of community state types (CSTs) of the nose (NAS), gut (GUT), and throat (THR). Average composition of each CST was identified by Dirichlet-Multinomial mixture (DMM) model-based clustering. Samples are grouped by the Dirichlet component that they represent, with each component corresponding to a CST, and the average composition of all samples in each CST group is represented. The CSTs in each site are ordered based on their occurrence over time (e.g., CST 2 is the earliest gut CST). The height of each bar is equal, indicating that all total abundances are normalized to a constant sum. The number of samples in each CST is included at the top of each bar. Within each bar, different colored bands correspond to different taxa, and the height of a given band is proportional to the average relative abundance of the corresponding taxon in the given CST. The top ten most abundant taxa within each body site are identified, with the closed circle flanking each taxa name positioned in the corresponding taxa in each bar. The composition of all samples is listed in Additional file 4: Table S1
Fig. 2
Fig. 2
Sequence index plots indicate the progression of community state types (CSTs) over time for each subject. Subjects are stratified along the y-axis and sorted in descending order by gestational age at birth. Post-menstrual age (PMA) in weeks is indicated along the x-axis. The period of sampling for each individual is colored, with colors indicating the observed CST in a given time period. The time point of each observation is rounded down to the week in which the sample was taken, and the surrounding period of time is colored according to the CST of the sample, with color changes occurring at the midpoint between consecutive samples in which different CSTs were observed. For each subject, the black region on the left indicates the period prior to birth and the white region on the right indicates the period after the last sample was taken. In all three body sites, strong temporal structure and ordered patterns of CST progression are evident. For example, CSTs 1, 2, and 6 are overrepresented during the period prior to 40 weeks PMA in the nose, gut, and throat, respectively
Fig. 3
Fig. 3
Associations between community state type membership and time. The posterior probability of membership to each CST (y-axis) is plotted over weeks of life (x-axis), estimated as a non-parametric function of week of life and gestational age at birth. The CSTs are sorted by post-menstrual age at which they achieve a maximal probability of occurrence
Fig. 4
Fig. 4
Pairwise correlations between community state types (CSTs) at different body sites. CSTs on the x- and y-axes are identified by body site nasal (NAS), throat (THR), gut (REC) and type. Each cell represents the Pearson sample correlation of CST membership probability across body sites in the same individual. Red-hued cells correspond to positive correlation coefficients. CST co-occurrence is non-independent with the CST of one body site highly predictive of the CSTs of the other two body sites
Fig. 5
Fig. 5
Significant associations between taxa abundance and community state type (CST) across body sites. A bipartite graph was used to visualize the associations between CSTs and taxa at a distal body site (nasal (a), gut (b),throat (c)), with significant associations at a false discovery rate (FDR) of 5%. Edges indicate significant associations with color marking the direction and significance of the effect (red: increase in abundance, blue: decrease in abundance). Color shade corresponds to the level of significance, with lighter colors being less significant. Nodes are positioned using a force-directed layout, which places taxa or CSTs with similar patterns of significant associations near each other while attempting to optimize readability and limit overlap. d Relationships between taxa abundance and CSTs was also visualized using a volcano plot, with improvement in explanatory power (R2) conferred by the inclusion of CSTs in the model on the x-axis and − log10 p values of the model improvement on the y-axis. With individual taxa in each body site as the outcome (subplots GUT, NAS, and THR), a linear regression model was fit using the with and without CSTs of the other body sites as covariates, controlling for gestational age at birth, day of life, mode of delivery, birth season, and subject-level random effects. Full models (including all CSTs) were tested against null models (excluding the CSTs of the other body sites in turn) with a series of F tests

References

    1. Cho I, Blaser MJ. The human microbiome: at the interface of health and disease. Nat Rev Genet. 2012;13(4):260–270. doi: 10.1038/nrg3182. - DOI - PMC - PubMed
    1. Backhed F. Host responses to the human microbiome. Nutr Rev. 2012;70(Suppl 1):S14–S17. doi: 10.1111/j.1753-4887.2012.00496.x. - DOI - PubMed
    1. La Rosa PS, et al. Patterned progression of bacterial populations in the premature infant gut. Proc Natl Acad Sci U S A. 2014;111(34):12522–12527. doi: 10.1073/pnas.1409497111. - DOI - PMC - PubMed
    1. White RA, et al. Novel developmental analyses identify longitudinal patterns of early gut microbiota that affect infant growth. PLoS Comput Biol. 2013;9(5):e1003042. doi: 10.1371/journal.pcbi.1003042. - DOI - PMC - PubMed
    1. Yatsunenko T, et al. Human gut microbiome viewed across age and geography. Nature. 2012;486(7402):222–227. doi: 10.1038/nature11053. - DOI - PMC - PubMed

Publication types