. 2019 Feb;97(2):162-184.
doi: 10.1002/jnr.24344. Epub 2018 Oct 27.

Neuronal extracellular microRNAs miR-124 and miR-9 mediate cell-cell communication between neurons and microglia

Affiliations

Neuronal extracellular microRNAs miR-124 and miR-9 mediate cell-cell communication between neurons and microglia

Tatyana Veremeyko et al. J Neurosci Res. 2019 Feb.

Abstract

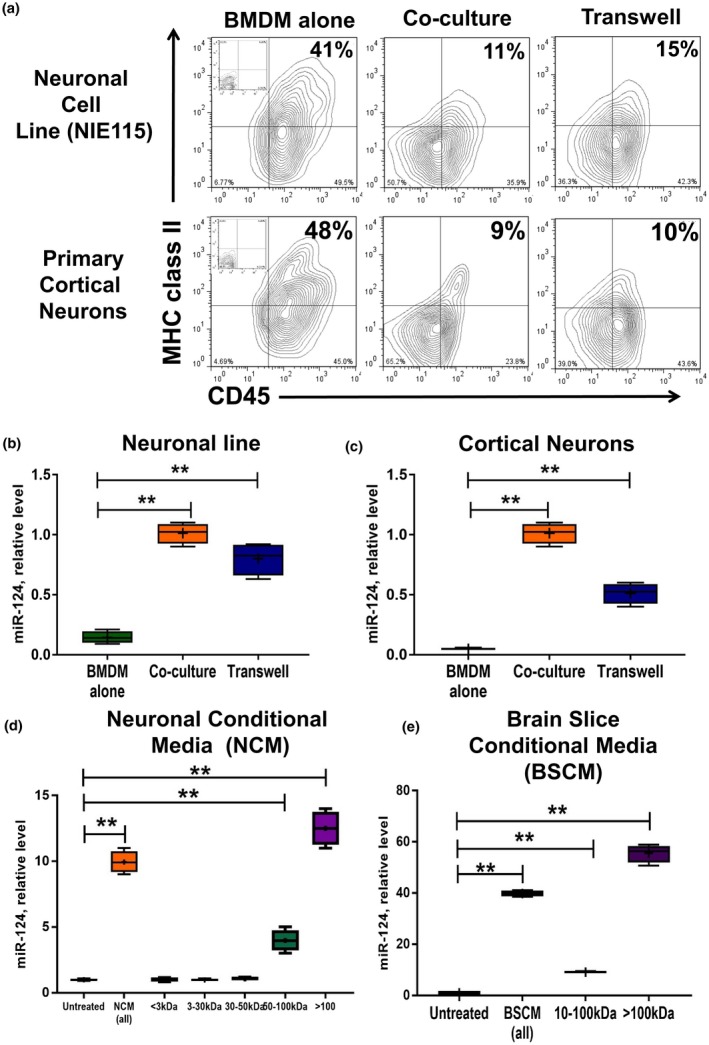
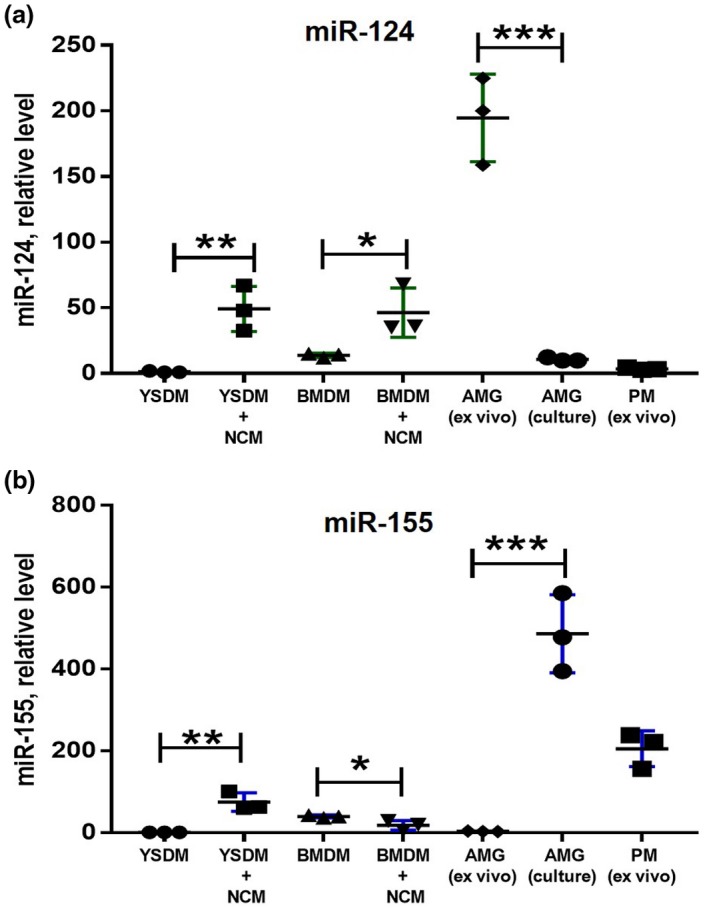
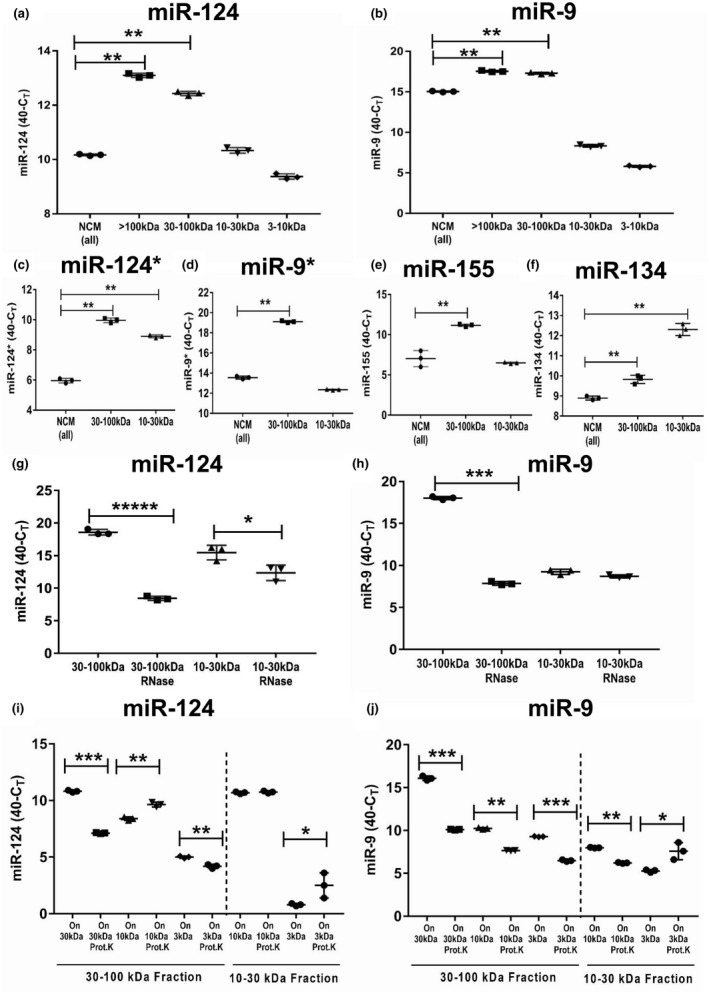
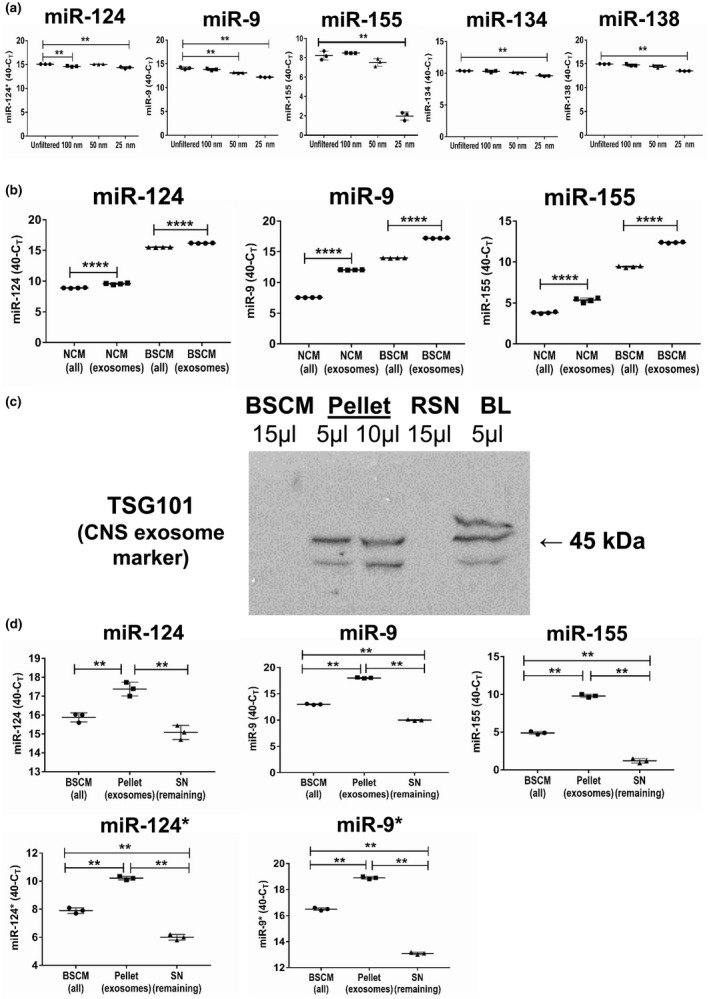
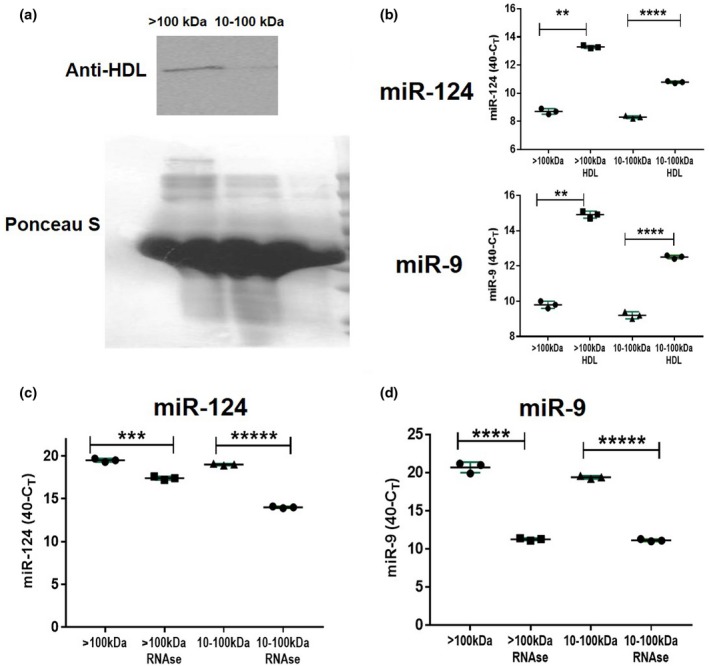
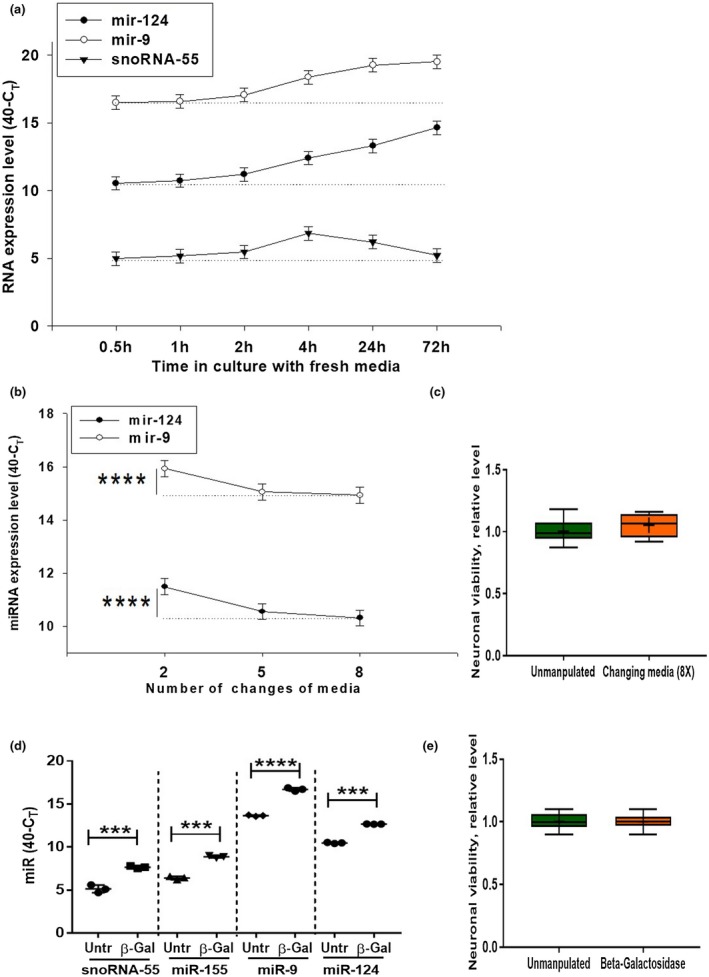
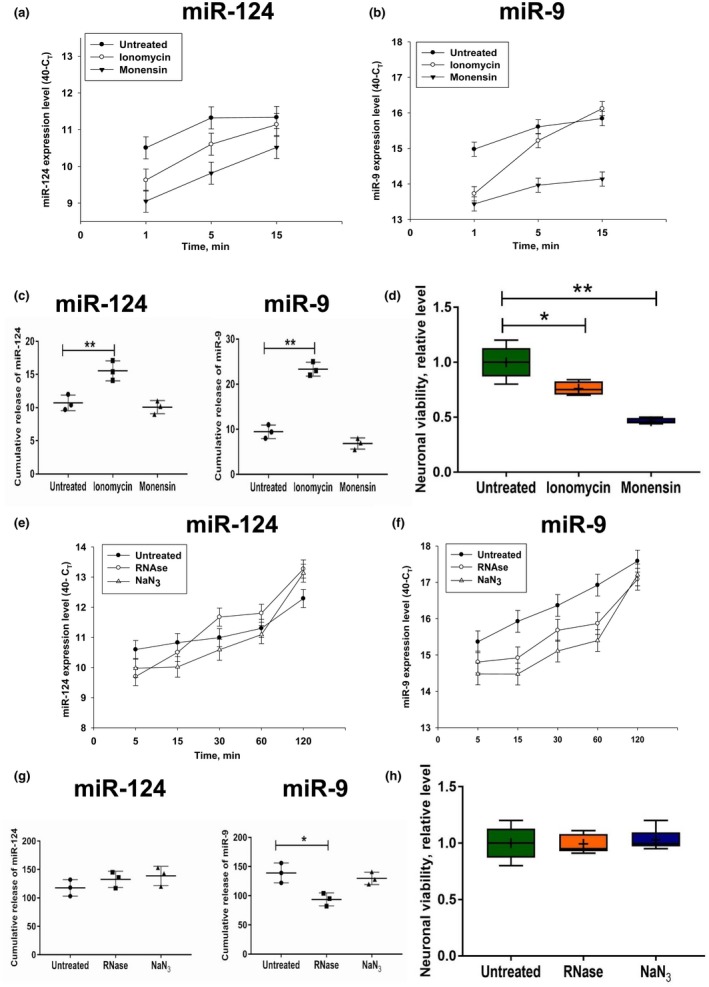
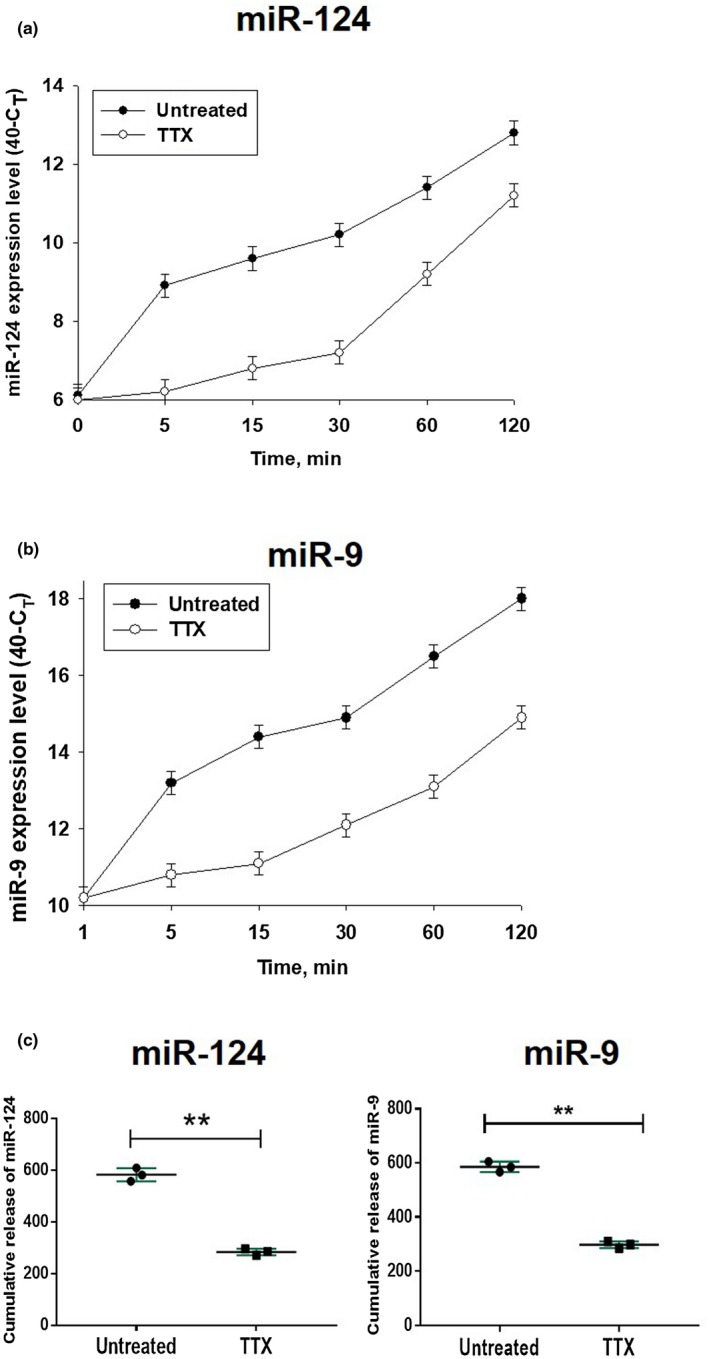
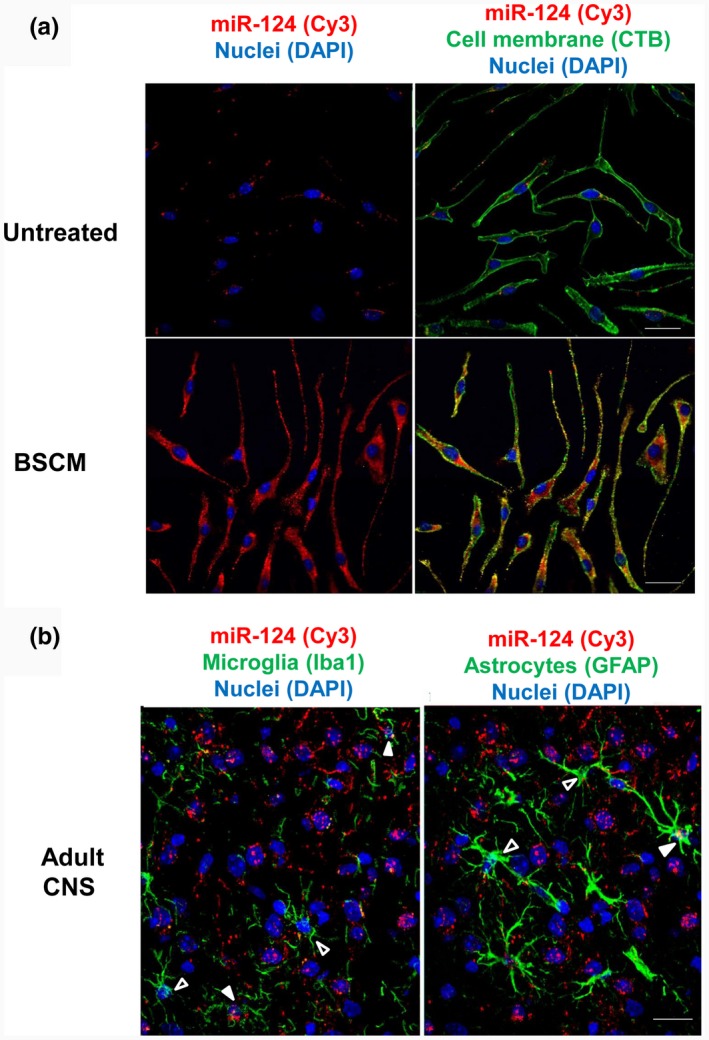
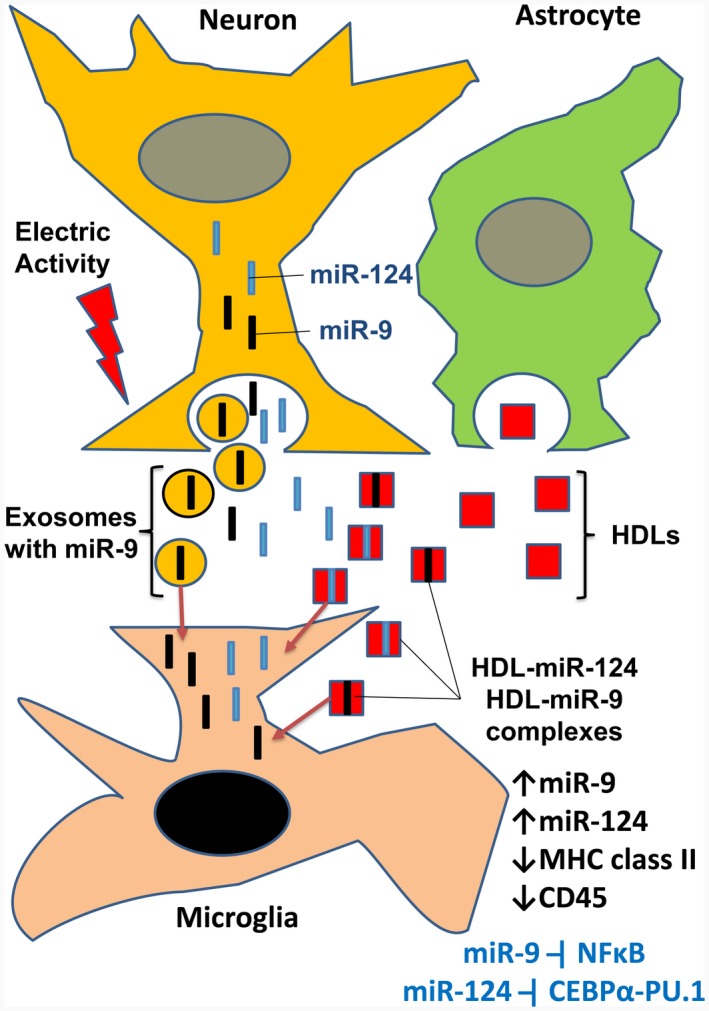
In contrast to peripheral macrophages, microglia in the central nervous system (CNS) exhibit a specific deactivated phenotype; however, it is not clear how this phenotype is maintained. Two alternative hypotheses were postulated recently: (a) microglia differ from peripheral macrophages being derived from the yolk sac (YS), whereas peripheral macrophages originate from bone marrow (BM); (b) microglia acquire a specific phenotype under the influence of the CNS microenvironment. We have previously shown that microglia express miR-124, which was also induced in BM-derived macrophages co-cultured with a neurons. We here investigated the possibility of horizontal transfer of the neuron-specific microRNAs miR-124 and miR-9 from primary neurons to microglia/macrophages. We found that after incubation with neuronal conditioned media (NCM), macrophages downregulated activation markers MHC class II and CD45. Neither cultured adult microglia nor YS- and BM-derived macrophages demonstrated intrinsic levels of miR-124 expression. However, after incubation with NCM, miR-124 was induced in both YS- and BM-derived macrophages. Biochemical analysis demonstrated that the NCM contained miR-124 and miR-9 in complex with small proteins, large high-density lipoproteins (HDLs), and exosomes. MiR-124 and miR-9 were promptly released from neurons, and this process was inhibited by tetrodotoxin, indicating an important role of neuronal electric activity in secretion of these microRNAs. Incubation of macrophages with exogenous miR-124 resulted in efficient translocation of miR-124 into the cytoplasm. This study demonstrates an important role of neuronal miRNAs in communication of neurons with microglia, which favors the hypothesis that microglia acquire a specific phenotype under the influence of the CNS microenvironment.

Keywords: HDL; extracellular miRNA; macrophages; miR-124; microglia.


Conflict of interest statement

The authors declare no conflicts of interest.

Figures

Figure 1
Figure 1
High molecular weight neuronal soluble factors induce downregulation of CD45 and MHC class II and upregulation of miR‐124 in macrophages. (a–c) Bone marrow‐derived macrophages (BMDMs) were obtained from DsRed transgenic mice as described in Materials and Methods and cultured alone (BMDMs alone), directly co‐cultured (co‐culture), or co‐cultured separately using a Transwell system (Transwell) with neuronal cell line (top contour plots and b) or primary cortical neurons (bottom contour plots and c) for 5 days and analyzed for the expression of DsRed, CD11b, CD45, and MHC class II using 4‐color cytometry. DsRed+CD11b+ gated macrophages were analyzed for the expression of CD45 (x‐axis) and MHC class II (y‐axis) (a), or FACS‐sorted DsRed+CD11b+ macrophages were used for isolation of RNA and analysis of miR‐124 expression by real‐time RT PCR as described in Materials and Methods (b, c). (d, e) Fractionation of neuronal conditioned medium (NCM) according to molecular weight and analysis of each fraction for the ability to induce expression of miR‐124 in macrophages. NCM (d) or brain slice conditioned medium (e; BSCM) were prepared and fractionated by size filtration as described in Materials and Methods. BMDMs were cultured alone in 50% neurobasal medium (untreated) or cultured in the presence of 50% non‐fractionated NCM (NCM‐all) or BSCM (BSCM‐all) or in fractionated NCM (<3; 3–30; 30–50; 50–100; >100 kDa) or BSCM (10–100; >100 kDa) for 4 hr and analyzed for miR‐124 expression by real‐time RT PCR as described in Materials and Methods. In (b–e), the median ± SD is shown on box and whisker plots (n = 4) with the mean value indicated by “+” symbol. The indicated differences were statistically significant as determined by one‐way ANOVA followed by Bonferroni post hoc test (**p < 0.01 for comparisons between two groups; b: F(2, 9) = 86.42, p < 0.0001; c: F(2, 9) = 190.3, p < 0.0001; d: F(6, 21) = 216.7, p < 0.0001; e: F(3, 12) = 775.6, p < 0.0001) [Colour figure can be viewed at wileyonlinelibrary.com]
Figure 2
Figure 2
Comparison of expression of miR‐124 and miR‐155 in bone marrow‐ and yolk sac‐derived macrophages under the influence of neuronal conditioned media. Bone marrow‐derived macrophages (BMDMs), yolk sac‐derived macrophages (YSDMs), or adult microglia were grown in the presence of M‐CSF as described in Materials and Methods. BMDMs and YSDMs were incubated in 50% neurobasal media (YSDM and BMDM) or 50% NCM (YSDM + NCM and BMDM + NCM) for 4 hr, and the expression levels of miR‐124 (a) and miR‐155 (b) were analyzed by real‐time RT PCR as described in Materials and Methods. The level of expression of miR‐124 and miR‐155 in YSDMs and BMDMs was compared to ex‐vivo isolated (AGM (ex vivo)) and cultured (AGM(culture)) adult microglia and ex‐vivo isolated peritoneal macrophages (PM (ex vivo)). In (a, b), mean ± SD of three separate experiments is shown on dotplots (n = 3; *p < 0.5; **p < 0.01; ***p < 0.001 as determined by unpaired Student's t test) [Colour figure can be viewed at wileyonlinelibrary.com]
Figure 3
Figure 3
Analysis of the level of expression, RNase sensitivity, and adsorption to proteins of neuronal microRNAs miR‐124, miR‐9, miR‐124*, miR‐9*, miR‐155, and miR‐134 in various fractions of neuronal conditioned medium (NCM). NCM was harvested from cultured neurons, fractionated by size filtration, and then further used as untreated (a–f) or treated with RNase (g, h) or with proteinase (i, j), and analyzed for the expression of neuronal miRNAs as described in Materials and Methods. (a, b) Analysis of expression of miR‐124 (a) and miR‐9 (b) in unfractionated NCM (NCM‐all) and in a fraction of >100 kDa (>100 kDa), and fractions of 30–100, 10–30, and 3–10 kDa. (c–f) Analysis of the expression of miR‐124* (c), miR‐9* (d), miR‐155 (e), and miR‐134 (f) in unfractionated NCM (NCM‐all) in fractions of 30–100 and 10–30 kDa. (g) Comparison of expression of miR‐124 in untreated NCM versus NCM treated with RNase in fractions of 30–100 and 10–30 kDa. (h) Comparison of expression of miR‐9 in untreated NCM versus NCM treated with RNase in fractions of 30–100 and 10–30 kDa. (i) Comparison of expression of miR‐124 in untreated NCM versus NCM‐treated proteinase K in fractions of 30–100 and 10–30 kDa. The 30–100‐kDa fraction (left) was used as untreated or treated with proteinase K and then passed through 30‐, 10‐, and 3‐kDa filters. The fractions that remained on the 30‐, 10‐, and 3‐kDa filters were analyzed for the expression of miR‐124. The 10–30‐kDa fraction (right) was used as untreated or treated with proteinase K and then passed through 10‐ and 3‐kDa filters. The fractions that remained on the 10‐ and 3‐kDa filters were analyzed for the expression of miR‐124. (j) Comparison of the expression of miR‐9 in untreated NCM versus NCM treated with proteinase K in fractions of 30–100 and 10–30 kDa. The 30–100‐kDa fraction (left) was used as untreated or treated with proteinase K and passed through 30‐, 10‐, and 3‐kDa filters. The fractions that remained on the 30‐, 10‐, and 3‐kDa filters were analyzed for the expression of miR‐9. The 10–30‐kDa fraction (right) was used as untreated or treated with proteinase K and then passed through 10‐ and 3‐kDa filters. The fractions that remained on the 10‐ and 3‐kDa filters were analyzed for the expression of miR‐9. In (a–j), mean ± SD of three separate experiments is shown on dotplots (n = 3). In (a–f), the indicated differences were statistically significant as determined by one‐way ANOVA followed by Bonferroni post hoc test (**p < 0.01 for comparisons between two groups; a: F(4, 10) = 1,177, p < 0.0001; b: F(4, 10) = 7,154, p < 0.0001; c: F(2, 6) = 688.4, p < 0.0001; d: F(2, 6) = 3,243, p < 0.0001; e: F(2, 6) = 56.93, p = 0.0001; f: F(2, 6) = 196.9, p < 0.0001). In (g–j), the indicated differences were statistically significant as determined by unpaired Student's t test (*p < 0.5; **p < 0.01; ***p < 0.001; *****p < 0.00001) [Colour figure can be viewed at wileyonlinelibrary.com]
Figure 4
Figure 4
Analysis of the level of expression of neuronal microRNAs miR‐124, miR‐9, miR‐155, MiR‐134, and miR‐138 in microparticles and exosomes. (a) Neuronal conditioned medium (NCM) was harvested from cultured neurons as described in Materials and Methods and used unfiltered or passed through 100‐, 50‐ and 25‐nm filters and analyzed for the expression of miR‐124, miR‐9, miR‐155, miR‐134, and miR‐138. (b) NCM or brain slice conditioned medium (BSCM) were harvested from cultured neurons or organotypic brain slices, and exosomes were prepared as described in Materials and Methods. The levels of expression of miR‐124, miR‐9 and miR‐155 were measures for whole NCN (NCM‐all) or whole BSCM (BSCM‐all) versus exosomal fraction isolated from NCM (NCM‐exosomes) or BSCM (BSCM‐exosomes). (c) Western blot analysis of the expression of CNS exosomal marker TSG101 in the whole BSCM (15 μl), pellet (exosome preparation; 5 and 10 μl), and remaining supernatant (RSN, 15 μl). Brain lysate was used as a positive control (BL, 5 μl). Exosomes were precipitated from 10 ml of BSCM using total exosome isolation reagent (from cell culture medium) as described in Materials and Methods. Pellet with exosomes was re‐suspended in 100 μl of Laemmli lysis buffer for electrophoresis and further western blot analysis. (d) Comparison of the level of expression of miR‐124, miR‐9, miR‐155, miR‐124*, and miR‐9* in the whole BSCM (BSCM‐all), pellet (exosomes), and remaining supernatant (Remaining SN). In (a, d), the mean ± SD of triplicate is shown on dotplot graphs (n = 3). The indicated differences were statistically significant as determined by one‐way ANOVA followed by Bonferroni post hoc test (**p < 0.01 for comparisons between two groups; a, miR‐124: F(3, 8) = 27.96, p = 0.0001; a, miR‐9: F(3, 8) = 72.09, p < 0.0001; a, miR‐155: F(3, 8) = 208.1, p < 0.0001; a, miR‐134: F(3, 8) = 27.32, p = 0.0001; a, miR‐138: F(3, 8) = 44.65, p < 0.0001; d, miR‐124: F(2, 6) = 36.76, p = 0.0004; d, miR‐9: F(2, 6) = 5,018, p < 0.0001; d, miR‐155: F(2, 6) = 1,002, p < 0.0001; d, miR‐124*: F(2, 6) = 418.8, p < 0.0001; d, miR‐9*: F(2, 6) = 2,548, p < 0.0001). In (b), mean ± SD of quadruplicate is shown on dotplot graphs (n = 4; ****, p < 0.0001; unpaired Student's t test) [Colour figure can be viewed at wileyonlinelibrary.com]
Figure 5
Figure 5
Analysis of the level of expression of neuronal microRNAs miR‐124 and miR‐9 in HDL complexes. (a) Western blot analysis of the expression of 40‐kDa protein from HDL complexes in high molecular weight (>100 kDa) versus low molecular weight (10–100 kDa) fractions of BSCM. Ponseus S staining was used as a protein loading control. (b) Immunoprecipitation of HDL with miR‐124 and miR‐9. Anti‐HDL antibodies were adsorbed to plastic and >100‐kDa or 10–100‐kDa fractions of BSCM were added to antibodies as described in Materials and Methods. Expression of miR‐124 was assessed in HDLs bound to anti‐HDL antibodies (>100 kDa:HDL and 10–100 kDa:HDL) and in solution unbound to HDL in the >100 and 10–100‐kDa fractions (>100 and 10–100 kDa). (c, d) Comparison of expression of miR‐124 (c) miR‐9 (d) in untreated BSCM versus BSCM treated with RNase (fractions of >100 and 10–100 kDa). In (b–d), mean ± SD of three separate experiments is shown on dotplots (n = 3; **p < 0.01; ***p < 0.001; ****p < 0.0001; ****p < 0.00001; unpaired Student's t test) [Colour figure can be viewed at wileyonlinelibrary.com]
Figure 6
Figure 6
Kinetics of extracellular production of miR‐124 and miR‐9 by cultured cortical neurons. (a) Primary mouse cortical neurons were cultured as described in Material and Methods. The medium was changed once at 0 hr time point, and the expression of miR‐124, miR‐9, and snoRNA‐55 were assessed 0.5, 1, 2, 4, 24, and 72 hr later by real‐time RT PCR as described in Materials and Methods. (b, c) Primary mouse cortical neurons were cultured as described in Material and Methods. The medium was changed 2 or 5 or 8 times, and expression of miR‐124 and miR‐9 (b) or neuronal viability (c) were assessed by real‐time RT PCR or bioluminescent viability kit, respectively, as described in Materials and Methods. (d, e) Primary mouse cortical neurons were used untreated and treated with β‐galactosidase for 30 min (d, e), and the expression levels of miR‐124 and miR‐9 (d) or neuronal cell viability (e) were assessed by real‐time RT PCR or bioluminescent viability kit, respectively, as described in Materials and Methods. In (a, b), mean ± SD of five separate culture wells is shown. In (b), ****p < 0.0001, as determined by repeated measures ANOVA test (miR‐124: F(2,12) = 84.5; miR‐9: F(2,12) = 45.2). In (d), mean ± SD of three separate cell culture wells is shown (***p < 0.001; ****p < 0.0001 when compared to the same sample before the treatment with β‐galactosidase; paired Student's t test). In (c, e), mean ± SD of six separate cell culture wells is shown on box and whisker plot with the mean value indicated by “+” symbol [Colour figure can be viewed at wileyonlinelibrary.com]
Figure 7
Figure 7
Influence of monensin, ionomycin, sodium azide, and RNase treatment on the level of extracellular production of miR‐124 and miR‐9 by cultured cortical neurons. (a–d) Primary mouse cortical neurons were cultured as described in Materials and Methods. The cells were untreated or pre‐treated with ionomycin or monensin for 30 min, the media were changed to fresh media without or with ionomycin or monensin at the 0‐min time point, and the expression levels of miR‐124 (a), and miR‐9 (b) were assessed 1, 5, and 15 min later by real‐time RT PCR as described in Materials and Methods. Cumulative values of miRNA release were calculated as area under curves for miRNA release from the 1 to 15 min period (see Materials and Methods) (c). Neuronal viability is shown in (d). (e–h) Primary mouse cortical neurons were cultured as described in Materials and Methods. The cells were untreated or pre‐treated with RNase or sodium azide for 30 min, the media was changed to fresh media without or with RNase or sodium azide at the 0‐min time point. The expression levels of miR‐124 (e) and miR‐9 (f) were assessed 5, 15, 30, 60, and 120 min later by real‐time RT PCR as described in Materials and Methods. Cumulative values of miRNA release (see Materials and Methods) are shown in (g), and neuronal viability is shown in (h). In (a–c, e–g), the mean ± SD of three separate experiments is shown (n = 3). In (d, h), the mean ± SD of 4–6 separate cell culture wells is shown on box and whisker plot with the mean value indicated by “+” symbol (n = 4–6). The indicated differences were statistically significant as determined by one‐way ANOVA followed by Bonferroni post hoc test (*p < 0.05 and **p < 0.01 for comparisons between two groups; c, miR‐124: F(2, 6) = 17.24, p = 0.0033; c, miR‐9: F(2, 6) = 114.6, p < 0.0001; d: F(2,10) = 31.4, p < 0.0001; g, miR‐9: F(2, 6) = 9.849, p = 0.0127) [Colour figure can be viewed at wileyonlinelibrary.com]
Figure 8
Figure 8
Influence of tetrodotoxin on the level of extracellular production of miR‐124 and miR‐9 by cultured cortical neurons. Primary mouse cortical neurons were cultured as described in Materials and Methods. The cells were untreated or pre‐treated with tetrodotoxin (TTX) for 24 hr, the media were changed to the fresh media with or without TTX at the 0‐min time point. The expression levels of miR‐124 (a) and miR‐9 (b) were assessed 1, 5, 15, 30, 60, and 120 min later by real‐time RT PCR as described in Materials and Methods. Cumulative values for miR‐124 and miR‐9 release were calculated as for Figure 7 and are shown in (c). In (a–c), mean ± SD of three separate experiments is shown on dotpolts (n = 3). In (c), **p < 0.01; unpaired Student's t test) [Colour figure can be viewed at wileyonlinelibrary.com]
Figure 9
Figure 9
Visualization of miR‐124 in macrophages in vitro and in microglia and astrocytes in vivo in mouse adult brain. Bone marrow‐derived macrophages (BMDMs) were incubated with medium (untreated) or in 50% brain slice conditioned medium (BSCM) for 4 hr as described in Materials and Methods. The cells were stained for cell plasma membrane marker GM1 with CTB‐FITC (green) and nuclei with DAPI (blue) as described in Materials and Methods. MiR‐124 (red) was detected by fluorescence in situ hybridization as described in Materials and Methods. (a) Histology sections were prepared from the normal adult brain of perfused 8‐ to 12‐week‐old B6 female mice as described in Materials and Methods. Microglia were stained with Iba1 (green; left image), and astroglia were stained with the anti‐GFAP antibody (green; right image). MiR‐124 (red) was detected by in situ hybridization as described in Materials and Methods. Open arrows indicated microglia and astrocytes without miR‐124 hybridization signal. Filled arrows indicate miR124‐positive microglia (left image) or astroglia (right image). Nuclei were stained with DAPI (blue). The bar is 10 μm
Figure 10
Figure 10
Model of horizontal transfer of miR‐124 and miR‐9 from neurons to microglia. Electrically active neurons secrete exosomes with miR‐9, as well as miR‐124 with miR‐9 in naked form and/or in complex with low molecular weight proteins. Astrocytes secrete HDLs that bind to miR‐124 and miR‐9 in the extracellular space. Exosomes with miR‐9, miR‐124:HDL, and miR‐9:HDL complexes are taken up by microglia. MiR‐9 and miR‐124 are translocated to the cytoplasm of microglia via fusion of miR‐9‐positive exosomes with plasma membrane or transport of HDL‐miR‐124 and HDL‐miR‐9 into the cytoplasm via scavenger receptors. In the cytoplasm, miR‐124 (and possibly miR‐9) deactivate microglia, leading to downregulation of MHC class II and CD45. Inside the cell, miR‐124 are known to inhibit the CEBPα‐PU.1 pathway, whereas miR‐9 inhibit NFκB. Both of these pathways are important for macrophage/microglia activation and expression of activation markers such as MHC class II and CD45

Similar articles

Cited by

References

    1. Barteneva, N. S. , Baiken, Y. , Fasler‐Kan, E. , Alibek, K. , Wang, S. , Maltsev, N. , … Vorobjev, I. A. (2017). Extracellular vesicles in gastrointestinal cancer in conjunction with microbiota: On the border of Kingdoms. Biochimica Et Biophysica Acta ‐ Reviews on Cancer, 1868(2), 372–393. 10.1016/j.bbcan.2017.06.005 - DOI - PubMed
    1. Barteneva, N. S. , Fasler‐Kan, E. , Bernimoulin, M. , Stern, J. N. H. , Ponomarev, E. D. , Duckett, L. , & Vorobjev, I. A. (2013). Circulating microparticles: Square the circle. BMC Cell Biology, 14(1), 23 10.1186/1471-2121-14-23 - DOI - PMC - PubMed
    1. Bazzoni, F. , Rossato, M. , Fabbri, M. , Gaudiosi, D. , Mirolo, M. , Mori, L. , … Locati, M. (2009). Induction and regulatory function of miR‐9 in human monocytes and neutrophils exposed to proinflammatory signals. Proceedings of the National Academy of Sciences, 106(13), 5282–5287. 10.1073/pnas.0810909106 - DOI - PMC - PubMed
    1. Chivet, M. , Hemming, F. , Pernet‐Gallay, K. , Fraboulet, S. , & Sadoul, R. (2012, May). Emerging role of neuronal exosomes in the central nervous system. Frontiers in Physiology, 3, 145 10.3389/fphys.2012.00145 - DOI - PMC - PubMed
    1. Coolen, M. , Katz, S. , & Bally‐Cuif, L. (2013). miR‐9: A versatile regulator of neurogenesis. Frontiers in Cellular Neuroscience, 7, 220 10.3389/fncel.2013.00220 - DOI - PMC - PubMed

Publication types