

Biocompatibility of common implantable sensor materials in a tumor xenograft model
- PMID: 30367816
- PMCID: PMC6767110
- DOI: 10.1002/jbm.b.34254
Biocompatibility of common implantable sensor materials in a tumor xenograft model
Abstract
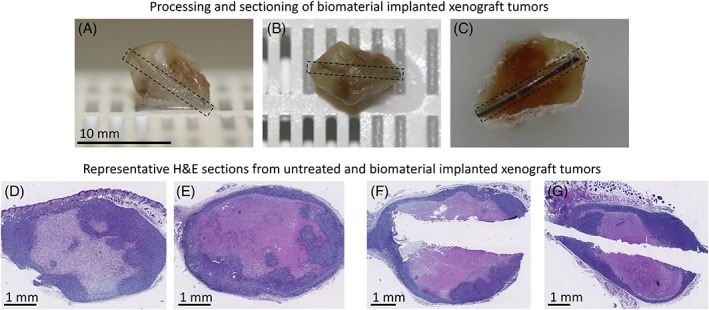
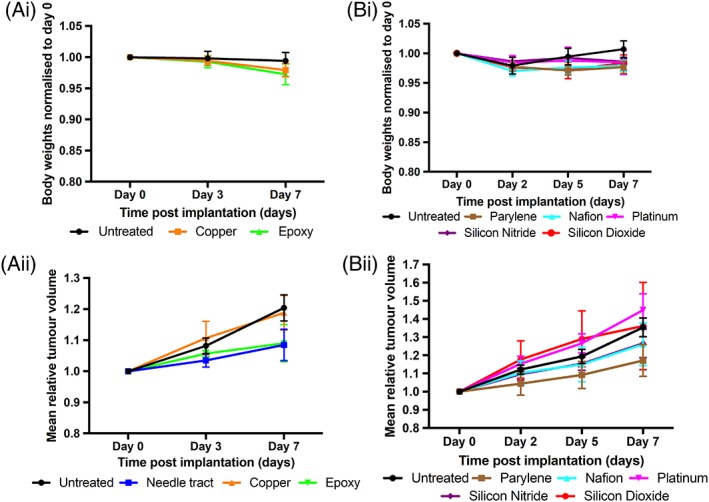
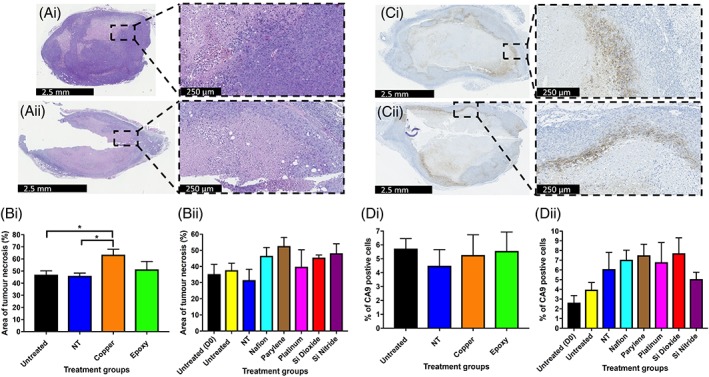
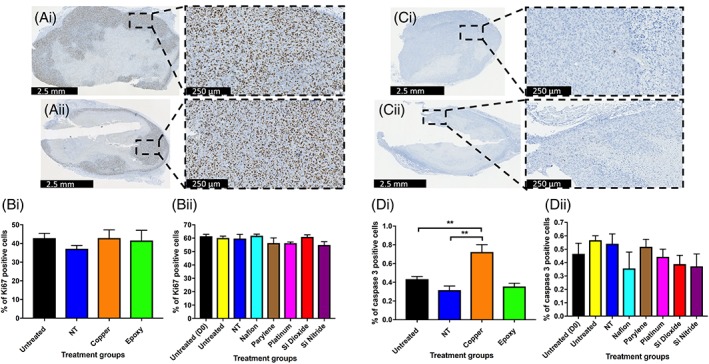
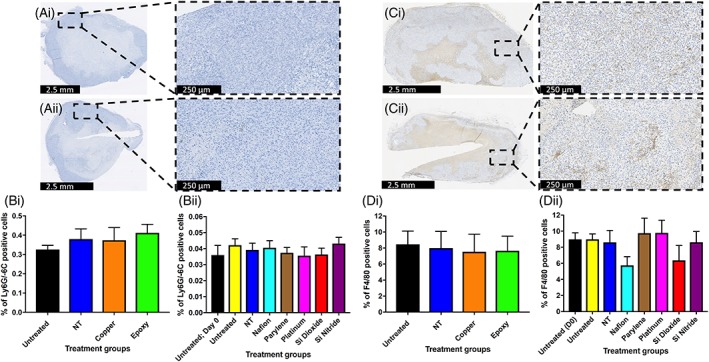
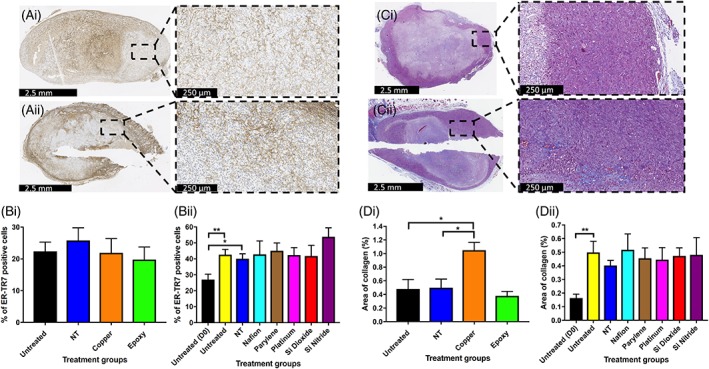
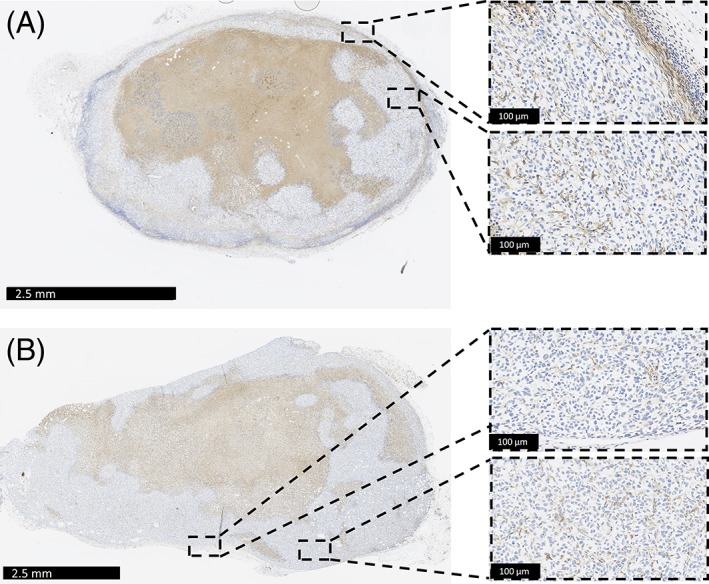
Real-time monitoring of tumor microenvironment parameters using an implanted biosensor could provide valuable information on the dynamic nature of a tumor's biology and its response to treatment. However, following implantation biosensors may lose functionality due to biofouling caused by the foreign body response (FBR). This study developed a novel tumor xenograft model to evaluate the potential of six biomaterials (silicon dioxide, silicon nitride, Parylene-C, Nafion, biocompatible EPOTEK epoxy resin, and platinum) to trigger a FBR when implanted into a solid tumor. Biomaterials were chosen based on their use in the construction of a novel biosensor, designed to measure spatial and temporal changes in intra-tumoral O2 , and pH. None of the biomaterials had any detrimental effect on tumor growth or body weight of the murine host. Immunohistochemistry showed no significant changes in tumor necrosis, hypoxic cell number, proliferation, apoptosis, immune cell infiltration, or collagen deposition. The absence of biofouling supports the use of these materials in biosensors; future investigations in preclinical cancer models are required, with a view to eventual applications in humans. To our knowledge this is the first documented investigation of the effects of modern biomaterials, used in the production of implantable sensors, on tumor tissue after implantation. © 2018 The Authors. Journal of Biomedical Materials Research Part B: Applied Biomaterials published by Wiley Periodicals, Inc. J Biomed Mater Res Part B, 2018. © 2018 Wiley Periodicals, Inc. J Biomed Mater Res Part B: Appl Biomater 107B: 1620-1633, 2019.
Keywords: biocompatibility; foreign body response; implantable biosensor; innate immune response; tumor microenvironment; tumor xenograft model.
© 2018 The Authors. Journal of Biomedical Materials Research Part B: Applied Biomaterials published by Wiley Periodicals, Inc.
Conflict of interest statement
There are no conflict of interest.
Figures
Similar articles
-
Bijel-templated implantable biomaterials for enhancing tissue integration and vascularization.Acta Biomater. 2019 Aug;94:173-182. doi: 10.1016/j.actbio.2019.06.031. Epub 2019 Jun 22. Acta Biomater. 2019. PMID: 31233892 Free PMC article.
-
The pathology of the foreign body reaction against biomaterials.J Biomed Mater Res A. 2017 Mar;105(3):927-940. doi: 10.1002/jbm.a.35958. Epub 2016 Nov 25. J Biomed Mater Res A. 2017. PMID: 27813288 Review.
-
Time course study of long-term biocompatibility and foreign body reaction to intraneural polyimide-based implants.J Biomed Mater Res A. 2018 Mar;106(3):746-757. doi: 10.1002/jbm.a.36274. Epub 2017 Nov 18. J Biomed Mater Res A. 2018. PMID: 29052368
-
Modulation of the foreign body response to implanted sensor models through device-based delivery of the tyrosine kinase inhibitor, masitinib.Biomaterials. 2013 Dec;34(38):9737-46. doi: 10.1016/j.biomaterials.2013.08.090. Epub 2013 Sep 20. Biomaterials. 2013. PMID: 24060424
-
Materials Strategies to Overcome the Foreign Body Response.Adv Healthc Mater. 2024 Jul;13(18):e2304478. doi: 10.1002/adhm.202304478. Epub 2024 May 2. Adv Healthc Mater. 2024. PMID: 38666550 Review.
Cited by
-
Advances in breast cancer diagnosis: a comprehensive review of imaging, biosensors, and emerging wearable technologies.Front Oncol. 2025 Jun 18;15:1587517. doi: 10.3389/fonc.2025.1587517. eCollection 2025. Front Oncol. 2025. PMID: 40606998 Free PMC article. Review.
-
The Importance of the Tumor Microenvironment and Hypoxia in Delivering a Precision Medicine Approach to Veterinary Oncology.Front Vet Sci. 2020 Nov 12;7:598338. doi: 10.3389/fvets.2020.598338. eCollection 2020. Front Vet Sci. 2020. PMID: 33282935 Free PMC article. Review.
-
A Novel Translational Ovine Pulmonary Adenocarcinoma Model for Human Lung Cancer.Front Oncol. 2019 Jun 19;9:534. doi: 10.3389/fonc.2019.00534. eCollection 2019. Front Oncol. 2019. PMID: 31316911 Free PMC article.
-
In-vivo studies of targeted and localized cancer drug release from microporous poly-di-methyl-siloxane (PDMS) devices for the treatment of triple negative breast cancer.Sci Rep. 2024 Jan 2;14(1):31. doi: 10.1038/s41598-023-50656-6. Sci Rep. 2024. PMID: 38167999 Free PMC article.
-
In vivo validation of a miniaturized electrochemical oxygen sensor for measuring intestinal oxygen tension.Am J Physiol Gastrointest Liver Physiol. 2019 Aug 1;317(2):G242-G252. doi: 10.1152/ajpgi.00050.2019. Epub 2019 Jun 12. Am J Physiol Gastrointest Liver Physiol. 2019. PMID: 31188641 Free PMC article.
References
-
- Ferlay J, Soerjomataram I, Dikshit R, Eser S, Mathers C, Rebelo M, Parkin DM, Forman D, Bray F. Cancer incidence and mortality worldwide: Sources, methods and major patterns in GLOBOCAN 2012. Int J Cancer 2015;136(5):359–386. - PubMed
-
- Vaupel P. Tumor microenvironmental physiology and its implications for radiation oncology. Semin Radiat Oncol 2004;14(3):198–206. - PubMed
-
- Beyer GP, Mann GG, Pursley JA, Espenhahn ET, Fraisse C, Godfrey DJ, Oldham M, Carrea TB, Bolick N, Scarantino CW. An implantable MOSFET dosimeter for the measurement of radiation dose in tissue during cancer therapy. IEEE Sensors J 2008;8(1):38–51.
-
- Marland JRK, Blair EO, Flynn BW, González‐Fernández E, Huang L, Kunkler IH, Smith S, Staderini M, Tsiamis A, Ward C and Murray A. Implantable microsystems for personalised anticancer therapy In: Mitra S and Cumming DRS, editors. CMOS Circuits for Biological Sensing and Processing. UK: Springer International Publishing; 2018, pp. 259–286.
-
- Baumann M, Krause M, Overgaard J, Debus J, Bentzen SM, Daartz J, Richter C, Zips D, Bortfeld T. Radiation oncology in the era of precision medicine. Nat Rev Cancer 2016;16:234–249. - PubMed
