. 2019 Mar;70(3):458-469.
doi: 10.1016/j.jhep.2018.10.015. Epub 2018 Oct 25.

Impaired endothelial autophagy promotes liver fibrosis by aggravating the oxidative stress response during acute liver injury

Affiliations

Impaired endothelial autophagy promotes liver fibrosis by aggravating the oxidative stress response during acute liver injury

Maria Ruart et al. J Hepatol. 2019 Mar.

Erratum in

Abstract

Background & aims: Endothelial dysfunction plays an essential role in liver injury, yet the phenotypic regulation of liver sinusoidal endothelial cells (LSECs) remains unknown. Autophagy is an endogenous protective system whose loss could undermine LSEC integrity and phenotype. The aim of our study was to investigate the role of autophagy in the regulation of endothelial dysfunction and the impact of its manipulation during liver injury.

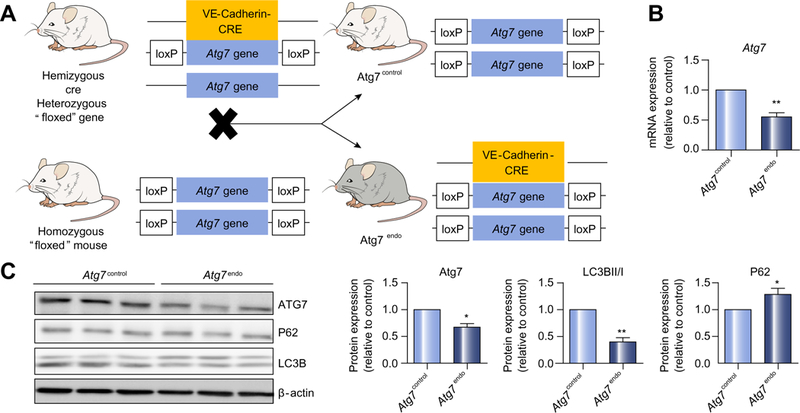
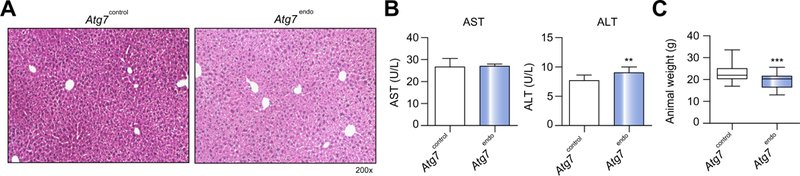
Methods: We analyzed primary isolated LSECs from Atg7control and Atg7endo mice as well as rats after CCl4 induced liver injury. Liver tissue and primary isolated stellate cells were used to analyze liver fibrosis. Autophagy flux, microvascular function, nitric oxide bioavailability, cellular superoxide content and the antioxidant response were evaluated in endothelial cells.

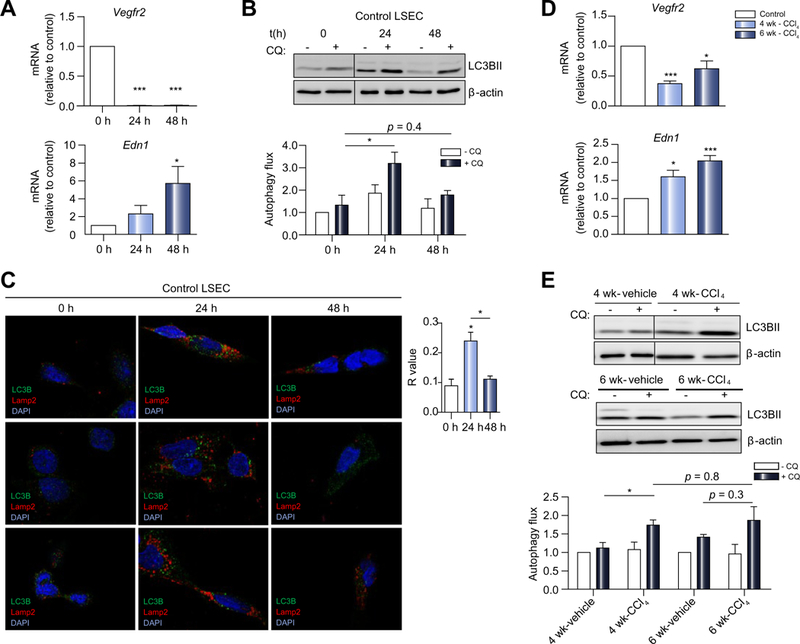
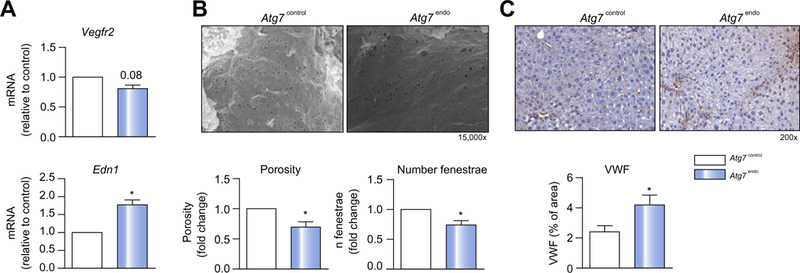
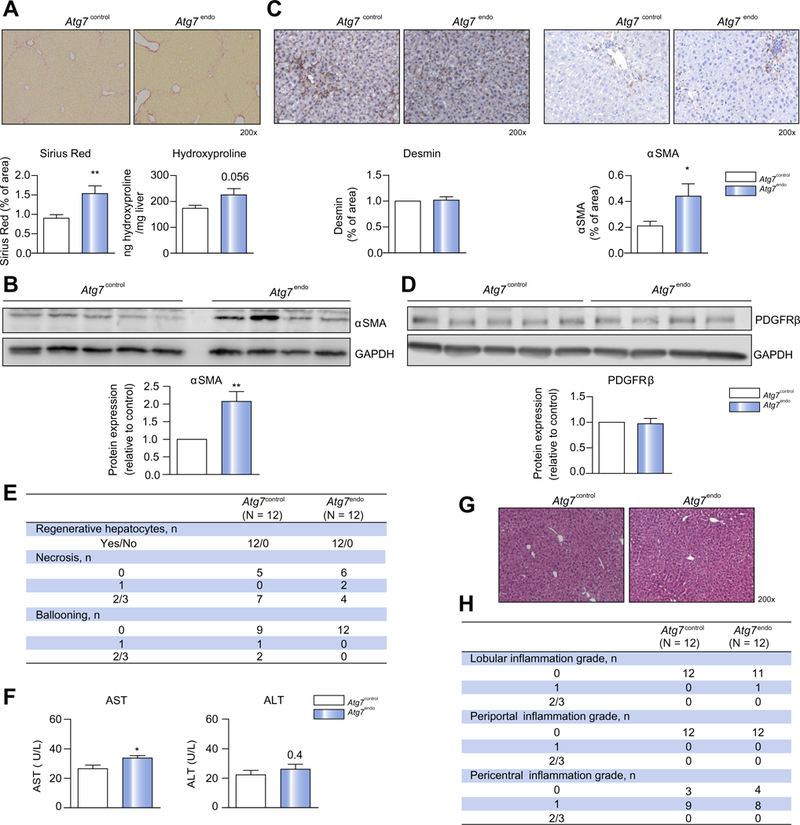
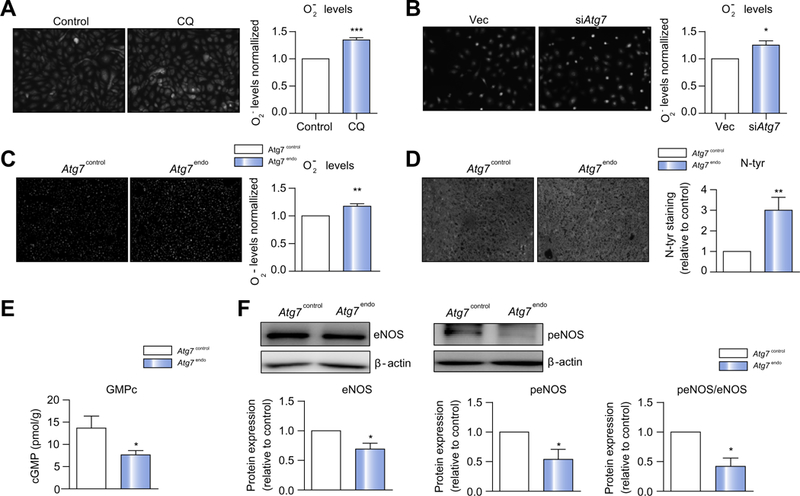
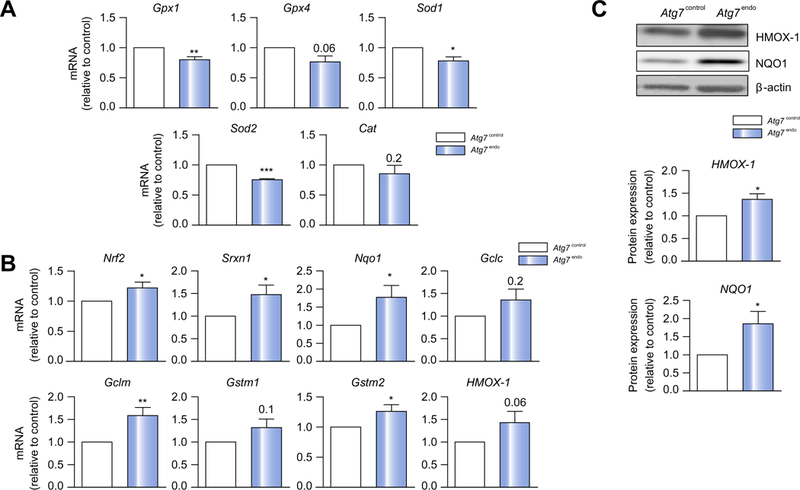
Results: Autophagy maintains LSEC homeostasis and is rapidly upregulated during capillarization in vitro and in vivo. Pharmacological and genetic downregulation of endothelial autophagy increases oxidative stress in vitro. During liver injury in vivo, the selective loss of endothelial autophagy leads to cellular dysfunction and reduced intrahepatic nitric oxide. The loss of autophagy also impairs LSECs ability to handle oxidative stress and aggravates fibrosis.

Conclusions: Autophagy contributes to maintaining endothelial phenotype and protecting LSECs from oxidative stress during early phases of liver disease. Selectively potentiating autophagy in LSECs during early stages of liver disease may be an attractive approach to modify the disease course and prevent fibrosis progression.

Lay summary: Liver endothelial cells are the first liver cell type affected after any kind of liver injury. The loss of their unique phenotype during injury amplifies liver damage by orchestrating the response of the liver microenvironment. Autophagy is a mechanism involved in the regulation of this initial response and its manipulation can modify the progression of liver damage.

Keywords: Atg7; Autophagy; Endothelial cell; Endothelial dysfunction; LSEC; Liver fibrosis; Nitric oxide; Nrf2; Oxidative stress; eNOS.


Conflict of interest statement

Conflict of interest

The authors declare no conflicts of interest that pertain to this work.

Please refer to the accompanying ICMJE disclosure forms for further details.

Figures

Fig. 1.
Fig. 1.. Autophagy is upregulated during in vitro and in vivo induced capillarization.
Primary LSECs were isolated from untreated SD rats, directly plated (t = 0 h) and grown on plastic tissue culture or onto coverglasses for 24 h (t = 24 h) and 48 h (t = 48 h). Cells were then fixed and processed for immunofluorescent microscopy. For autophagy flux assay by western blot cells were treated with CQ or vehicle during 2 h and collected thereafter. (A) mRNA changes (qPCR analysis) associated with endothelial dysfunction, showing a decrease in Vegfr2 and an increase in Edn1 and (B) LC3B11 immunoblotting with and without addition of CQ showing an increase in autophagy flux at 24 h that decreases at 48 h of culture. (C) Representative immunofluorescent images and quantification of autophagosomes (LC3B, green) with lysosomes (Lamp2, red) colocalization (R value) in LSECs confirming autophagy upregulation during capillarization. Primary LSECs isolated from rats treated with CCl4 or vehicle for 4 and 6 weeks: (D) mRNA changes (qPCR analysis) associated with endothelial dysfunction, showing a decrease in Vegfr2 and an increase in Edn1 and (E) LC3B11 immunoblotting with and without addition of CQ showing autophagy flux displaying an increase at 4 weeks and incapability of further increase at 6 weeks. Data shows mean value ± SEM of at least 3 experiments. mRNA and protein expressions are expressed as fold-change relative to control (*p ≤0.05, **p ≤0.01, ***p ≤0.001, Student’s t test or ANOVA). CCl4, carbon tetrachloride; CQ chloroquine; LSEC, liver sinusoid endothelial cell; qPCR, quantitative real-time PCR; SD, Sprague-Dawley.
Fig. 2.
Fig. 2.. Generation of Atg7endo mice.
(A) Schematic view of Atg7endo mice model generation. (B) mRNA changes (qPCR analysis) and (C) immunoblot of primary LSECs isolated from Atg7endo mice showing decreased expression of Atg7 and LC3B11/1 and increased of p62 levels. Data shows mean value ± SEM of at least 3 experiments (*p ≤0.05, **p ≤0.01, ***p ≤0.001, Student’s t test). LSEC, liver sinusoid endothelial cell; qPCR, quantitative real-time PCR. (This figure appears in colour on the web.)
Fig. 3.
Fig. 3.. Loss of LSEC autophagy does not affect liver homeostasis.
(A) Representative images of whole liver H&E staining showing a normal liver architecture. (B) Aminotransferase levels (n = 12) and (C) animal body weight (n = 69) from Atg7endo and Atg7control mice under basal conditions. Data shows mean value ± SEM. (*p ≤0.05, **p ≤0.01, ***p ≤0.001, Student’s t test). H&E, hematoxylin and eosin; LSEC, liver sinusoid endothelial cell. (This figure appears in colour on the web.)
Fig. 4.
Fig. 4.. Loss of LSEC autophagy leads to cellular dysfunction.
Atg7endo and Atg7control mice were treated every other day with CC14 i.p. for 1 week to induce mild acute liver injury. (A) mRNA changes (qPCR analysis) associated with endothelial dysfunction in primary isolated LSEC, showing a decrease in Vegfr2 and an increase in Edn1. (B) SEM representative graphs of LSEC from Atg7endo and Atg7control mice with porosity and number of fenestrae quantification, showing a loss of fenestrae (capillarization) in the Atg7endo mice. (C) Whole liver sections stained for the endothelial dysfunction marker von Willebrand factor (vWF), displaying an increase value in Atg7endo mice. Data shows mean value ± SEM (*p ≤0.05, **p ≤0.01, ***p ≤0.001, Student’s t test). LSEC, liver sinusoid endothelial cell; qPCR, quantitative real-time PCR. (This figure appears in colour on the web.)
Fig. 5.
Fig. 5.. Loss of LSEC autophagy amplifies liver fibrosis without increasing liver injury.
Atg7endo and Atg7control mice were treated every other day with CC14 i. p. for 1 week to induce mild acute liver injury (n = 24). (A) Whole liver sections stained for Sirius Red and quantification of Sirius Red-positive area (left) and Hydroxyproline stain content (right). (B) Immunoblots for αSMA in isolated HSCs from Atg7endo and Atg7control mice and protein quantification. (C) Whole liver sections stained for desmin and αSMA and quantification of positive area. (D) Immunoblots for PDGFRB in whole liver from Atg7endo and Atg7control mice and protein quantification. (E) Histological liver analysis for hepatocyte regenerative capacity and liver injury. (F) Aminotransferase levels showing an increase in aspartate aminotransferase with no change in alanine aminotransferase. (G) Representative images of whole liver sections stained for H&E and (H) histological liver analysis for inflammation scoring in Atg7endo and Atg7control mice after mild acute liver injury (CCl4 i.p. for 1 week). Representative images are shown. Data shows mean value ± SEM of at least 3 experiments (*p ≤0.05, **p ≤0.01, ***p ≤0.001, Student’s t test). CCl4, carbon tetrachloride; H&E, hematoxylin and eosin; HSC, hepatic stellate cell; LSEC, liver sinusoid endothelial cell.
Fig. 6.
Fig. 6.. Loss of LSEC autophagy increases oxidative stress and decreases NO bioavailability.
Cellular superoxide content measured by dihydroethidium in (A) HUVECs pre-treated with CQfor 12 h before H2O2 was added for 15 h, (B) TSECs transduced with empty vector or siAtg7 were also treated with H2O2 for 15 h and (C) in whole liver from Atg7endo and Atg7control mice after mild acute liver injury (CCl4 i.p. for 1 week). (D) Quantitative nitrotyrosinated proteins analysis by fluorohistochemistry in whole liver tissue from Atg7endo and Atg7control mice after mild acute liver injury (CCl4 i.p. for 1 week). (E) cGMP levels in liver homogenates from Atg7endo and Atg7control mice (CCl4 i.p. for 1 week) illustrating a significant decrease. (F) Immunoblots for total eNOS and phosphorylated eNOS in whole liver from Atg7endo and Atg7control mice and protein quantification. Representative images are shown. Protein is expressed as fold-change relative to control. Data shows mean value ± SEM of at least 3 experiments (*p ≤0.05, **p ≤0.01, ***p ≤0.001, Student’s t test). CQ, chloroquine; HUVEC, human umbilical vein endothelial cell; LSEC, liver sinusoid endothelial cell; qPCR, quantitative real-time PCR; NO, nitric oxide; TSEC, mouse LSEC.
Fig. 7.
Fig. 7.. Loss of LSEC autophagy is associated with an insufficient antioxidant response.
Atg7endo and Atg7control mice were treated every other day with CCl4 i. p. for 1 week to induce mild acute liver injury and primary LSECs were isolated. (A) mRNA changes (qPCR analysis) showing a downregulation of the classical genes that protect against oxidative stress Gpx1, Gpx4, Sod1, Sod2 and Cat and (B) mRNA changes (qPCR analysis) showing upregulation of the Nrf2-dependent antioxidative stress genes Srxn, Nqol, Gclc, Gclm, and Gstm2. (C) Immunoblots for NQO1 and HMOX1 in isolated LSEC from Atg7endo and Atg7control mice confirming an increase at the protein levels. Data shows mean value ± SEM of at least 3 experiments. mRNA expression is expressed as fold-change relative to control (*p ≤0.05, **p ≤0.01, ***p ≤0.001, Student’s t test). LSEC, liver sinusoid endothelial cell; qPCR, quantitative real-time PCR

References

    1. DeLeve LD, Wang X, Guo Y. Sinusoidal endothelial cells prevent rat stellate cell activation and promote reversion to quiescence. Hepatology 2008;48:920–930. - PMC - PubMed
    1. Ding B-S et al. Divergent angiocrine signals from vascular niche balance liver regeneration and fibrosis. Nature 2014;505:97–102. - PMC - PubMed
    1. Ding B-S et al. Inductive angiocrine signals from sinusoidal endothelium are required for liver regeneration. Nature 2010;468:310–315. - PMC - PubMed
    1. Xie G et al. Hedgehog signalling regulates liver sinusoidal endothelial cell capillarisation. Gut 2013;62:299–309. - PMC - PubMed
    1. Pasarín M et al. Sinusoidal endothelial dysfunction precedes inflammation and fibrosis in a model of NAFLD. PLoS ONE 2012;7 e32785. - PMC - PubMed

Publication types