. 2019 Apr;122(4):485-500.
doi: 10.1038/s41437-018-0151-5. Epub 2018 Oct 27.

Genetic patterns in Neotropical Magnolias (Magnoliaceae) using de novo developed microsatellite markers

Affiliations

Genetic patterns in Neotropical Magnolias (Magnoliaceae) using de novo developed microsatellite markers

Emily Veltjen et al. Heredity (Edinb). 2019 Apr.

Abstract

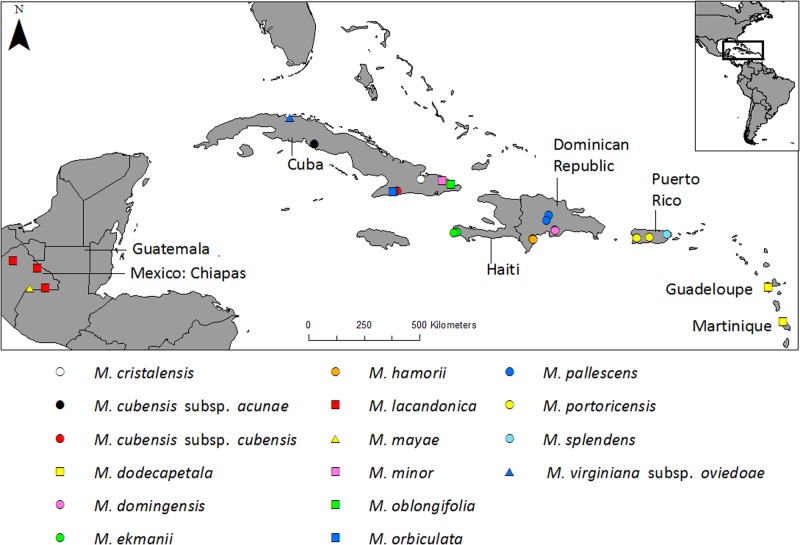
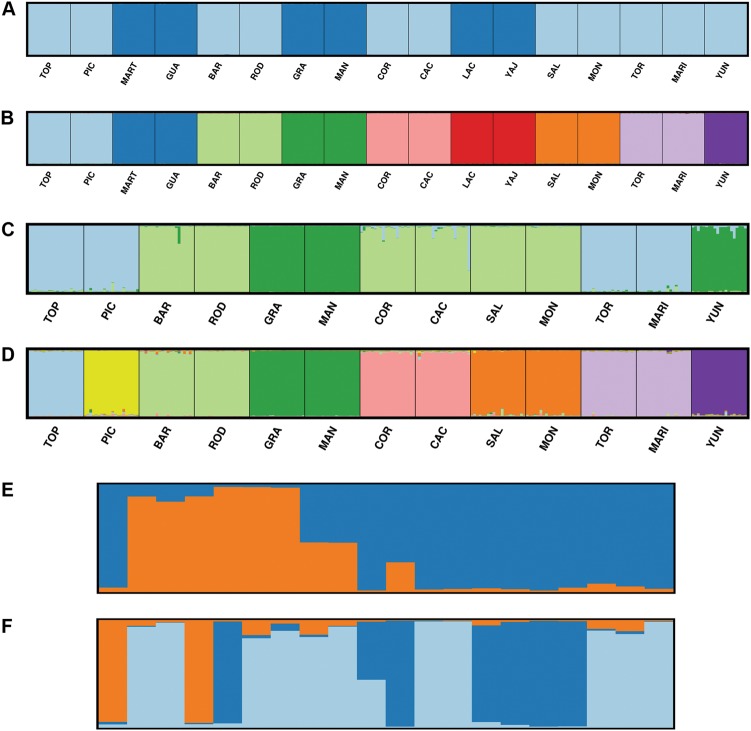
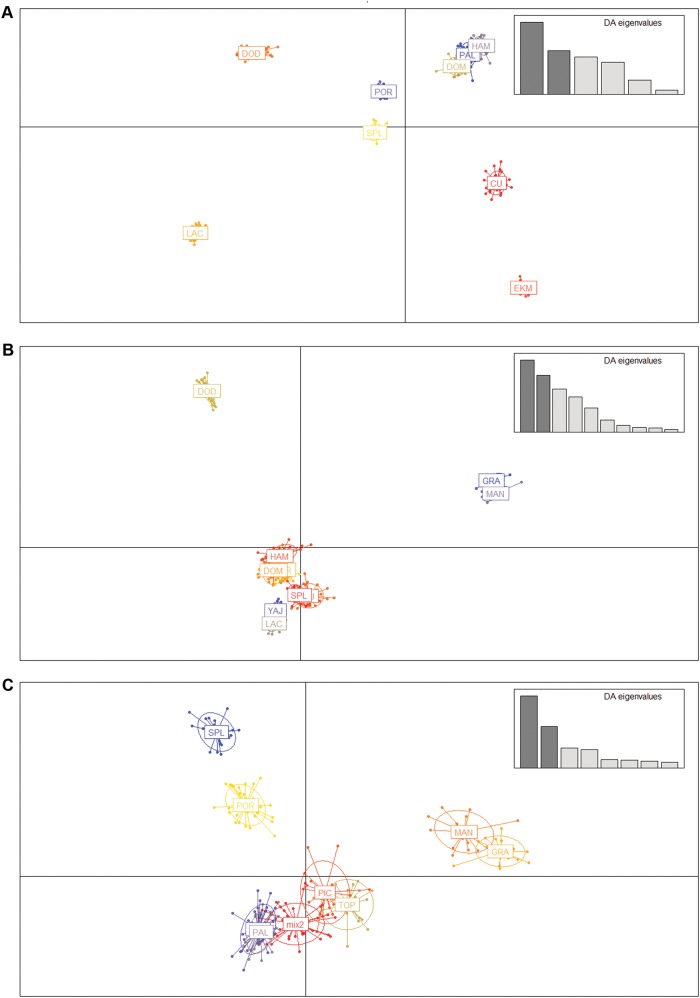
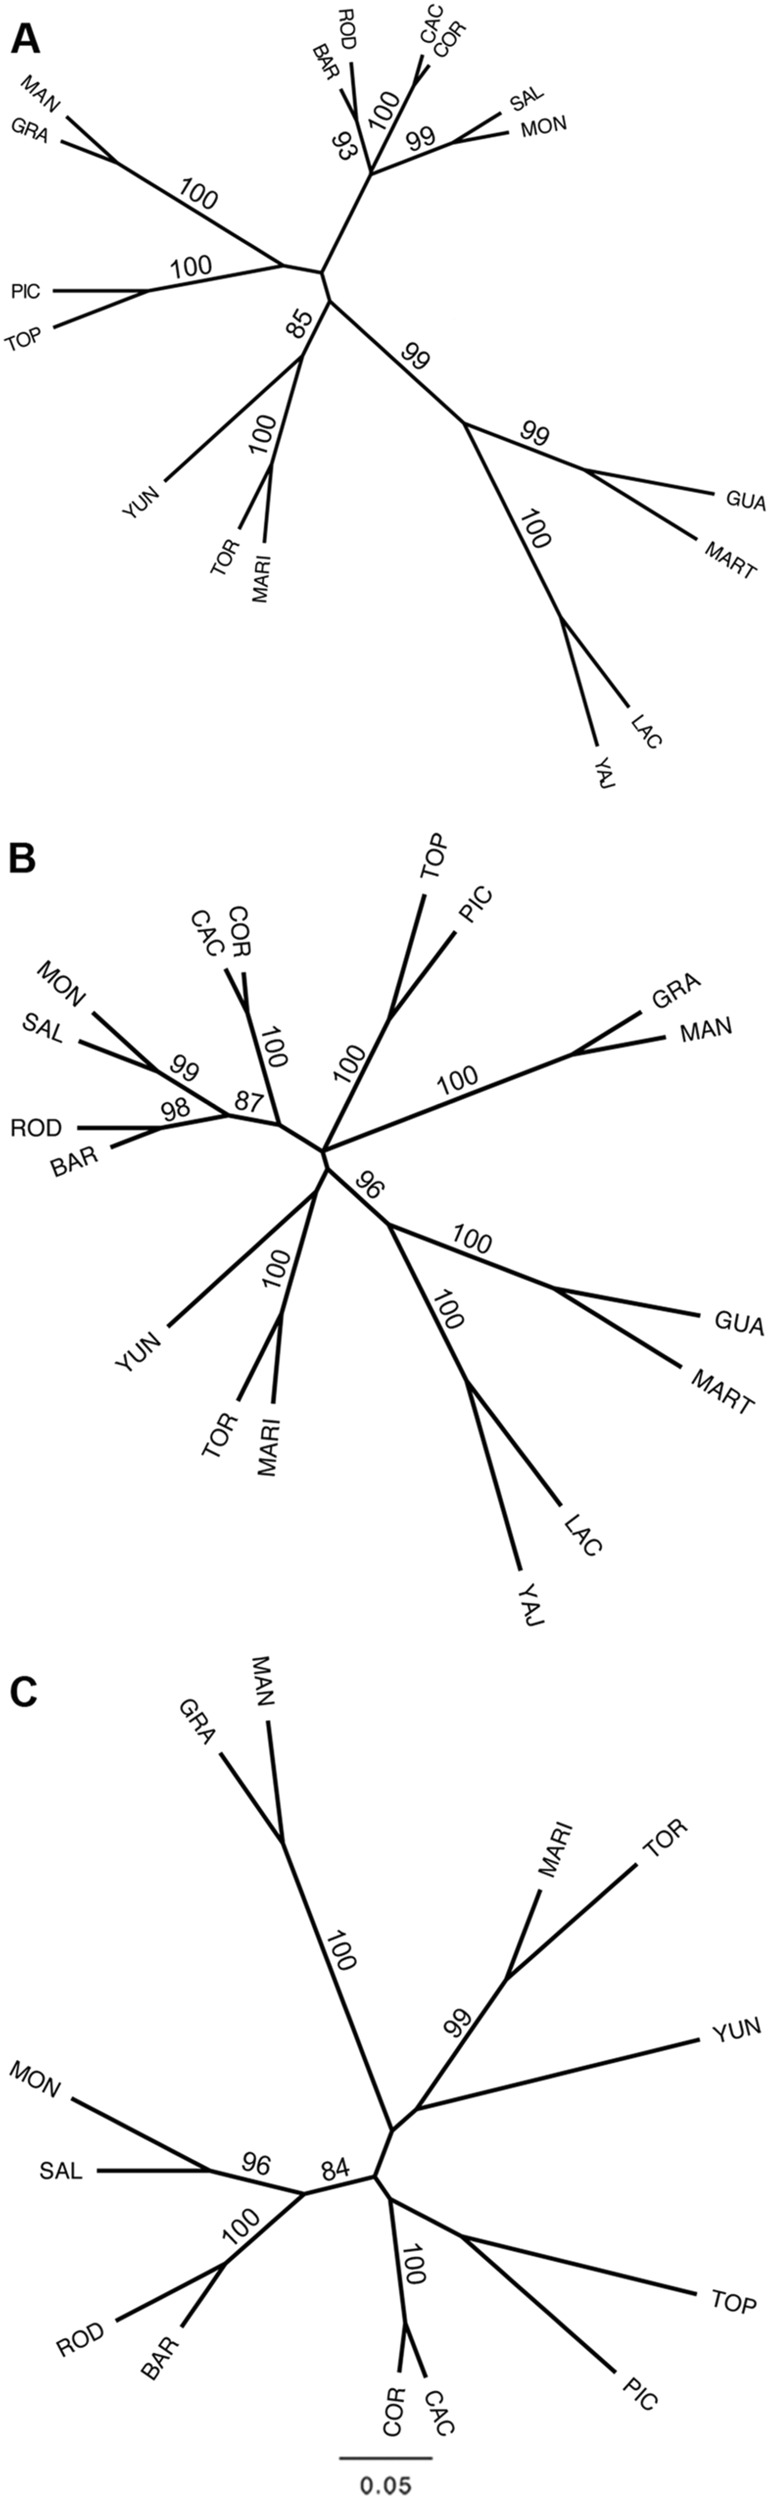
Conserving tree populations safeguards forests since they represent key elements of the ecosystem. The genetic characteristics underlying the evolutionary success of the tree growth form: high genetic diversity, extensive gene flow and strong species integrity, contribute to their survival in terms of adaptability. However, different biological and landscape contexts challenge these characteristics. This study employs 63 de novo developed microsatellite or SSR (Single Sequence Repeat) markers in different datasets of nine Neotropical Magnolia species. The genetic patterns of these protogynous, insect-pollinated tree species occurring in fragmented, highly-disturbed landscapes were investigated. Datasets containing a total of 340 individuals were tested for their genetic structure and degree of inbreeding. Analyses for genetic structure depicted structuring between species, i.e. strong species integrity. Within the species, all but one population pair were considered moderate to highly differentiated, i.e. no indication of extensive gene flow between populations. No overall correlation was observed between genetic and geographic distance of the pairwise species' populations. In contrast to the pronounced genetic structure, there was no evidence of inbreeding within the populations, suggesting mechanisms favouring cross pollination and/or selection for more genetically diverse, heterozygous offspring. In conclusion, the data illustrate that the Neotropical Magnolias in the context of a fragmented landscape still have ample gene flow within populations, yet little gene flow between populations.


Conflict of interest statement

The authors declare that they have no conflict of interest.

Figures

Fig. 1
Fig. 1
Location map of 16 Magnolia taxa (i.e. 15 Magnolia species, of which one species consists of two subspecies) from the Caribbean and Mexico, collected in the wild. Circles represent the species of the section Talauma subsection Splendentes. Squares represent species of the Talauma subsection Talauma. Triangles represent species of the section Magnolia. Classification is according to Figlar and Nooteboom (2004)
Fig. 2
Fig. 2
STRUCTURE barplots of Magnolias from the Caribbean and Mexico. The replicate with the highest likelihood score is given. a STRUCTURE barplot of dataset 1 and dataset 2, K = 2. b STRUCTURE barplot of dataset 1: K = 9. c STRUCTURE barplot of dataset 3, K = 3. d STRUCTURE barplot of dataset 3, K = 8. e STRUCTURE barplot of the Guadeloupe population of Magnolia dodecapetala. f STRUCTURE barplot of the Toro Negro population of Magnolia portoricensis. Dataset 1 comprises 340 individuals representing 17 populations, genotyped for all 63 microsatellite markers where possible, including the assumed monomorphic data (See Supplementary Table S2: categories A, B and C). Dataset 2 comprises 340 individuals representing 17 populations, genotyped for all 63 microsatellite markers where possible, excluding the assumed monomorphic data (See Supplementary Table S2: categories A and B). Dataset 3 comprises 260 individuals representing 13 populations of the 8 taxa of the section Talauma subsection Splendentes (See Table 1: Class. = TAS), genotyped for 10 microsatellite markers (See Supplementary Table S2: marker names indicated with an asterisk)
Fig. 3
Fig. 3
DAPC plots of Magnolias from the Caribbean and Mexico. DAPC: Discriminant Analysis of Principal Components. Populations and (sub)species are abbreviated cf. Table 1 and CU: Magnolia cubensis. a DAPC plot of dataset 1 which comprises 340 individuals representing 17 populations, genotyped for all 63 microsatellite markers where possible, including the assumed monomorphic data (See Supplementary Table S2: categories A, B and C). Nine clusters are visualised following the nine species: CU, DOD, DOM, EKM, HAM, LAC, PAL, POR, SPL b DAPC plot of dataset 2 which comprises 340 individuals representing 17 populations, genotyped for all 63 microsatellite markers where possible, excluding the assumed monomorphic data (See Supplementary Table S2: categories A and B). Eleven clusters are visualised: CU (behind SPL), DOD, DOM, HAM, GRA, LAC (population), MAN, PAL (behind POR), POR (behind DOM), SPL, YAJ. C DAPC plot of dataset 3 which comprises 260 individuals representing 13 populations of the 8 taxa of the section Talauma subsection Splendentes (See Table 1: Class. = TAS), genotyped for 10 microsatellite markers (See Supplementary Table S2: marker names indicated with an asterisk). mix1: all 40 individuals of DOM and 3 individuals of SAL. mix2: all 40 individuals of PAL and 1 individual of PIC. Nine clusters are visualised: GRA, MAN, mix1 (behind PAL), mix2, PAL, PIC, POR, SPL, TOP
Fig. 4
Fig. 4
NJ trees of the Magnolias from the Caribbean and Mexico. Unrooted networks are constructed by the Neighbour-joining (NJ) method based on Nei’s genetic distance: DA (Nei et al. 1983). Bootstrap values above 70 are depicted. a NJ-tree of dataset 1 which comprises 340 individuals representing 17 populations, genotyped for all 63 microsatellite markers where possible, including the assumed monomorphic data (See Supplementary Table S2: categories A, B and C). b NJ-tree of dataset 2 which comprises 340 individuals representing 17 populations, genotyped for all 63 microsatellite markers where possible, excluding the assumed monomorphic data (See Supplementary Table S2: categories A and B). c NJ-tree of dataset 3 which comprises 260 individuals representing 13 populations of the 8 taxa of the section Talauma subsection Splendentes (See Table 1: Class. = TAS), genotyped for 10 microsatellite markers (See Supplementary Table S2: marker names indicated with an asterisk).

References

    1. Aitken SN, Yeaman S, Holliday JA, Wang T, Curtis-McLane S. Adaptation, migration or extirpation: climate change outcomes for tree populations. Evol Appl. 2008;1(1):95–111. - PMC - PubMed
    1. Aparicio A, Hampe A, Fernández-Carrillo L, Albaladejo RG. Fragmentation and comparative genetic structure of four mediterranean woody species: complex interactions between life history traits and the landscape context. Divers Distrib. 2012;18(3):226–235.
    1. Austerlitz F, Mariette S, Machon N, Gouyon PH, Godelle B. Effects of colonization processes on genetic diversity: differences between annual plants and tree species. Genetics. 2000;154(3):1309–1321. - PMC - PubMed
    1. Bousquet J, Strauss SH, Doerksen AH, Price RA. Extensive variation in evolutionary rate of rbcL gene sequences among seed plants. Proc Natl Acad Sci USA. 1992;89(16):7844–7848. - PMC - PubMed
    1. Brownstein MJ, Carpten JD, Smith JR. Modulation of non-templated nucleotide addition by Taq DNA polymerase: primer modifications that facilitate genotyping. Biotechniques. 1996;20(6):1004–1006. - PubMed

Publication types

LinkOut - more resources