

Structural covariance across the lifespan: Brain development and aging through the lens of inter-network relationships
- PMID: 30368995
- PMCID: PMC6478172
- DOI: 10.1002/hbm.24359
Structural covariance across the lifespan: Brain development and aging through the lens of inter-network relationships
Abstract
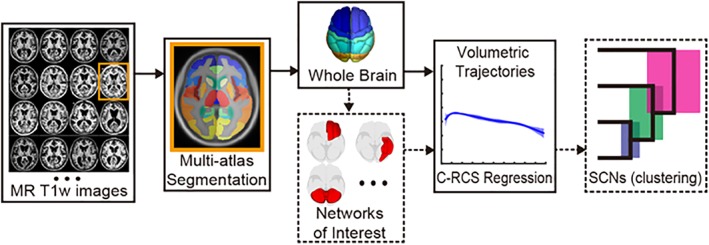
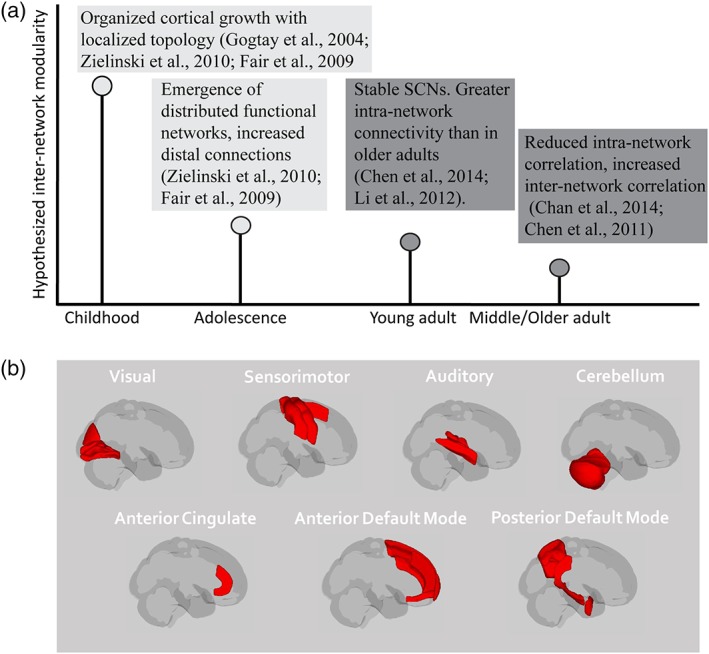
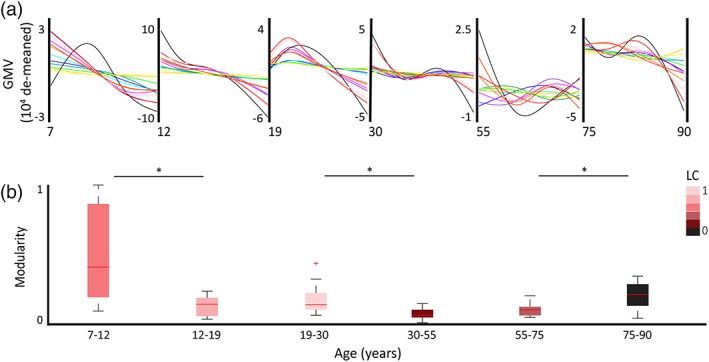
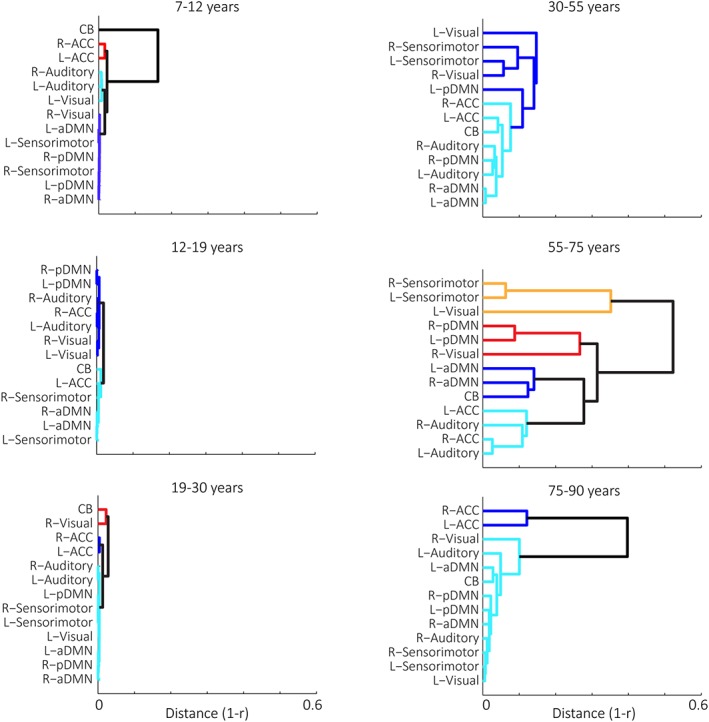
Recent studies have revealed that brain development is marked by morphological synchronization across brain regions. Regions with shared growth trajectories form structural covariance networks (SCNs) that not only map onto functionally identified cognitive systems, but also correlate with a range of cognitive abilities across the lifespan. Despite advances in within-network covariance examinations, few studies have examined lifetime patterns of structural relationships across known SCNs. In the current study, we used a big-data framework and a novel application of covariate-adjusted restricted cubic spline regression to identify volumetric network trajectories and covariance patterns across 13 networks (n = 5,019, ages = 7-90). Our findings revealed that typical development and aging are marked by significant shifts in the degree that networks preferentially coordinate with one another (i.e., modularity). Specifically, childhood showed higher modularity of networks compared to adolescence, reflecting a shift over development from segregation to desegregation of inter-network relationships. The shift from young to middle adulthood was marked by a significant decrease in inter-network modularity and organization, which continued into older adulthood, potentially reflecting changes in brain organizational efficiency with age. This study is the first to characterize brain development and aging in terms of inter-network structural covariance across the lifespan.
Keywords: MRI; T1w; brain; brain development; lifespan aging; structural covariance.
© 2018 Wiley Periodicals, Inc.
Conflict of interest statement
The authors have no biomedical financial interests or potential conflicts of interest.
Figures

References
-
- Alexander‐Bloch, A. , Raznahan, A. , Bullmore, E. , & Giedd, J. (2013). The convergence of maturational change and structural covariance in human cortical networks. The Journal of neuroscience : The Official Journal of the Society for Neuroscience, 33(7), 2889–2899. 10.1523/JNEUROSCI.3554-12.2013 - DOI - PMC - PubMed
Publication types
MeSH terms
Grants and funding
- UL1 TR000445/TR/NCATS NIH HHS/United States
- P50 HD027802/HD/NICHD NIH HHS/United States
- N01-NS-9-2315/NS/NINDS NIH HHS/United States
- R01 EB017230/EB/NIBIB NIH HHS/United States
- N01-NS-9-2319/NS/NINDS NIH HHS/United States
- R01 HD067254/HD/NICHD NIH HHS/United States
- N01-MH9-0002/MH/NIMH NIH HHS/United States
- NIH R03EB012461/National Institute on Aging, NIH/International
- U54 HD083211/HD/NICHD NIH HHS/United States
- NCATS/NIH UL1 TR000445/National Institute on Aging, NIH/International
- P50 HD052121/HD/NICHD NIH HHS/United States
- R01 HD044073/HD/NICHD NIH HHS/United States
- NIH R21NS064534/National Institute on Aging, NIH/International
- 1452485/National Science Foundation/International
- R01 NS049096/NS/NINDS NIH HHS/United States
- N01-HD02-3343/National Institute of Child Health and Human Development/International
- R03 EB012461/EB/NIBIB NIH HHS/United States
- DA/NIDA NIH HHS/United States
- N01-NS-9-2316/NS/NINDS NIH HHS/United States
- P30 AG066507/AG/NIA NIH HHS/United States
- N01-NS-9-2314/NS/NINDS NIH HHS/United States
- NIH R21EY024036/National Institute on Aging, NIH/International
- R21 EY024036/EY/NEI NIH HHS/United States
- R21 NS064534/NS/NINDS NIH HHS/United States
- N01-NS-9-2320/NS/NINDS NIH HHS/United States
- K08 HD060850/HD/NICHD NIH HHS/United States
- N01-NS-9-2317/NS/NINDS NIH HHS/United States
- NH/NIH HHS/United States
- NIH R01EB017230/National Institute on Aging, NIH/International
LinkOut - more resources
Full Text Sources
Medical
